

Abstract
BACKGROUND AND PURPOSE
Although 6-mercaptopurine and azathioprine are effective treatments in inflammatory bowel disease (IBD), many patients discontinue treatment because of side effects. 6-Thioguanine (6-TG) may be an alternative rescue therapy in these intolerant patients but the pharmacokinetics of 6-TG are not fully described. Here we have measured the pharmacokinetics of the biotransformation of 6-TG into the pharmacologically active metabolites, 6-thioguanine nucleotides (6-TGN), in IBD patients.
EXPERIMENTAL APPROACH
In 12 patients with IBD, levels of 6-TGN and activities of thiopurine S-methyltransferase, xanthine oxidase and hypoxanthine guanine-phosphoribosyl-transferase were measured in a two-stage (i.v. and p.o. administration of 0.3 mg·kg−1 6-TG), prospective study. Median exposure of 6-TGN in red blood cells (RBC) was expressed as the ratio of the area under the curve (AUC) per mg 6-TG after i.v. dosing and that after p.o. dosing.
KEY RESULTS
The median AUC per mg 6-TG was 1068 (p.o.) and 7184 (i.v.) pmol·h (8 × 10⁸ RBC)−1. Median exposure of 6-TGN in RBC was 15% (9–28). Hypoxanthine guanine-phosphoribosyl-transferase activity correlated with peak 6-TGN and with AUC per mg (r = 0.7, P = 0.02 and r = 0.6, P = 0.03 respectively). Thiopurine S-methyltransferase activity was inversely related to AUC per mg (r=−0.8, P = 0.001), whereas that of xanthine oxidase was correlated with a lower peak 6-TGN (r=−0.7, P = 0.02).
CONCLUSIONS AND IMPLICATIONS
The great variability of the AUC per mg for 6-TG observed after p.o. and i.v. administration of 6-TG, was partly explained by variability in activities of metabolizing enzymes. Exposure of 6-TGN was low in all patients.
Keywords: pharmacokinetics, 6-thioguanine, 6-thioguanine nucleotides, inflammatory bowel disease, TPMT, XO, HGPRT
Introduction
The immune modulating thiopurines 6-mercaptopurine (6-MP) and its pro-drug azathioprine (AZA) have proven efficacy, especially in maintenance of remission of inflammatory bowel disease (IBD). (Present et al., 1980; Candy et al., 1995; George et al., 1996; Sandborn et al., 2000; Timmer et al., 2007) However, in a recent study up to 40% of IBD patients discontinued AZA or 6-MP prematurely due to adverse events. (Jharap et al., 2010) Administration of another thiopurine, 6-thioguanine (6-TG), has been proposed as a rescue therapy for patients with IBD who are intolerant of AZA and/or 6-MP (de Boer et al., 2007b; 2008).
Thiopurines need extensive intracellular metabolism in order to become pharmacologically active as the end-metabolites 6-thioguanine nucleotides (6-TGN) (Figure 1). In contrast to AZA and 6-MP, 6-TG is directly metabolized to 6-TGN. Metabolism of 6-TG occurs via three competing metabolic pathways. Hypoxanthine guanine-phosphoribosyl-transferase (HGPRT) converts 6-TG into 6-thioguanosine monophosphate (6-TGMP) and by subsequent kinase activity, 6-thioguanosine diphosphate (6-TGDP) and 6-thioguanosine triphosphate (6-TGTP) are produced. There is a wide inter-individual variability not only in total 6-TGN concentrations measured in red blood cells (RBC), but also in 6-TGMP, 6-TGDP and 6-TGTP concentrations, which is not explained by different 6-TG dosages per kilogram bodyweight or thiopurine S-methyltransferase (TPMT) activity (de Boer et al., 2007a) In contrast to 6-MP and AZA, the generation of the proposed hepatotoxic 6-methyl-mercaptopurine-ribonucleotides (6-MMP) is avoided, as 6-TG is directly converted into 6-TGN. Xanthine oxidase (XO), present in liver cells and enterocytes, catabolyses 6-TG to 6-thiouric acid after deamination. 6-TG is also a substrate for the enzyme TPMT, which methylates 6-TG to 6-methyl-thioguanine (6-MTG) and also methylates the generated 6-TGN.
Figure 1.
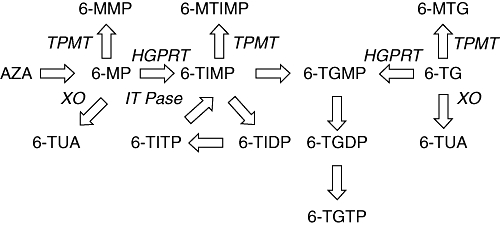
Simplified thiopurine metabolism scheme (modified from de Boer et al., 2007b). Azathioprine (AZA) is non-enzymically degraded to 6-mercaptopurine (6-MP). Thiopurine S-methyltransferase (TPMT) methylates 6-MP into 6-methylmercaptopurine (6-MMP). 6-MP is converted into 6-thioinosine-monophosphate (6-TIMP) by hypoxanthine guanine phosphoribosyl transferase (HGPRT) to be converted ultimately into the 6-thioguanine nucleotides (6-TGN). These 6-TGN consist of three phosphorylated forms: 6-thioguanosine monophosphate (6-TGMP), 6-thioguanosine diphosphate (6-TGDP) and 6-thioguanosine triphosphate (6-TGTP). 6-TIMP may also be methylated by TPMT leading to 6-methyl-thioinosine monophosphate (6-MTIMP). In a cycle, 6-TIMP is phosphorylated to 6-thioinosine diphosphate (6-TIDP), subsequently to 6-thioinosine triphosphate (6-TITP) and ultimately back to 6-TIMP due to the inosine triphosphate pyrophosphatase (ITPase). 6-Thioguanine (6-TG) is directly converted into 6-TGN but may also be methylated by TPMT leading to 6-methyl-thioguanine (6-MTG). The enzyme xanthine oxidase inactivates 6-TG and 6-MP by the formation of 6-thiouric-acid (6-TUA).
Although 6-TGN are the proposed pharmacologically active metabolites of 6-TG, few data are available with regard to pharmacokinetic aspects of 6-TGN in IBD patients during 6-TG therapy. We performed a pharmacokinetic study of 6-TGN in relation to the activity of enzymes involved in its metabolism in an attempt to unravel the complex pharmacology and metabolism of 6-TG in IBD patients.
Methods
Patient selection
The medical ethical committee of VU University Medical Center approved this study and all included patients signed an informed consent form. Patients with a diagnosis of IBD for at least 6 months (clinically, histologically and endoscopically confirmed), aged between 18 and 70 years, intolerant or refractory to standard AZA or 6-MP treatment and in need for immunosuppressive maintenance therapy, were eligible for the study. Exclusion criteria were: known duodenal or jejunal Crohn's disease (CD) or small bowel surgery interfering with intestinal resorptive capacity, pregnancy, expected pregnancy within 6 months, concomitant use of allopurinol, angiotensin converting enzyme-inhibitors, furosemide, bone marrow suppression (leucocytes and/or platelets counts < lower normal limit), presence of active infection (C-reactive protein > 1 × upper normal limit in combination with fever), anaemia (haemoglobin concentration < lower normal limit), impaired renal function (serum creatinine > 2 × upper normal limit), elevated liver tests (>2 × upper normal limit), known cardiac failure (New York Heart Association scale, grade II-IV) and history of tuberculosis, hepatitis B or C, or human immunodeficiency virus infection.
Subjects
Twelve IBD patients were enrolled between July 2005 and June 2007. Patient characteristics are summarised in Table 1. Two out of 12 patients were male. Median age was 41 years (range 26–61). The indication for initiation of 6-TG therapy was AZA or 6-MP intolerance in eleven patients. One patient was both intolerant and non-responsive to 6-MP therapy. All except one patient used co-medication during the administration of 6-TG. Five out of 12 patients used concomitant mesalazine and two out of 12 patients used antacids during 6-TG therapy. Mean body mass index of the patients was 24.9 kg·m−2 (SD ± 2.8) and the mean i.v. and p.o. 6-TG dosage were 0.29 mg·kg−1 (SD ± 0.02) and 0.29 mg·kg−1 (SD ± 0.02) respectively. In all patients, the time between discontinuation of AZA or 6-MP therapy and 6-TG administration was 4 to 6 weeks.
Table 1.
Summary of patient characteristics
| Total (n) | 12 |
| Sex (n) (male/female) | 2/10 |
| Age (years) (median + range) | 41 (26–61) |
| Weight (kg) (median + range) | 73 (62–91) |
| BMI (kg·m−2) (mean + SD) | 24.9 (±2.8) |
| Disease (n) (CD/UC) | 6/6 |
| Location of disease in UC patients (n = 6) | |
| Pancolitis | 2 |
| Distal colitis | 4 |
| Location of disease in CD patients (n = 6) | |
| Colon | 1 |
| Colon and ileum | 2 |
| Ileum | 3 |
| Nature of CD (n = 6) | |
| Stricturing disease | 3 |
| Fistulizing disease | 1 |
| Inflammatory disease | 2 |
| Median duration of IBD (years) (median + range) | 10 (1–54) |
| Smoking/non-smoking (n) | 3/9 |
| Type of previous thiopurine (n) | |
| AZA | 5 |
| 6-MP | 6 |
| AZA and 6-MP | 1 |
| Reason for 6-TG initiation | |
| AZA/6-MP refractory | 0 |
| AZA/6-MP intolerance | 11 |
| AZA/6-MP intolerance and refractory | 1 |
| Medication used during 6-TG administration | |
| Mesalazine/ no Mesalazine (n) | 5/7 |
| Antacids / no antacids (n) | 2/10 |
| Oral 6-TG dose (mg·kg−1) (mean + SD) | 0.29 (±0.02) |
| Intravenous 6-TG dose (mg·kg−1) (mean + SD) | 0.29 (±0.02) |
6-MP, 6-mercaptopurine; 6-TG, 6-thioguanine; AZA, azathioprine; BMI, body mass index; CD, Crohn's disease; IBD, inflammatory bowel disease; UC, ulcerative colitis.
Study design
The study had a two-stage (i.v. and p.o. administration), prospective, single-centre pharmacological design. At entry, patient demographics and clinical history were collected. At baseline (t = 0), five of the 12 patients received 6-TG (0.3 mg·kg−1) intravenously during 30 min via a catheter. At day 7 (t = 1), these five patients ingested a single capsule with 6-TG (same dosage as at t = 0). The remaining seven patients ingested a single capsule with 6-TG (0.3 mg·kg−1) at baseline (t = 0). At day 7 (t = 1), these seven patients received 6-TG (same dosage as at t = 0) intravenously during 30 min. Every patient received a target dosage of 0.3 mg·kg−1 6-TG. However, 6-TG capsules were only available in 18, 21 and 24 mg, requiring slight adaptation of the dose. Following each blood sampling, the catheter was flushed with approximately 5 mL heparin (10 units·mL−1, in 0.9% NaCl). Therefore, the first 5 mL of drawn blood were not used for the determination of metabolites. Samples of blood (7 mL) were drawn before and at 15, 30, 45, 60, 90, 120, 150, 180, 210, 240, 300, 360, 420 and 480 min after p.o. or i.v. administration of 6-TG and sent to the laboratory to determine 6-TGN levels. Blood samples were also drawn at 24 and 72 h after administration of 6-TG in seven of the 12 included patients to determine 6-TGN concentration.
Four weeks after initiation of maintenance p.o. 6-TG therapy, 6-TGN levels were measured to determine steady state levels in eight patients. The status of the enzymes TPMT, XO and HGPRT was determined either by genotyping and/or phenotyping at baseline. All blood samples for metabolite measurements were immediately stored at 4°C. Within 8 h all samples were stored at −80°C at the Pharmacy Department for further analysis.
Outcome measures
Outcome measures were 6-TGN levels in RBC after p.o. and i.v. 6-TG administration. In addition, the genotype of TPMT and the enzyme activity of TPMT in RBC, XO in plasma and HGPRT in RBC and peripheral blood mononuclear cells (PBMC) were determined.
Measurement of 6-TGN
The 6-TGN were measured according to the method of Shipkova et al., (2003), which is a modification of the method of Dervieux and Boulieu (1998)
Briefly, RBC were obtained from heparinized whole blood samples, by centrifuging whole blood at 160 g for 10 min. The plasma layer was discarded and RBC were washed three times with phosphate buffered saline. The washed cells were stored at −20°C until analysis.
In each measurement, RBC were isolated from 7 mL of blood taken from the patients, yielding a RBC count of approximately 3.5 × 10¹²·L−1 (range 2.5–4.5 × 10¹²·L−1). In the 250 µL used for the analysis there are on average 8.8 × 10⁸ RBC. Each measurement was corrected by using the determined RBC count to get a concentration in pmol per 8.0 × 10⁸ RBC. Analysis took place within 1 week. (de Graaf et al., 2008) In total, 20 µL internal standard 5-bromouracil (5-BU; 314 µmol·L−1), 20 µL of D,L-dithiothreitol (DTT, 1.1 mol·L−1) and 70 µL water were added to prepared RBC (250 µL) in a test-tube. After vortex-mixing, perchloric acid (70%; 45 µL) was added to the mixture. The tube was vortex-mixed for 90 s and centrifuged. The supernatant was incubated for 1 h at 100°C. After cooling, 50 µL of the supernatant was injected on the column.
To separate the 6-TG, 6-MMP and 5-BU, a reversed phase gradient high performance liquid chromatography (HPLC) system was developed. The column used was a Symmetry C18 (150 × 3.9 mm; particle size 5 µm; Waters Corp., Etten-Leur, the Netherlands). Mobile phase A consisted of 3% acetonitrile in potassium dihydrogen phosphate 20 mM; pH 3.5. Mobile phase B was acetonitrile. A gradient was carried out at a flow of 1.2 mL·min−1. 6-TG, 6-MMP and 5-BU were detected at 343, 303 and 280 nm respectively, by switching wavelengths between the peaks. Elution was performed at ambient temperature.
Calibration standards were made by adding known concentrations to RBC. Calculation of the 6-TGN and 6-MMP concentrations were made by interpolation of peak height ratios on the calibration line and expressed in pmol per 8.0 × 10⁸ RBC. The detection and lower limit of quantification were 5 and 20 pmol·(8.0 × 10⁸ RBC)−1 for both analyses respectively. Between runs, imprecision was 6.9% and 7.2% for 6-TGN and 6-MMP respectively.
Determination of TPMT genotype
Genotyping of TPMT in leukocyte DNA was accomplished by means of Restriction Fragment-Length Polymorphism analysis adapted from Yates et al. (Yates et al., 1997) Patients were screened for presence of TPMT*2 allele (characterized by the G238C mutation) and the TPMT*3 allele (with subtype A containing the mutations: G460A and A719G, subtype B containing only the G460A mutation and subtype C containing only the A719G mutation).
Determination of enzyme activity
Enzyme activities were measured at 37°C in a shaking water bath. Enzyme activities were expressed in nmol of product formed per hour per mg protein or per l06 cells (TPMT in RBC, HGPRT in RBC and PBMC, XO in plasma). Linearity of the reactions in respect to time and amount of cell extract was ascertained.
Determination of HGPRT activity
The HGPRT activities were measured both in PBMC and RBC. The activity in the RBC provides insight in the capacity of these cells to form 6-TGN, because the formation is directly dependent on the HGPRT activity; the activity in PBMC demonstrates whether cells potentially involved in an inflammatory response, have sufficient capacity to activate 6-TG. After centrifugation of the heparinized blood sample, plasma was pipetted off and stored at −20°C until analysis of TPMT activity. RBC and PBMC were isolated as described earlier. (Peters et al., 1981) The PBMC were snap-frozen in liquid nitrogen and stored at −80°C until analysis. The RBC pellet was suspended in deionized water, sonicated and diluted in 250 mM Tris-HCI (pH 7.4) containing 25 mM MgCI2. The PBMC were suspended in 100 mM Tris-HCl (pH 7.4) containing 25 mM MgCI2 and 1 mM EDTA and sonicated. The HGPRT activity was measured in 20 000 g supernatants diluted with the Tris buffers.
The incubation mixture (40 µL) for the HGPRT assay for RBC contained 125 mM Tris-HCI (pH 7.4), 12.5 mM MgCI2, 1.86 mM 5-phosporibosyl-1-pyrophosphate (PRPP) (Sigma-Aldrich Corp., St. Louis, MO, USA), RBC supernatant (18–28 µg protein per assay) and 0.15 mM (8-14C) hypoxanthine (47 mCi·mmol−1, Moravek Biochemicals Inc., Brea, CA, USA). After 15–30 min the HGPRT assay for RBC was stopped by heating at 95°C for 5 min. The HGPRT assay for PBMC contained 50 mM Tris-HCl (pH 7.4), 12.5 mM MgCI2, 1 mM EDTA, 1.86 mM PRPP and PBMC extracts (equivalent to 2 × 10⁵ cells). The assay for PBMC was inhibited by adding 10 µL 8 N formic acid, because of the higher heat stability of the PBMC HGPRT. Separation of nucleotides from nucleosides and bases on polyethyleneimine-cellulose and determination of radioactivity have been described previously. (Peters et al., 1981)
Determination of TPMT activity
The TPMT assay in RBC was performed essentially as described earlier by Keizer-Garritsen et al. (2003) Briefly, the RBC pellet was suspended in deionized water, centrifuged at 14 000×g and diluted in potassium phosphate buffer (final concentration 77 mM, pH 7.5). The reaction was started by addition of S-adenosyl-L-methionine (final concentration 50 µM), allopurinol (final concentration 20 µM) and 6-MP (final concentration 2.2 mM), stabilized in diethylsulphoxide (0.03% final) and DTT (final concentration 0.25 mM), incubated at 37°C and inhibited after 1 or 2 h by addition of ice-cold perchloric acid, kept on ice for 10 min, centrifuged and the resulting supernatant was neutralized with potassium hydrogen phosphate. The HPLC analysis of the product 6-MMP was performed using a Phenomenex aqua column (150 × 4.6 mm, 3 µm) with 20 mM ammonium acetate/methanol (2:1), pH 4.5, at 1 mL·min−1 isocratic elution. Detection was at 292 nm (for 6-MMP) and 325 nm (for 6-MP). Quantification was performed by interpolation in a calibration line. Activity was expressed as pmol 6-MMP formed per hour per mg protein. In a normal sex and age matched population the mean TPMT activity was 30.0 ± 6.3 pmol·h−1 per mg protein (20 volunteers; median 31, range 14.7 to 42.8, data not shown).
Determination of XO activity
The XO assay was performed using the Amplex® Red Xanthine/Xanthine Oxidase Assay kit (Invitrogen, Carlsbad, CA, USA). In the assay, XO catalyses the oxidation of hypoxanthine or xanthine, to uric acid and superoxide. In the reaction mixture, the superoxide spontaneously degrades to hydrogen peroxide, which in the presence of horseradish peroxidase, reacts stoichiometrically with Amplex Red reagent to generate the red-fluorescent oxidation product, resorufin. Resorufin production was monitored using a standard curve based on purified XO from buttermilk with a Tecan Spectrafluor platereader (Mannedorf, Zurich, Switzerland) using a 550 nm excitation filter and a 595 nm emission filter.
Pharmacokinetic analysis
Demographic data are given descriptively. The spss 16.0 for windows was used for statistical analysis. Summary statistics for continuous variables were expressed as median with range (minimum–maximum) as a skewed distribution was observed due to the small group of included patients. Levels of 6-TGN were analysed using WinNonlin Version 4.1 (Pharsight Corporation, Mountain View, CA, USA). A non-compartment model was used and the following variables were calculated: time to reach the peak 6-TGN concentration (Tmax), peak 6-TGN concentration (Cmax), elimination half-life time (T1/2), extrapolated area under the curve. This allowed us to directly compare the area under the curve (AUC) of 6-TGN between i.v. and p.o. administration. In seven of 12 patients 6-TGN levels were determined after 24 and 72 h after 6-TG administration, these data were also used to estimate 6-TGN AUC. Area Under Curve was corrected for mg dose after analysis by WinNonlin. In all twelve patients, 6-TGN concentrations were determined during the first 8 h after 6-TG administration and after 7 days, before the second administration of 6-TG. No difference with regard to the half-life of 6-TGN after p.o. or i.v. administration of 6-TG was to be anticipated. Considering this, the 6-TGN concentrations during the first 8 h and after 7 days were entered in the program WinNonlin to calculate the half-life of 6-TGN. 6-TG has a half-life of 5 days (Lennard et al., 1993; Lancaster et al., 2001; Derijks et al., 2006) Between two 6-TG administrations, a period of 7 days was used, which may have led to accumulation of 6-TGN concentrations, thereby influencing the AUC of 6-TGN after the second administration of 6-TG. To take this into account, the program WinNonlin was used to calculate the AUC after the first and second dose of 6-TG. According to the formula AUClast – C0/beta + Clast/beta, the program WinNonlin calculated the actual AUC of 6-TGN after the second 6-TG administration.
This study focused on the pharmacokinetics of the biotransformation of 6-TG into 6-TGN. The exposure of 6-TGN in RBC was expressed as a percentage calculated by dividing AUC/mg after i.v. administration of 6-TG by AUC/mg after p.o. administration of 6-TG. As 6-TGN are the pharmacologically active end metabolites of 6-TG, the difference in 6-TGN concentrations after p.o. and i.v. administration of 6-TG may provide valuable information concerning pharmacokinetics of 6-TGN.
We did not determine the parent compound 6-TG in this study as it is rapidly transported into the cells and becomes undetectable. For this reason, we could not determine the bioavailability of 6-TG itself.
Materials
All materials were of the highest available chemical purity. 6-TG, 6-MMP, DTT and 5-BU were purchased from Sigma (St. Louis, MO, USA). 6-MMP was purchased from Acros organics (Geel, Belgium). The XO was from Invitrogen, Carlsbad, CA, USA. The drug and molecular target nomenclature used in this study follows Alexander et al. (2009)
Results
6-TGN pharmacokinetics
The pharmacokinetic parameters for individual subjects are summarized in Table 2. There was a great variability between patients concerning Cmax, Tmax and AUC of 6-TGN after p.o. and i.v. administration of 6-TG. Median maximum 6-TGN concentration after p.o. administration was 141 pmol·(8.0 × 10⁸ RBC)−1[range 30–563 pmol·(8.0 × 10⁸ RBC)−1], compared to 902 pmol·(8.0 × 10⁸ RBC)−1[range 538–2006 pmol·(8.0 × 10⁸ RBC)−1] after i.v. administration (Wilcoxon, P = 0.002) (Figure 2). Median time to reach maximum 6-TGN concentration was comparable for p.o. and i.v. administration (Wilcoxon, P = 0.365) (Figure 2). The 6-TGN AUC per mg 6-TG also showed large inter- and intra-individual differences between the p.o. and i.v. administration of 6-TG. Median AUC per mg 6-TG was 1068 pmol*h·(8.0 × 10⁸ RBC)−1*mg (range 205–3149) versus 7184 pmol*h·(8.0 × 10⁸ RBC)−1*mg (range 2186–23111) after p.o. and i.v. administration respectively (Wilcoxon, P = 0.002) (Figure 2). As expected, levels of 6-MMP were undetectable.
Table 2.
Pharmacokinetic parameters of 6-thioguanine (6-TG) administered orally (p.o.)* and intravenously (i.v.)**
| Subject | First dose | Second dose | Cmax* | Tmax* | AUC/mg* | T1/2* | Cmax** | Tmax** | AUC/mg** | T1/2** | Steady state 6-TGN |
|---|---|---|---|---|---|---|---|---|---|---|---|
| 1 | i.v. | p.o. | 80 | 7 | 701 | 113.3 | 577 | 8 | 4893 | 113.4 | |
| 2 | i.v. | p.o. | 131 | 2 | 972 | 105.9 | 1055 | 7 | 8729 | 105.1 | |
| 3 | i.v. | p.o. | 63 | 8 | 525 | 119.3 | 538 | 6 | 4086 | 119.3 | |
| 4 | i.v. | p.o. | 125 | 7.8 | 980 | 111.6 | 1061 | 3.5 | 7698 | 110.3 | 300 |
| 5 | i.v. | p.o. | 195 | 7 | 1835 | 140.8 | 887 | 8 | 8802 | 144.5 | 791 |
| 6 | p.o. | i.v. | 30 | 7.5 | 205 | 109.1 | 561 | 7 | 2186 | 53.2 | 790 |
| 7 | p.o. | i.v. | 316 | 7.5 | 1870 | 82.5 | 1212 | 6.5 | 6669 | 76.7 | 2810 |
| 8 | p.o. | i.v. | 138 | 7.5 | 1155 | 100.8 | 724 | 6.5 | 4984 | 96.9 | 1300 |
| 9 | p.o. | i.v. | 168 | 7.5 | 1593 | 118.6 | 733 | 3.5 | 7929 | 134.5 | 1960 |
| 10 | p.o. | i.v. | 185 | 24.1 | 1458 | 83.4 | 954 | 2.5 | 9677 | 121.7 | 1130 |
| 11 | p.o. | i.v. | 563 | 6.5 | 3149 | 92.6 | 2006 | 26 | 23 111 | 164.3 | 6070 |
| 12 | p.o. | i.v. | 143 | 6.5 | 437 | 47.3 | 916 | 1.5 | 2657 | 51.7 | |
| Median | 141 | 7.5 | 1068 | 107.6 | 902 | 6.5 | 7184 | 111.8 | 1215 | ||
| Range | 30–563 | 2–24.1 | 205–3149 | 47.3–140.8 | 538–2006 | 1.5–26 | 2186–23 111 | 51.7–164.3 | 300–6070 |
6-TGN, 6-thioguanine nucleotides [pmol·(8.0 × 10⁸ RBC)−1]; AUC/mg, area under curve per mg 6-TG [pmol*h·(8.0 × 10⁸ RBC)−1× mg]; Cmax, maximum 6-TGN concentration [pmol·(8.0 × 10⁸ RBC)−1]; RBC, red blood cell; steady state [pmol·(8.0 × 10⁸ RBC)−1]; T1/2, elimination half-life time (h); Tmax, time to reach maximum 6-TGN concentration (h).
Figure 2.
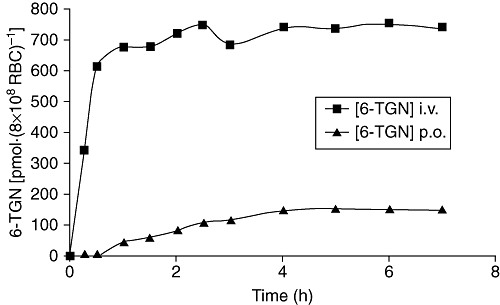
Median 6-thioguanine nucleotide (6-TGN) concentration after p.o. or i.v. administration of 6-thioguanine (6-TG). Data show the median 6-TGN concentration in RBC [as pmol·(8 × 10⁸ RBC)−1] in 12 patients before and at 15, 30, 45, 60, 90, 120, 150, 180, 210, 240, 300, 360 and 420 min after p.o. or i.v. administration of 6-TG (0.3 mg·kg−1). The i.v. infusion lasted for 30 min. Median maximum 6-TGN concentration after p.o. administration was 141, compared to 902 pmol·(8 × 10⁸ RBC)−1 after i.v. administration (Wilcoxon, P = 0.002). Median time to reach maximum 6-TGN concentration was similar for p.o. and i.v. administration.
After p.o. administration, one patient reached maximum 6-TGN concentration after 24 h, which was clearly longer than all other patients. This patient had obstructive CD located in the terminal ileum and was refractory to previous treatment with both AZA and 6-MP.
The T1/2 of RBC 6-TGN following 6-TG withdrawal was 4.6 days. Total elimination of 6-TGN after withdrawal of the drug is to be expected after approximately 23 days.
Exposure of 6-TGN in RBC varied between 9% and 28% and median exposure of 6-TGN was 15% (Table 3). One patient had an exposure of 6-TGN of 9%, which was the lowest exposure of 6-TGN observed in this series. Her concomitant medications were mesalazine, antacids and cyclosporine; drugs not known to interfere with 6-TG absorption. Another patient had a 6-TGN exposure of 28%, which was the highest exposure found in this study. During p.o. ingestion of 6-TG, she used loperamide. There was no statistical significant relation between exposure of 6-TGN in RBC and the use of mesalazine (Mann–Whitney, P = 0.465), antiacids (Mann–Whitney, P = 0.086) or loperamide (Mann–Whitney, P = 0.83).
Table 3.
Exposure of 6-thioguanine nucleotides (6-TGN) in red blood cells and concomitant medication
| Subject | Exposure of 6-TGN (%) | Mesalazine | Antacids | Loperamide |
|---|---|---|---|---|
| 1 | 14 | No | No | No |
| 2 | 11 | No | No | Yes |
| 3 | 13 | Yes | Yes | No |
| 4 | 13 | No | No | No |
| 5 | 21 | Yes | No | No |
| 6 | 9 | Yes | Yes | No |
| 7 | 28 | No | No | Yes |
| 8 | 23 | No | No | No |
| 9 | 20 | No | No | No |
| 10 | 15 | No | No | No |
| 11 | 14 | Yes | No | No |
| 12 | 16 | Yes | No | No |
| Median | 14.7 (9–28) |
TPMT genotype
The TPMT genotype was determined in all patients, and all subjects possessed wild-type alleles (TPMT*1/TPMT*1).
TPMT, XO and HGPRT activity
The TPMT activity in RBC from the IBD patients varied over a twofold range (Table 4). The HGPRT activities were measured both in PBMC and RBC. The HGPRT activity in PBMC varied over a fivefold range and the median value in PBMC was only about 5% of that found in RBC (Table 4). Activity of XO was measured in plasma and the relevant data are shown in Table 4.
Table 4.
TPMT, HGPRT and XO activity
| Subject | TPMT activity measured in RBC (pmol·h−1 per mg protein) | HGPRT activity measured in RBC (nmol·h−1·per mg protein) | HGPRT activity measured in PBMC (nmol·h−1/ 106 cells) | XO activity measured in plasma (mU·mL−1·h−1) |
|---|---|---|---|---|
| 1 | 23.49 | 215.98 | 14.69 | 1.07 |
| 2 | 32.89 | 268.92 | 7.95 | 0.75 |
| 3 | 20.60 | 194.00 | 8.81 | 2.01 |
| 4 | 25.61 | 243.68 | 4.75 | 0.69 |
| 5 | 23.00 | 256.80 | 4.80 | 1.02 |
| 6 | 29.23 | 221.72 | 10.49 | 0.69 |
| 7 | 29.54 | 204.12 | 7.37 | 0.49 |
| 8 | 29.50 | 160.87 | 13.79 | 0.70 |
| 9 | 19.57 | 230.10 | 19.78 | 1.19 |
| 10 | 18.95 | 238.19 | 6.99 | 1.15 |
| 11 | 16.15 | 293.90 | 11.91 | 0.21 |
| 12 | 34.47 | 254.89 | 14.84 | 1.42 |
| Median | 24.55 | 234.15 | 9.65 | 0.89 |
| Range | 16.15–34.47 | 160.87–293.90 | 4.75–19.78 | 0.21–2.01 |
HGPRT, hypoxanthine guanine-phosphoribosyl-transferase; PBMC, peripheral blood mononuclear cells; RBC, red blood cells; TPMT, thiopurine S-methyltransferase; XO, xanthine oxidase.
The TPMT activity was significantly inversely correlated to AUC/mg (Pearson, r=−0.60, P = 0.04) and to T1/2 (Pearson, r=−0.83, P = 0.001) after i.v. administration of 6-TG. A significant correlation was found between HGPRT activity in RBC and the Cmax values (Pearson, r = 0.65, P = 0.02) and HGPRT activity in RBC and AUC/mg (Pearson, r = 0.64, P = 0.03) after i.v. administration of 6-TG. Xanthine oxidase activity had a statistically significant inverse correlation with Cmax after i.v. administration of 6-TG (Pearson, r=−0.65, P = 0.02).
Patient 11 had the lowest TPMT and XO activities; however, HGPRT activity was higher compared with the other patients (Table 4). This patient had the highest Cmax and AUC/mg after p.o. and i.v. administration of 6-TG (Table 2).
Steady state 6-TGN results
To determine steady state levels, 6-TGN levels were also measured in eight patients after 4 weeks of maintenance 6-TG therapy. The prescribed 6-TG dosage maintained unchanged (approximately 0.3 mg·kg−1). No correlation was found between steady state 6-TGN levels and 6-TG dosage (Pearson, r = 0.29, P = 0.48). In contrast, there was a significant correlation between exposure of 6-TGN and steady state 6-TGN levels (Pearson, r = 0.78, P = 0.04). To avoid large variability, one patient was excluded during calculation of the correlation between exposure of 6-TGN and steady state 6-TGN levels, because of very high steady state 6-TGN levels.
Discussion
This study describes the pharmacokinetic aspects of the biotransformation of 6-TG into 6-TGN after p.o. and i.v. 6-TG administration, focusing on exposure of 6-TGN in RBC. Although large inter-individual differences of 6-TGN pharmacokinetics were observed after both p.o. and i.v. administration of 6-TG, the exposure of 6-TGN in RBC was in a remarkably small and reproducible range. Differences in 6-TGN pharmacokinetics were partly explained by enzyme activities, especially when administered intravenously.
There was a great variability between patients in terms of Cmax, Tmax and AUC of 6-TGN per mg 6-TG after p.o. and i.v. administration of 6-TG. Our data seem to be consistent with results from previous studies. Derijks et al. reported a large inter-patient variability in 6-TGN concentrations in RBC at 1, 2, 4 and 8 weeks of 6-TG therapy in IBD patients receiving 20 mg 6-TG per day. (Derijks et al., 2006; de Boer et al., 2007a) The large variability in the pharmacokinetics of 6-TGN between patients was also confirmed in leukaemia patients, and is in line with that of the parent drug itself. (Erb et al., 1998; Lancaster et al., 2001; Josefine et al., 2009) Previous studies reported that 6-TG bioavailability resembles 6-MP bioavailability and varies between 5% and 37%, which is consistent with the exposure of 6-TGN of 15% observed in this study. (Bronk et al., 1988; Deibert et al., 2003).
Pharmacogenetics and enzyme activity may play an important role in the large variability of 6-TGN pharmacokinetics. Although 6-TG seems to be less affected by TPMT and XO compared with 6-MP, genetic polymorphisms and different phenotypes of TPMT, HGPRT and XO may result in different levels of 6-TGN, and consequently, may increase the risk of development of adverse events (Lennard et al., 1993; Erb et al., 1998; McBride et al., 2000).
In this study, TPMT genotyping showed that all patients possessed wild-type alleles, however TPMT activities varied between 16.2 and 34.5 pmol·h−1·per mg protein. Although the patient data are within the normal range of TPMT activities, this range might be large enough to induce differences in 6-TGN levels. An increase in TPMT activity was significantly associated with a decrease in AUC/mg and T1/2 of 6-TG, which can be explained by the conversion of 6-TG into 6-MTG via TPMT, at the expense of 6-TGN formation. This inverse relationship was most obvious in one female patient who had the lowest TPMT activity of all included patients, resulting in the highest AUC/mg and Cmax.
However, the wide inter-individual variance in 6-TGN concentrations can probably not be explained by TPMT activity only, as 6-TG is also metabolized by the anabolic enzyme HGPRT. In this study, the activity of HGPRT in RBC showed a significant correlation with regard to 6-TGN pharmacokinetics after i.v. administration of 6-TG, which was clearest in the female patient described above, as this patient's HGPRT activity was higher than those in the other patients. In contrast, no correlation was found between HGPRT activity in PBMC and 6-TGN levels. The HGPRT activity in PBMC varied considerably, resulting in a range that exceeded the range of HGPRT activities previously published (Peters et al., 1981) This might be related to a potential involvement of the white blood cells in an inflammatory response, because phytohemagglutinin stimulation of white blood cells, a surrogate marker for such a response, induced an increase in HGPRT activities (Peters and Veerkamp, 1982; 1983).
Although HGPRT and TPMT appear to be responsible for a large part of the metabolism of 6-TG, the catabolic enzyme XO is involved in the first-pass metabolism of 6-TG in the small intestine and liver. XO activity is subject to common genetic polymorphism leading to large inter-individual variations (Guerciolini et al., 1991; Relling et al., 1992; Yamaguchi et al., 2007; Ansari et al., 2008) In our study, the median XO activity was 0.89 mU·mL−1·h−1 with a range of 0.21–2.01 mU·mL−1·h−1. A decrease in XO activity was significantly associated with a rise in 6-TGN concentration. This inverse tendency was seen in the same patient mentioned before, as she showed the lowest XO activity and consequently, the highest Cmax and AUC/mg. This finding underlines the potential increased myelotoxicity of thiopurine derivates, including 6-TG, when using allopurinol concomitantly (Sparrow et al., 2005).
As mentioned previously, a wide inter-individual variance not only in total 6-TGN concentrations but also in 6-TGMP, 6-TGDP and 6-TGTP concentrations has been reported in CD patients during 20 mg 6-TG therapy. (de Boer et al., 2007a) This variation could not be explained by different 6-TG dosages per kilogram bodyweight or TPMT activity. The results in this paper, specifically aimed at pharmacokinetic characteristics as established by sequential sampling revealed a wide inter-individual variation in total 6-TGN concentrations, data that are in line with and corroborating the results of the study mentioned above. In addition, this study shows that TPMT, XO and HGPRT activity contribute to this wide inter-individual variation, unravelling part of the complex pharmacology and metabolism of 6-TG.
However, there was no correlation between enzyme activity and 6-TGN pharmacokinetics after p.o. administration of 6-TG. After i.v. administration of 6-TG, 100% of the compound is available for conversion into 6-TGN. After p.o. administration of 6-TG, only a part of the compound 6-TG is available for such conversion, because of a first-pass effect in the liver or enterocytes. Therefore, if a correlation exists between enzyme activity and 6-TGN level, it is more likely that this correlation would be found after i.v. administration of 6-TG, as was demonstrated by our results.
Various other factors may contribute to the large inter-patient variability in 6-TGN pharmacokinetics. A possible factor that may influence the absorption of 6-TG and consequently may influence pharmacokinetics of 6-TGN is the location of the (intestinal) disease. Although in five of six CD patients the disease was located in the terminal ileum, there was no difference in pharmacokinetic parameters of 6-TGN in RBC between ulcerative colitis and CD patients. None of the patients with CD had lesions in the upper gastrointestinal tract or had undergone a previous small bowel resection, potentially interfering with the absorption of thiopurines.
Another important factor determining 6-TGN pharmacokinetics is co-medication. Two patients used loperamide during 6-TG administration. Remarkably, one of them had an exposure of 6-TGN of 28%, which was the highest 6-TGN exposure found in this study. Use of concomitant loperamide can result in slow gastro-intestinal transit, which may enhance 6-TGN levels after p.o. ingestion of 6-TG. (Hurwitz et al., 1994) Five out of 12 patients used mesalazine during 6-TG administration in our study, but there was no significant difference in 6-TGN concentration, AUC and exposure of 6-TGN between patients with or without concomitant use of mesalazine. This may appear to be in contrast with previous published data, which showed that the use of mesalazine significantly increases 6-TGN levels, allegedly via TPMT inhibition, when administered in combination with AZA or 6-MP. (Szumlanski and Weinshilboum, 1995; Erb et al., 1998; Dewit et al., 2002; Xin et al., 2005; de Boer et al., 2007c). TPMT appears to play a less pivotal role in 6-TG metabolism, which may explain the unchanged 6-TGN pharmacokinetics during 6-TG administration combined with mesalazine.
With 6-TG therapy, 6-TGN concentrations reach steady state after 4 weeks, suggesting a half-life of 5 days. (Lennard et al., 1993; Lancaster et al., 2001; Derijks et al., 2006) The T1/2 of 6-TGN in our patients was 4.6 days in RBC, which is consistent with these data. The half-life time of 4.6 days required a 25 day wash-out period for complete elimination, which was clinically not feasible in these patients with exacerbated IBD. Therefore, the second measurements were performed after 7 days. This methodology required correction for this accumulation by adjusted calculation of different pharmacological parameters.
Five of the 12 patients were lost to extended follow-up. Although the Cmax and Tmax of 6-TGN seemed to occur within the first 8 h, no raw data for the next 72 h were available in these patients, which could imply that the Cmax and Tmax of 6-TGN could have occurred later than in the first 8 h.
Although more women are affected by IBD, there is an over-representation of females in this study. There was no significant influence of gender on 6-TGN pharmacokinetics in this study (data not shown). However, due to the small number of patients, it is unknown whether gender influences 6-TGN pharmacokinetics.
Comparison of pharmacokinetics of 6-TGN after p.o. and i.v. administration of 6-TG in combination with enzyme genotype and phenotype may provide more insight in toxicity and refractoriness to 6-TG treatment in IBD patients by determination of first-pass effects. A correlation between enzyme activity and 6-TGN levels may justify therapeutic drug monitoring by determining 6-TGN levels and enzyme activity to avoid 6-TG-induced toxicity or to prevent therapeutic failure.
In conclusion, this is an extended study about 6-TGN pharmacokinetics in IBD patients comparing p.o. and i.v. administration of 6-TG. In both administration schedules, a large inter-patient variability occurred in Cmax, Tmax and the AUC of 6-TGN, associated with a low, but consistent exposure of 6-TGN in RBC. By measuring the enzyme activities related to thiopurine metabolism, this study showed that not only TPMT and HGPRT, but also XO influenced 6-TGN pharmacokinetics.
Acknowledgments
The authors thank AC Laan and N Losekoot for technical assistance during a part of these investigations.
Glossary
Abbreviations
- 5-BU
5-bromouracil
- 6-MMP
6-methyl-mercaptopurine-ribonucleotides
- 6-MP
6-mercaptopurine
- 6-MTG
6-methyl-thioguanine
- 6-TG
6-thioguanine
- 6-TGDP
6-thioguanosine diphosphate
- 6-TGMP
6-thioguanosine monophosphate
- 6-TGN
6-thioguanine nucleotides
- 6-TGTP
6-thioguanosine triphosphate
- 6-TIMP
6-thioinosine-monophosphate
- 6-TUA
6-thiouric acid
- AUC
area under the curve
- AUC0–∞
extrapolated area under the curve
- AZA
azathioprine
- BMI
body mass index
- CD
Crohn's disease
- Cmax
peak 6-TGN concentration
- DTT
D,L-dithiothreitol
- HGPRT
hypoxanthine guanine-phosphoribosyl-transferase
- HPLC
high performance liquid chromatography
- IBD
inflammatory bowel disease
- PBMC
peripheral blood mononuclear cells
- PBS
phosphate buffered saline
- PEI
polyethyleneimine
- PRPP
5-phosporibosyl-1-pyrophosphate
- RBC
red blood cells
- T1/2
elimination half-life time
- Tmax
time to reach the peak 6-TGN concentration
- TPMT
thiopurine S-methyltransferase
- UC
ulcerative colitis
- XO
xanthine oxidase
Conflict of interest
None.
References
- Alexander SPH, Mathie A, Peters JA. Guide to Receptors and Channels (GRAC), 4th edition. Br J Pharmacol. 2009;158(Suppl 1):S1–S254. doi: 10.1111/j.1476-5381.2009.00499.x. [DOI] [PMC free article] [PubMed] [Google Scholar]
- Ansari A, Aslam Z, De SA, Smith M, Gilshenan K, Fairbanks L, et al. Influence of xanthine oxidase on thiopurine metabolism in Crohn's disease. Aliment Pharmacol Ther. 2008;28:749–757. doi: 10.1111/j.1365-2036.2008.03768.x. [DOI] [PubMed] [Google Scholar]
- de Boer NK, Derijks LJ, Keizer-Garritsen JJ, Lambooy LH, Ruitenbeek W, Hooymans PM, et al. Extended thiopurine metabolite assessment during 6-thioguanine therapy for immunomodulation in Crohn's disease. J Clin Pharmacol. 2007a;47:187–191. doi: 10.1177/0091270006294403. [DOI] [PubMed] [Google Scholar]
- de Boer NK, van Bodegraven AA, Jharap B, de Graaf P, Mulder CJ. Drug Insight: pharmacology and toxicity of thiopurine therapy in patients with IBD. Nat Clin Pract Gastroenterol Hepatol. 2007b;4:686–694. doi: 10.1038/ncpgasthep1000. [DOI] [PubMed] [Google Scholar]
- de Boer NK, Wong DR, Jharap B, de Graaf P, Hooymans PM, Mulder CJ, et al. Dose-Dependent Influence of 5-Aminosalicylates on Thiopurine Metabolism. Am J Gastroenterol. 2007c;102:2747–2753. doi: 10.1111/j.1572-0241.2007.01511.x. [DOI] [PubMed] [Google Scholar]
- de Boer NK, Zondervan PE, Gilissen LP, den Hartog G, Westerveld BD, Derijks LJ, et al. Absence of nodular regenerative hyperplasia after low-dose 6-thioguanine maintenance therapy in inflammatory bowel disease patients. Dig Liver Dis. 2008;40:108–113. doi: 10.1016/j.dld.2007.10.013. [DOI] [PubMed] [Google Scholar]
- Bronk JR, Lister N, Shaw MI. Transport and metabolism of 6-thioguanine and 6-mercaptopurine in mouse small intestine. Clin Sci. 1988;74:629–638. doi: 10.1042/cs0740629. [DOI] [PubMed] [Google Scholar]
- Candy S, Wright J, Gerber M, Adams G, Gerig M, Goodman R. A controlled double blind study of azathioprine in the management of Crohn's disease. Gut. 1995;37:674–678. doi: 10.1136/gut.37.5.674. [DOI] [PMC free article] [PubMed] [Google Scholar]
- Deibert P, Dilger K, Fischer C, Hofmann U, Nauck S, Stoelben S, et al. High variation of tioguanine absorption in patients with chronic active Crohn's disease. Aliment Pharmacol Ther. 2003;18:183–189. doi: 10.1046/j.1365-2036.2003.01652.x. [DOI] [PubMed] [Google Scholar]
- Derijks LJ, Gilissen LP, Engels LG, Bos LP, Bus PJ, Lohman JJ, et al. Pharmacokinetics of 6-thioguanine in patients with inflammatory bowel disease. Ther Drug Monit. 2006;28:45–50. doi: 10.1097/01.ftd.0000179839.71138.6d. [DOI] [PubMed] [Google Scholar]
- Dervieux T, Boulieu R. Simultaneous determination of 6-thioguanine and methyl 6-mercaptopurine nucleotides of azathioprine in red blood cells by HPLC. Clin Chem. 1998;44:551–555. [PubMed] [Google Scholar]
- Dewit O, Vanheuverzwyn R, Desager JP, Horsmans Y. Interaction between azathioprine and aminosalicylates: an in vivo study in patients with Crohn's disease. Aliment Pharmacol Ther. 2002;16:79–85. doi: 10.1046/j.1365-2036.2002.01156.x. [DOI] [PubMed] [Google Scholar]
- Erb N, Harms DO, Janka-Schaub G. Pharmacokinetics and metabolism of thiopurines in children with acute lymphoblastic leukemia receiving 6-thioguanine versus 6-mercaptopurine. Cancer Chemother Pharmacol. 1998;42:266–272. doi: 10.1007/s002800050816. [DOI] [PubMed] [Google Scholar]
- George J, Present DH, Pou R, Bodian C, Rubin PH. The long-term outcome of ulcerative colitis treated with 6-mercaptopurine. Am J Gastroenterol. 1996;91:1711–1714. [PubMed] [Google Scholar]
- de Graaf P, de Boer NK, Jharap B, Mulder CJ, Van Bodegraven AA, Veldkamp AI. Stability of thiopurine metabolites: a potential analytical bias. Clin Chem. 2008;54:216–218. doi: 10.1373/clinchem.2007.092676. [DOI] [PubMed] [Google Scholar]
- Guerciolini R, Szumlanski C, Weinshilboum RM. Human liver xanthine oxidase: nature and extent of individual variation. Clin Pharmacol Ther. 1991;50:663–672. doi: 10.1038/clpt.1991.205. [DOI] [PubMed] [Google Scholar]
- Hurwitz A, Sztern MI, Looney GA, Ben-Zvi Z. Loperamide effects on hepatobiliary function, intestinal transit and analgesia in mice. Life Sci. 1994;54:1687–1698. doi: 10.1016/0024-3205(94)00609-1. [DOI] [PubMed] [Google Scholar]
- Jharap B, Seinen ML, de Boer NK, van Ginkel JR, Linskens RK, Kneppelhout JC. Thiopurine therapy in inflammatory bowel disease patients: analyses of two 8-year intercept cohorts. Inflamm Bowel Dis. 2010;16:1541–1549. doi: 10.1002/ibd.21221. [DOI] [PubMed] [Google Scholar]
- Josefine P, Britt-Marie F, Curt P, Henrik H, Marit H, Jukka K, et al. Thioguanine pharmacokinetics in induction therapy of children with acute myeloid leukemia. Anticancer Drugs. 2009;20:7–14. doi: 10.1097/CAD.0b013e32831bc086. [DOI] [PubMed] [Google Scholar]
- Keizer-Garritsen JJ, Brouwer C, Lambooy LH, Ter RP, Bokkerink JP, Trijbels FJ, et al. Measurement of thiopurine S-methyltransferase activity in human blood samples based on high-performance liquid chromatography: reference values in erythrocytes from children. Ann Clin Biochem. 2003;40:86–93. doi: 10.1258/000456303321016222. [DOI] [PubMed] [Google Scholar]
- Lancaster DL, Patel N, Lennard L, Lilleyman JS. 6-Thioguanine in children with acute lymphoblastic leukaemia: influence of food on parent drug pharmacokinetics and 6-thioguanine nucleotide concentrations. Br J Clin Pharmacol. 2001;51:531–539. doi: 10.1046/j.0306-5251.2001.01391.x. [DOI] [PMC free article] [PubMed] [Google Scholar]
- Lennard L, Davies HA, Lilleyman JS. Is 6-thioguanine more appropriate than 6-mercaptopurine for children with acute lymphoblastic leukaemia? Br J Cancer. 1993;68:186–190. doi: 10.1038/bjc.1993.311. [DOI] [PMC free article] [PubMed] [Google Scholar]
- McBride KL, Gilchrist GS, Smithson WA, Weinshilboum RM, Szumlanski CL. Severe 6-thioguanine-induced marrow aplasia in a child with acute lymphoblastic leukemia and inherited thiopurine methyltransferase deficiency. J Pediatr Hematol Oncol. 2000;22:441–445. doi: 10.1097/00043426-200009000-00011. [DOI] [PubMed] [Google Scholar]
- Peters GJ, Veerkamp JH. Stimulation by phytohaemagglutinin of peripheral blood lymphocytes from horse, pig, sheep and man. Vet Immunol Immunopathol. 1982;3:295–300. doi: 10.1016/0165-2427(82)90003-4. [DOI] [PubMed] [Google Scholar]
- Peters GJ, Veerkamp JH. Purine and pyrimidine metabolism in peripheral blood lymphocytes. Int J Biochem. 1983;15:115–123. doi: 10.1016/0020-711x(83)90051-4. [DOI] [PubMed] [Google Scholar]
- Peters GJ, Oosterhof A, Veerkamp JH. Adenosine and deoxyadenosine metabolism in mammalian lymphocytes. Int J Biochem. 1981;13:445–455. doi: 10.1016/0020-711x(81)90117-8. [DOI] [PubMed] [Google Scholar]
- Present DH, Korelitz BI, Wisch N, Glass JL, Sachar DB, Pasternack BS. Treatment of Crohn's disease with 6-mercaptopurine. A long-term, randomized, double-blind study. N Engl J Med. 1980;302:981–987. doi: 10.1056/NEJM198005013021801. [DOI] [PubMed] [Google Scholar]
- Relling MV, Lin JS, Ayers GD, Evans WE. Racial and gender differences in N-acetyltransferase, xanthine oxidase, and CYP1A2 activities. Clin Pharmacol Ther. 1992;52:643–658. doi: 10.1038/clpt.1992.203. [DOI] [PubMed] [Google Scholar]
- Sandborn W, Sutherland L, Pearson D, May G, Modigliani R, Prantera C. Azathioprine or 6-mercaptopurine for inducing remission of Crohn's disease. Cochrane Database Syst Rev. 2000;(4):CD000545. doi: 10.1002/14651858.CD000545. [DOI] [PubMed] [Google Scholar]
- Shipkova M, Armstrong VW, Wieland E, Oellerich M. Differences in nucleotide hydrolysis contribute to the differences between erythrocyte 6-thioguanine nucleotide concentrations determined by two widely used methods. Clin Chem. 2003;49:260–268. doi: 10.1373/49.2.260. [DOI] [PubMed] [Google Scholar]
- Sparrow MP, Hande SA, Friedman S, Lim WC, Reddy SI, Cao D, et al. Allopurinol safely and effectively optimizes tioguanine metabolites in inflammatory bowel disease patients not responding to azathioprine and mercaptopurine. Aliment Pharmacol Ther. 2005;22:441–446. doi: 10.1111/j.1365-2036.2005.02583.x. [DOI] [PubMed] [Google Scholar]
- Szumlanski CL, Weinshilboum RM. Sulphasalazine inhibition of thiopurine methyltransferase: possible mechanism for interaction with 6-mercaptopurine and azathioprine. Br J Clin Pharmacol. 1995;39:456–459. doi: 10.1111/j.1365-2125.1995.tb04478.x. [DOI] [PMC free article] [PubMed] [Google Scholar]
- Timmer A, McDonald JW, Macdonald JK. Azathioprine and 6-mercaptopurine for maintenance of remission in ulcerative colitis. Cochrane Database Syst Rev. 2007;(1):CD000478. doi: 10.1002/14651858.CD000478.pub2. [DOI] [PubMed] [Google Scholar]
- Xin H, Fischer C, Schwab M, Klotz U. Effects of aminosalicylates on thiopurine S-methyltransferase activity: an ex vivo study in patients with inflammatory bowel disease. Aliment Pharmacol Ther. 2005;21:1105–1109. doi: 10.1111/j.1365-2036.2005.02460.x. [DOI] [PubMed] [Google Scholar]
- Yamaguchi Y, Matsumura T, Ichida K, Okamoto K, Nishino T. Human xanthine oxidase changes its substrate specificity to aldehyde oxidase type upon mutation of amino acid residues in the active site: roles of active site residues in binding and activation of purine substrate. J Biochem. 2007;141:513–524. doi: 10.1093/jb/mvm053. [DOI] [PubMed] [Google Scholar]
- Yates CR, Krynetski EY, Loennechen T, Fessing MY, Tai HL, Pui CH, et al. Molecular diagnosis of thiopurine S-methyltransferase deficiency: genetic basis for azathioprine and mercaptopurine intolerance. Ann Intern Med. 1997;126:608–614. doi: 10.7326/0003-4819-126-8-199704150-00003. [DOI] [PubMed] [Google Scholar]