

Abstract
Clinicians are often uncertain about how to manage elevated blood pressure (BP) when a patient reports that he/she has recently missed several doses of antihypertensive medications. While we know that better adherence can improve BP during several months, the magnitude of this relationship in the short term is poorly understood. The authors examined this issue using a group of patients who monitored adherence using a Medication Events Monitoring System (MEMS) cap and had BP measurements in the course of routine clinical practice. BP readings were compared following 7 days of excellent adherence (100%) or poor adherence (<60%), omitting BP values following intermediate adherence. Using several different methods, BP following 7 days of excellent adherence was between 12/7 mm Hg and 15/8 mm Hg lower than after 7 days of poor adherence. Clinicians can use this effect size to calibrate their impressions of what the BP might have been with improved adherence. J Clin Hypertens (Greenwich). 2011;13:416–421. ©2011 Wiley Periodicals, Inc.
Treatment adherence is an important determinant of blood pressure (BP) control. 1 , 2 In usual clinical practice, treatment adherence can vary over time. While many studies have categorized patients as “adherent” and “nonadherent,” 2 , 3 , 4 , 5 most patients have periods of better and worse adherence that do not fit into such dichotomized categories. 6 , 7 , 8 , 9 , 10 Clinicians are commonly informed by a patient that his or her adherence has been less than perfect during the past week because the patient ran out of medication, forgot, or was confused, or for other reasons. It is unclear how clinicians should interpret BP values obtained after the patient has reported a period of relatively poor adherence because there are few available estimates of the expected impact on BP. It would therefore be useful to estimate the impact of poor adherence on BP during a short period.
There are at least 3 kinds of previous studies that might shed some light on the impact of a brief period of poor adherence on BP, but each has shortcomings. Most medications, particularly at the time they are being considered for approval, are evaluated compared with placebo. This provides some information about the effect of a single medication under controlled circumstances. However, the applicability to clinical practice is limited because real‐life regimens usually contain more than 1 drug, and real‐life nonadherence is usually partial rather than complete. 6 , 7 , 8 , 9 , 10 There are a few studies in which patients are instructed to stop their antihypertensive medications abruptly in order to compare the rebound effects of different medication classes during 7 days. 11 While such a study can provide valuable physiologic data, it also simplifies regimens down to only 1 drug and does not mirror real‐world patterns of nonadherence. Finally, there are large retrospective database studies in which adherence is usually characterized using pharmacy fill data 3 , 4 , 5 or patient self‐report. 1 , 2 , 12 Such studies have often shown that so‐called nonadherent patients have worse BP control than adherent patients. Shortcomings of such designs include the unspecified time relationship between adherence behavior and BP measurements, as well as the oversimplification inherent in dividing patients using a binary adherence measure (adherent vs nonadherent). 10 , 13
Recently, we have had another tool for measuring adherence: the Medication Event Monitoring System [MEMS] caps (Aardex Group, Ltd, Sion, Switzerland). A MEMS cap records each bottle opening, allowing clinicians and researchers access to extremely detailed data regarding persistence with therapy and timeliness of dosing. 6 , 7 , 8 , 9 , 10 , 14 , 15 , 16 , 17 The availability of detailed adherence data from MEMS caps provides an opportunity to better characterize the effect on BP of a brief period of poor adherence in a real‐world setting. We therefore examined data from a study on hypertension in which patients used MEMS caps to monitor adherence. We sought to characterize the precise relationship between a 7‐day period of poor adherence to antihypertensive therapy and the resultant change in BP.
Methods
Data
The data for our analyses were obtained from the pre‐intervention period of a randomized trial that examined the effects of a provider‐patient communication skill‐building intervention on adherence to antihypertensive medication therapy and BP control (clinicaltrials.gov identifier: NCT00201149). Patients were enrolled from 7 outpatient primary care clinics at Boston Medical Center, an inner‐city safety‐net hospital affiliated with the Boston University School of Medicine. The study was approved by the institutional review board of Boston University Medical Center.
Patients were recruited from August 2004 through June 2006 if they were of white or black race, aged at least 21 years, and had an outpatient diagnosis of hypertension on at least 3 separate occasions prior to enrollment. Based on initial screening, patients were ineligible for the study if they already used a medication dispenser (as this might invalidate adherence data collection), were cognitively impaired, were of an ethnicity/race other than white or black, were unable to speak English, were not prescribed antihypertensive medication, were already participating in another hypertension study, or refused to participate.
Among 869 patients enrolled in the study who received dispensers with MEMS caps to monitor adherence to antihypertensive medication, 689 returned them. Our current study focuses on medication‐taking behavior during the 90 days after the first opening of the MEMS cap. Rather than giving a patient multiple MEMS caps for all agents in their hypertension regimen, we gave one MEMS cap to each patient to correspond with one of their antihypertensive medications, asking them to use the MEMS cap for the most frequently taken medication. We characterized the medication‐taking behavior of each patient using only this one medication, the “index medication.” A similar strategy has been pursued in prior studies using MEMS caps to characterize adherence to a multidrug regimen, which have found that adherence to an index medication generally correlates with adherence to the entire regimen. 10 , 16 , 17
We imposed additional restrictions to increase the homogeneity of the analytic sample. During the first 90 days after issuance of the MEMS cap, a patient needed at least 2 clinic visits with BP readings to be part of our final sample. Ensuring multiple BP readings per patient reduced the potential for confounding effects of adherence and characteristics specific to a patient. This reduced the sample to 249 patients. We then excluded 35 patients taking regimens of ≥2 doses per day, one patient whose index medication changed during the first 90 days, and 3 others whose dose frequency for the index medication changed from twice to once daily during the first 90 days. This resulted in 210 patients who were taking regimens of 1 dose per day for the first 90 days of the study. Furthermore, if a patient opened his/her MEMS cap more than twice per day during ≥10% of the monitored period, then the patient was excluded because of suspicion that the patient did not understand the MEMS cap and was not using it correctly. This resulted in a final study sample of 200 patients.
Independent Variable: Adherence to Therapy
We characterized adherence to antihypertensive therapy using MEMS caps. These devices use a microchip to record all bottle openings. Good adherence as measured by MEMS caps has been linked to improvements in numerous clinical outcomes, 7 , 8 , 14 , 15 including hypertension control. 16 , 17 In the current study, clinicians were not given feedback about their patients’ adherence as measured by MEMS caps.
The MEMS cap data for this sample were cleaned in the following manner. For nonmonitored periods (eg, hospitalizations), the number of MEMS cap openings were treated as missing. A patient was considered adherent on days in which the MEMS cap was recorded to have been opened exactly once or twice and was considered nonadherent if the MEMS cap was not opened. On days where the MEMS cap was opened more than twice, the number of openings was considered missing data due to the extra uncertainty in the reason for the multiple openings.
Dependent Variable: Clinical BP Measurements
BP was taken for each patient at irregular intervals, as part of routine clinical care. BPs could be taken using manual or electronic devices by clinical staff including physicians, nurses, and medical assistants and were recorded in the electronic medical record. If multiple readings were taken on a single day, the values were averaged for our study. We separately examined systolic BP (SBP) and diastolic BP (DBP) as outcomes.
Control Variables
We recorded sex, self‐reported race (white vs black), and age at study inception. Using both International Classification of Diseases, Ninth Revision codes and problem lists from the electronic medical record, we noted whether the patients had the following comorbid conditions, all of which could impact BP, the use of antihypertensive medications, or the perceived urgency of controlling hypertension: cerebrovascular disease, congestive heart failure, chronic kidney disease, coronary artery disease, diabetes mellitus, hyperlipidemia, obesity (body mass index >30 kg/m2), and peripheral vascular disease.
Patient Adherence Example
An example of the relationship between MEMS cap openings and BP measurements can be seen for one of the patients in our study (Figure). The horizontal axis counts the number of days since the patient entered the study, and the vertical axis counts the number of MEMS cap openings on each day displayed as black dots. For this patient, 3 clinic visits occurred in which BP readings were taken, with the days represented by the vertical lines and the SBP and DBP indicated by diamonds on the lines. The 7 days preceding the BP visits are shaded. In the 7‐day period preceding the first visit, the patient had excellent adherence (1 pill per day), and the BP reading was 110/70 mm Hg. For the subsequent two visits, the adherence was at 0% for the 7‐day period preceding the BP readings, and the corresponding BP measurements were 130/84 mm Hg on the first visit and 145/92 mm/Hg on the second visit. This example provides an informal basis for the statistical analyses we apply to these data.
Figure FIGURE.
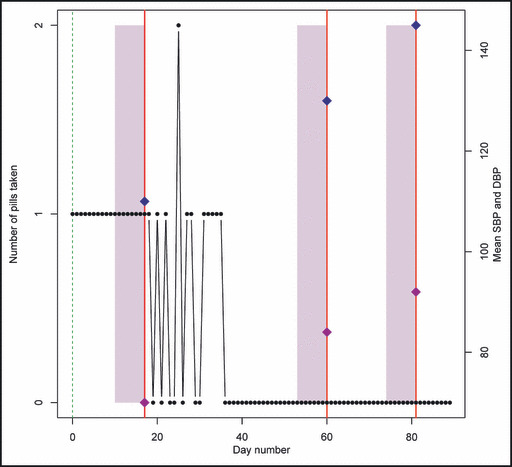
Example patient profile. The number of pills taken on each day of the study for a selected patient. The 3 vertical lines indicate clinic visit days on which blood pressure readings were taken, and the diamonds on each line denote the systolic blood pressure (SBP) and diastolic blood pressure (DBP) at the visit (labeled on the right). The shaded rectangular areas mark off 7 days prior to each clinic visit.
Statistical Analysis
Two distinct approaches were taken to assess the effects of adherence on BP. The first approach treated each BP reading as a separate outcome and used adherence during the preceding 7 days to predict BP. For these analyses, we used the full analytic sample of 200 patients. The second approach restricted the sample to patients who had ≥2 BP readings, one of which was preceded by excellent adherence and one of which was preceded by poor adherence. With the first approach, we analyzed a larger sample and adjusted for between‐patient differences through the control and health factors. In the second approach, every patient served as his/her own control and it was not necessary to control for patient‐specific covariates. In both cases, recent adherence prior to a BP reading was determined based on the percentage of days in which the patient opened the MEMS cap. Days in which MEMS cap openings were missing were not counted in the adherence calculation. Adherence was considered poor if adherence was <60% and excellent if adherence was 100%. BP readings preceded by a 7‐day period with intermediate adherence (between 60% and 100%) were removed from this analysis to provide a more precise estimate of the two ends of the scale, which resulted in a sample size decrease to 178. All models were separately fit to predict SBP and DBP.
In our first analytic approach, adherence was computed for the 7 days prior to each BP reading. BP readings were excluded if they occurred within the first 7 days of a patient’s entry to the study. Random effects least‐squares regressions were fit to the resulting data. BP (SBP and DBP) were regressed on an excellent/poor adherence indicator, along with sex, race, age (in years, categorized into 0–59, 60–69, 70–79, and 80+), and comorbid conditions, with a normally distributed mean‐zero random effect per unique patient. In this way, we compared BPs following periods of excellent vs poor adherence while controlling for measured patient characteristics and patient identity as a random effect.
Our second approach focused exclusively on 14 patients who had at least one period each of poor and excellent adherence within the 90‐day study window. The analyses consisted of random effects least‐squares regressions in which SBP and DBP were regressed on binary indicators of excellent vs poor adherence 7 days prior to the reading, with normally distributed mean‐zero patient‐specific random effects. The random effects models were fit using the “lme” function in the statistics software package R (R Foundation for Statistical Computing, Vienna, Austria).
Results
As shown in Table I, the full cohort of 869 patients were 35% male, 43% white, and aged between 25 to 86 years with a mean age of 59.4 years (standard deviation=11.4 years). We recorded the first BP reading taken after enrollment. For 781 of the full cohort of 869 patients, this corresponded to BP taken on the day of enrollment. The average initial post‐enrollment SBP and DBP were 133.6 mm Hg and 80.4 mm Hg, respectively, and 45% of the cohort had an initial BP >140/90 mm Hg. The most commonly used medication classes were angiotensin‐converting enzyme inhibitors/angiotensin receptor blockers and diuretics. The average patient received 2.3 medications at baseline. For analysis 1, we studied only BP readings preceded by a 7‐day period of poor (<60%) or excellent (100%) adherence, eliminating BP values preceded by a period of intermediate adherence. The sample for analysis 1 consisted of 178 patients. The characteristics of this sample were similar to the full cohort, except that the analysis 1 sample contained a significantly (P<.05) smaller fraction of men (29% compared with 35%), had a significantly higher proportion with diabetes (40% compared with 33%), and had a significantly higher proportion with coronary artery disease (19% compared with 13%). The average DBP was significantly lower for the analysis 1 sample compared with the full cohort (78.7 compared with 80.4).
Table I.
Sample Characteristics
| Full Sample (N=869) | Analysis 1 (N=178) | Analysis 2 (N=14) | |
|---|---|---|---|
| Men, % | 35 | 29a | 36 |
| White, % | 43 | 40 | 43 |
| Hyperlipidemia, % | 53 | 56 | 43 |
| Diabetes, % | 33 | 40a | 50 |
| Peripheral vascular disease, % | 5 | 7 | 21 |
| Renal insufficiency, % | 6 | 6 | 7 |
| Coronary artery disease, % | 13 | 19a | 36 |
| Congestive heart failure, % | 3 | 6 | 14 |
| Cerebrovascular disease, % | 5 | 4 | 7 |
| Obese, % | 60 | 60 | 57 |
| Age, mean (SD), y | 59.4 (11.4) | 60.6 (10.7) | 61.9 (12.3) |
| First BP reading | |||
| SBP, mean (SD) | 133.6 (17.4) | 131.8 (17.5) | 141.0 (18.4) |
| DBP, mean (SD) | 80.4 (11.4) | 78.7 (11.7)a | 85.9a (12.2) |
| BP <140/90 mm Hg, % | 55 | 58 | 36 |
| Medications at baseline | |||
| ACE inhibitor/ARB, % | 66 | 65 | 57 |
| β‐Blocker, % | 45 | 46 | 71 |
| Calcium channel blocker, % | 36 | 42 | 50 |
| Diuretic, % | 65 | 68 | 79 |
| Other medication, % | 12 | 8 | 14 |
| Total number of medications, mean (SD) | 2.3 (1.0) | 2.4 (1.1) | 2.8 (1.3) |
Abbreviations: ACE, angiotensin‐converting enzyme; ARB, angiotensin receptor blocker; BP, blood pressure; DBP, diastolic blood pressure; SBP, systolic blood pressure; SD, standard deviation. a P<.05. Significant differences at the .05 level were found between the 178 patients in analysis 1 and the 691 (869−178) distinct patients in the full sample for sex, presence of diabetes, presence of coronary artery disease, and first DBP measurement. A significant difference at the .05 level was found between the 14 patients in analysis 2 and the 164 (distinct) patients in analysis 1 for only first DBP measurement.
Analysis 1 included a total of 357 BP readings for 178 unique patients. For 7‐day periods with poor adherence, the average adherence rate was 34%, with a standard deviation of 22%. Table II summarizes the main results for analysis 1. Controlling for demographics and comorbid conditions, BP readings following periods of excellent adherence were lower than those following periods of poor adherence (SBP −11.6 mm Hg, DBP −7.7 mm Hg; P<.001 for both).
Table II.
Models for Effect of Excellent vs Poor Adherence Based on 178 Patients
| Systolic Blood Pressure | Diastolic Blood Pressure | |
|---|---|---|
| Intercept | 137.55 (3.70) | 89.98 (2.13) |
| Excellent adherence | −11.60 (2.79)a | −7.67 (1.61)a |
| Men | 2.36 (2.61) | 1.85 (1.51) |
| White | −2.69 (2.39) | −1.99 (1.38) |
| Age <60 y | Reference | Reference |
| Age 60–69 y | 2.96 (2.66) | −3.44 (1.53)b |
| Age 70–79 y | 6.37 (3.32) | −4.98 (1.92)b |
| Age 80+ y | 13.47 (6.76)b | −10.15 (3.91)b |
| Hyperlipidemia | 1.42 (2.37) | −2.39 (1.37) |
| Diabetes | −2.69 (2.61) | −4.15 (1.51)b |
| Peripheral vascular disease | −6.67 (4.70) | −4.20 (2.72) |
| Renal insufficiency | 0.24 (5.12) | 1.20 (2.96) |
| Coronary artery disease | 1.06 (3.26) | −2.01 (1.88) |
| Congestive heart failure | 2.76 (5.19) | 2.24 (3.00) |
| Cerebrovascular disease | 13.77 (5.85)b | 0.30 (3.38) |
| Obese | 2.35 (2.47) | 1.57 (1.43) |
Values are expressed as coefficient estimates (standard errors). a P<.001. b P<.05.
In analysis 2, 14 patients had at least 1 BP value preceded by a period of poor adherence (<60%) and at least 1 BP value preceded by a period of excellent adherence (100%). These 14 patients contributed a total of 36 observations. During the 90‐day study window, 8 of the patients had excellent adherence always followed by poor adherence, 5 had poor adherence always followed by excellent adherence, and 1 patient had both poor and excellent adherence following each other. For 7‐day periods with poor adherence, the average adherence rate was 33%, with a standard deviation of 24%, nearly identical to the results based on the larger sample in analysis 1. The analysis 2 group appeared to have a higher burden of comorbidity than the analysis 1 group and higher initial BP values. However, except for a higher initial DBP in the analysis 2 group, these differences were not statistically significant. Accounting for patient random effects, mean BP following excellent adherence was 130.6/78.1 mm Hg, compared with 145.5/85.2 mm Hg following poor adherence, a difference of 14.9/7.1 mm Hg (P<.05 both for SBP and DBP).
In both analyses, we examined alternative window periods prior to BP readings (vs the base case definition of 7 days), and different definitions of excellent and poor adherence (vs the base case definitions of 100% and <60%). In general, the results were similar. Extending the window length excluded a larger number of patients in the excellent and poor adherence groups, and decreasing the window length resulted in somewhat less powerful effects of adherence on BP. Increasing the percent threshold for poor adherence (eg, to 80%) attenuated the effect of poor adherence on BP.
Discussion
In this study, we estimated the effect size of adherence on BP control. By focusing on 7‐day periods characterized by excellent (100%) or poor (<60%) adherence, we were able to show that the difference between these two is approximately 12/8 mm Hg or 15/7 mm Hg, in our first and second analyses, respectively. Our second analysis, although limited to only 14 patients, allowed each patient to serve as his or her own control. The effect size we found is robust to the method of analysis. It was similar whether we included a large number of patients and controlled for several potential confounding factors or whether we included only patients for whom both poor and excellent adherence periods were observed. These results, therefore, provide a methodologically robust estimate regarding the extent of the impact of poor adherence on BP control during a 7‐day period.
Our findings have utility for clinicians who treat hypertension. Patients often arrive at a visit not having taken their medication for 1 or more days, and may communicate this fact to the clinician. We have previously shown that an impression that a patient is nonadherent is often associated with a decision not to intensify the antihypertensive regimen. 18 This relatively common occurrence (ie, admission of suboptimal adherence leading to a decision not to intensify) is likely a major contributor to clinical inertia, which, in turn, is a major barrier to improved BP control. 18 , 19 , 20 , 21 In another study, we have shown that, contrary to what many clinicians might expect, therapy intensification improves BP to a similar extent in patients with suboptimal adherence compared with those with optimal adherence. 22 We have therefore suggested that clinicians not dismiss the idea of intensifying therapy in a patient who is known or suspected to have suboptimal adherence. 22
The present study adds to this line of reasoning by providing an estimate of the extent of BP elevation that can be expected after a 7‐day period of poor adherence in a real‐life setting. While our previous study suggested that intensification can be considered in patients with suboptimal adherence, 22 the current study suggests that intensification may be indicated when the SBP is elevated by >15 mm Hg or the DBP by >8 mm Hg. Blaming this extent of BP elevation on nonadherence may not make sense in light of the present study.
Previous efforts to estimate the effect size of nonadherence on BP have been limited by assessing both adherence and BP control in less‐than‐optimal ways (binary measures of control, binary measures of adherence, unclear timing between the two). In a seminal study, Morisky and colleagues 2 developed a 4‐item scale to measure self‐reported nonadherence and then demonstrated the criterion validity of that measure. In that study, 75% of patients deemed adherent by the scale had controlled BP at 5‐year follow‐up, compared with 47% of patients deemed nonadherent by the scale. In another well‐known study, the authors used automated pharmacy fills data to assess adherence and again found that nonadherence during a 30‐day period was a risk factor for uncontrolled BP. 3 In contrast, our study quantifies the effect size of adherence in terms of mm Hg rather than limited to a binary outcome of controlled/uncontrolled, and does so during a 7‐day period. Previous studies have shown that it may not be sufficient to characterize patients as adherent or nonadherent, because patients may have periods of excellent adherence interspersed with “drug holidays,” or periods during which the medication is intentionally omitted for several days. 10 , 23 , 24 , 25 Because long‐term adherence is not a binary concept, it is important to understand the impact of short‐term adherence on the outcome of interest rather than simply labeling some patients as nonadherent and then demonstrating that they have inferior BP control.
Limitations
While the results of our study are compelling, we do acknowledge some important limitations. First, and most importantly, we cannot establish causal effects of nonadherence from our observational data. While we controlled for important determinants of BP in our analyses, unobserved confounders could have played a role in our results. Second, we used a carefully selected subset of patients who recorded periods of excellent or poor adherence, and for the second analysis, patients who recorded at least one of each. Not only did this sample selection necessarily limit our sample size, but it arguably could impact generalizability, although the group comparisons in Table I did not reveal large differences in the variables we measured. Still, by limiting our study to patients who had multiple BP measurements in 90 days, we may have selected for a sicker group of patients, specifically those who were more likely to have comorbidities such as diabetes and coronary heart disease. In addition, the second analysis was restricted to patients who had periods of both excellent and poor adherence, so that by design this particular sample had more erratic behavior than the general hypertensive population. However, because the estimated effect sizes from the two analyses were consistent, this concern may not be a serious one. Further, the consistent results between the two analyses greatly enhances validity because using each patient as his or her own control is arguably the gold standard for controlling for confounding due to patient‐specific factors. A third limitation is that we tracked adherence using the index medication, ie, the medication whose bottle had a MEMS cap. However, most of these patients were taking other medications as well, which were not monitored by MEMS caps. This is a usual practice in adherence research, 10 , 17 and previous studies have shown that adherence to an index medication matches well with adherence to other medications in the regimen. Furthermore, there is no accepted method available for harmonizing the results of multiple simultaneous MEMS caps. Fourth, this study relied on actual BP measurements from clinical practice, rather than obtaining BP measurements through a standardized research protocol. While this feature of the study may enhance generalizability to real‐world settings, it may also compromise the reliability of our BP data. Finally, our study enrolled patients from a single medical center, an inner‐city safety‐net hospital with a high proportion of minority and immigrant patients. This also may impact generalizability.
Conclusions
This study provides a fairly precise estimate of the effect of adherence on BP control in the short term: 7 days of poor adherence (<60%) increases BP by approximately 12 mm Hg to 15/7–8 mm Hg compared with 7 days of excellent adherence. Patients who admit to substantial nonadherence may nevertheless benefit from intensification of the antihypertensive regimen if their BP is elevated by more than this amount.
Acknowledgments
Acknowledgments and disclosures: Drs Rose and Glickman contributed equally to this manuscript. This research was supported by a grant from the National Institutes of Health (HL072814, NR Kressin, PI). Dr Rose is supported by a career development award from the Department of Veterans Affairs, Health Services Research and Development Service. Dr Kressin is supported in part by a Research Career Scientist award from the Department of Veterans Affairs, Health Services Research & Development Service (RCS 02‐066‐1). The views expressed in this article are those of the authors and do not necessarily represent the views of the Department of Veterans Affairs. The authors have no conflicts of interest to disclose.
References
- 1. Choo PW, Rand CS, Inui TS, et al. Validation of patient reports, automated pharmacy records, and pill counts with electronic monitoring of adherence to antihypertensive therapy. Med Care. 1999;37:846–857. [DOI] [PubMed] [Google Scholar]
- 2. Morisky DE, Green LW, Levine DM. Concurrent and predictive validity of a self‐reported measure of medication adherence. Med Care. 1986;24:67–74. [DOI] [PubMed] [Google Scholar]
- 3. Fung V, Huang J, Brand R, et al. Hypertension treatment in a Medicare population: adherence and systolic blood pressure control. Clin Ther. 2007;29:972–984. [DOI] [PubMed] [Google Scholar]
- 4. Heisler M, Hogan MM, Hofer TP, et al. When more is not better: treatment intensification among hypertensive patients with poor medication adherence. Circulation. 2008;117:2884–2892. [DOI] [PubMed] [Google Scholar]
- 5. Ho PM, Magid DJ, Shetterly SM, et al. Importance of therapy intensification and medication nonadherence for blood pressure control in patients with coronary disease. Arch Intern Med. 2008;168:271–276. [DOI] [PubMed] [Google Scholar]
- 6. Vrijens B, Goetghebeur E. Electronic monitoring of variation in drug intakes can reduce bias and improve precision in pharmacokinetic/pharmacodynamic population studies. Stat Med. 2004;23:531–544. [DOI] [PubMed] [Google Scholar]
- 7. Vrijens B, Goetghebeur E, de Klerk E, et al. Modelling the association between adherence and viral load in HIV‐infected patients. Stat Med. 2005;24:2719–2731. [DOI] [PubMed] [Google Scholar]
- 8. Vrijens B, Tousset E, Rode R, et al. Successful projection of the time course of drug concentration in plasma during a 1‐year period from electronically compiled dosing‐time data used as input to individually parameterized pharmacokinetic models. J Clin Pharmacol. 2005;45:461–467. [DOI] [PubMed] [Google Scholar]
- 9. Vrijens B, Urquhart J. Patient adherence to prescribed antimicrobial drug dosing regimens. J Antimicrob Chemother. 2005;55:616–627. [DOI] [PubMed] [Google Scholar]
- 10. Vrijens B, Vincze G, Kristanto P, et al. Adherence to prescribed antihypertensive drug treatments: longitudinal study of electronically compiled dosing histories. BMJ. 2008;336:1114–1117. [DOI] [PMC free article] [PubMed] [Google Scholar]
- 11. Girvin BG, Johnston GD. Comparison of the effects of a 7‐day period of non‐compliance on blood pressure control using three different antihypertensive agents. J Hypertens. 2004;22:1409–1414. [DOI] [PubMed] [Google Scholar]
- 12. Kressin NR, Wang F, Long J, et al. Hypertensive patients’ race, health beliefs, process of care, and medication adherence. J Gen Intern Med. 2007;22:768–774. [DOI] [PMC free article] [PubMed] [Google Scholar]
- 13. Osterberg L, Blaschke T. Adherence to medication. N Engl J Med. 2005;353:487–497. [DOI] [PubMed] [Google Scholar]
- 14. Dobbels F, De Geest S, van Cleemput J, et al. Effect of late medication non‐compliance on outcome after heart transplantation: a 5‐year follow‐up. J Heart Lung Transplant. 2004;23:1245–1251. [DOI] [PubMed] [Google Scholar]
- 15. Kimmel SE, Chen Z, Price M, et al. The influence of patient adherence on anticoagulation control with warfarin: results from the International Normalized Ratio Adherence and Genetics (IN‐RANGE) Study. Arch Intern Med. 2007;167:229–235. [DOI] [PubMed] [Google Scholar]
- 16. Lee JY, Kusek JW, Greene PG, et al. Assessing medication adherence by pill count and electronic monitoring in the African American Study of Kidney Disease and Hypertension (AASK) Pilot Study. Am J Hypertens. 1996;9:719–725. [DOI] [PubMed] [Google Scholar]
- 17. Qureshi NN, Hatcher J, Chaturvedi N, et al. Effect of general practitioner education on adherence to antihypertensive drugs: cluster randomised controlled trial. BMJ. 2007;335:1030. [DOI] [PMC free article] [PubMed] [Google Scholar]
- 18. Rose AJ, Shimada SL, Rothendler JA, et al. The accuracy of clinician perceptions of “usual” blood pressure control. J Gen Intern Med. 2008;23:180–183. [DOI] [PMC free article] [PubMed] [Google Scholar]
- 19. Berlowitz DR, Ash AS, Hickey EC, et al. Inadequate management of blood pressure in a hypertensive population. N Engl J Med. 1998;339:1957–1963. [DOI] [PubMed] [Google Scholar]
- 20. Phillips LS, Branch WT, Cook CB, et al. Clinical inertia. Ann Int Med. 2001;135:825–834. [DOI] [PubMed] [Google Scholar]
- 21. Roumie CL, Elasy TA, Wallston KA, et al. Clinical inertia: a common barrier to changing provider prescribing behavior. Jt Comm J Qual Patient Saf. 2007;33:277–285. [DOI] [PubMed] [Google Scholar]
- 22. Rose AJ, Berlowitz DR, Manze M, et al. Intensifying therapy for hypertension despite suboptimal adherence. Hypertension. 2009;54:524–529. [DOI] [PMC free article] [PubMed] [Google Scholar]
- 23. Urquhart J. Pharmacodynamics of variable patient compliance: implications for pharmaceutical value. Adv Drug Deliv Rev. 1998;33:207–219. [DOI] [PubMed] [Google Scholar]
- 24. Urquhart J, Vrijens B. ‘Hedged’ prescribing for partially compliant patients. Clin Pharmacokinet. 2006;45:105–108. [DOI] [PubMed] [Google Scholar]
- 25. Vrijens B, Goetghebeur E. Comparing compliance patterns between randomized treatments. Control Clin Trials. 1997;18:187–203. [DOI] [PubMed] [Google Scholar]