Abstract
Keeping track of the aggregation kinetics of amyloid fibrils is essential for understanding their formation mechanism and eventually developing treatments for misfolded protein-related diseases. A simulation study of a series of Aβ9–40 amyloid fibrils with different size, shows that novel two dimensional near-ultraviolet (2DNUV) spectra contain characteristic signatures of interactions between peptides. Chiral 2DNUV signals show a larger degree of exciton delocalization compared to their non-chiral counterparts. Intensities of specific peaks provide a direct measure of the number of peptides in a fibril. These signals could be used to monitor the fibril growth kinetics, one peptide at a time.
I. INTRODUCTION
Much attention has been directed to the formation and aggregation mechanisms of amyloid fibrils in misfolded proteins [1–5]. These studies are motivated by the pursuit for effective cures to more than 20 neurodegenerative diseases [6–8]. Water-soluble oligomeric forms of β-amyloid (Aβ) are believed to be the principal causes of the neurotoxicity in Alzheimer’s disease. The step by step tracking of amyloid formation is thus most valuable. Important open issues are how does the oligomer structure depend on aggregate size, how it affects amyloid formation, and how to characterize their physical and chemical properties. Recent progress made by identifying the oligomeric forms of Aβ, such as the monomer [9], and dimer [10, 11] could facilitate future studies of the aggregation mechanism.
Experimental tools for monitoring the oligomer size are required for tracking the amyloid formation[12–14]. X-ray diffraction is not adequate since the fibrils do not form crystals. Optical spectroscopic techniques are good candidates. Conventional one-dimensional (1D) spectroscopy techniques such as circular dichroism (CD) and Raman have a limited resolution. Coherent multidimensional non-linear optical spectra in contrast can reveal more detailed information about the fibril structure and kinetics of misfolded peptides [15–20]. Two dimensional IR spectroscopy (2DIR) with site-specific isotope labeling has been successfully utilized to track the amyloid formation pathway with residue-specific resolution [21, 22]. Our theoretical work had demonstrated that 2DIR signals allow a direct characterization of fibril aggregation pathways [23].
Recent advances in laser technology had made it possible to extend the multidimensional techniques into the near-ultraviolet (NUV) regime [24–29]. Two dimensional near-ultraviolet (2DNUV) spectroscopy of proteins carries information on electronic excitations of aromatic side chains: phenylalanine (Phe), tyrosine (Tyr), and tryptophan (Trp). Since aromatic residues in proteins are relatively rare, their spectra are site-specific and easier to characterize without isotope labeling. Electronic excitations of chromophores depend on their surroundings through electrostatic interactions, making them good local probes for the structure. By exploiting the high sensitivity of 2DNUV signals to interactions among protein residues and between peptides, the technique offers a powerful high resolution local window for observing the size of amyloid fibrils [20, 30, 31].
In this paper, we employ our recently developed Quantum Mechanics/Molecular Mechanics (QM/MM) approach[31] towards the simulation of 2DNUV spectra of a family of fibrils made of 32-residue β-amyloid (Aβ9–40) peptide. It has been shown that this segment is the key for fibril formation. We find that these spectra are sensitive to the interactions between neighboring peptides. We further show that 2DNUV may be used to monitor the number of peptides in an aggregated fibril, and can thus probe the amyloid fibril formation kinetics.
II. SIMULATION DETAILS
In the case of Alzheimer’s disease, fibrils are composed of β-amyloid (Aβ) peptides with 39 to 42 residues, which are rich in β-sheet secondary structure. Tycko and co-workers [32] have proposed a molecular model for the conformation of Aβ1–40. Since it is known that residues 1–8 are structurally disordered and not essential for the fibril growth [33], we used the Aβ9–40 fragment to model a single amyloid peptide. This contains three aromatic side chains: Tyr10, Phe19, Phe20. MM simulations were carried out on the STAG(+2) structure composed of twelve Aβ9–40 monomers, using the software package NAMD 2.7 [34] with the CHARMM27 [35] force field and the TIP3P water model [36] as reported previously[31]. We have harvested the central Aβ9–40 peptide of the upper stack from the MM ensembles. This peptide was repeated to build a series of of Fn fibrils with n periodically arrayed peptides, as shown in Fig.??. Ensembles of MM geometric snapshots of these amyloid fibril were recorded for the UV studies.
We focused on the 1La (~209 nm for Phe, ~216 nm for Tyr) and 1Lb (~263 nm for Phe, ~274 nm for Tyr) electronic transitions. The transition energies, and electric and magnetic dipole moments of isolated aromatic chromophores were calculated at the QM CASSCF/SCRF level (the complete-active space self-consistent-field method implemented within a self-consistent reaction field in MOLCAS [37]). We have applied the exciton Hamiltonian with electrostatic uctuations (EHEF) algorithm[31] to calculate the electrostatic potential, and inter- and intra- molecular interactions. EHEF provides an interface for reading MM simulation trajectories from standard MD packages and generating QM atom-atom charge distributions. For a given conformation, charge distributions were deduced from standard atom-atom charges by updating atom-atom vectors of the corresponding MM geometric structure. These charge distributions were then used to calculate the electrostatic interactions between the chromophore and the explicit molecular environment. The fluctuating Hamiltonian was obtained at the QM level for all MD snapshots by avoiding expensive repeated QM calculations [38]. Based on the Frenkel exciton model, the matrix method in the DichroCalc code [39, 40] uses the EHEF parameters to construct the effective exciton Hamiltonian with electrostatic fluctuations. UV spectra are finally simulated using the SPECTRON code [41], by averaging over 1000 MM snapshots for 1D (linear absorption (LA) and CD), and 500 snapshots for 2D spectra.
2DNUV photon echo signals are generated by subjecting the system to four impulsive Gaussian laser pulses with carrier frequency 37000 cm−1 (270 nm) and full width at half-maximum (FWHM) 3754 cm−1, as displayed in Fig. 2 (A). The NUV CD and LA spectra of the fibril F9 are displayed with arbitrary unit in the same figure, showing that the laser power spectrum spans the absorption band in the NUV region. The four pulses in chronological order have wavevectors k1, k2, k3, and k4. The three consecutive delay times are denoted t1, t2, and t3. Setting t2 to zero and using Fourier transform t1 → Ω1 and t3 → Ω3, we present two-dimensional correlation plots with respect to Ω1 and Ω3 [31, 41]. The 2D photon echo signals with k4 = −k1 + k2 + k3 were calculated using the protocol described earlier [30]. Signals are plotted on a non-linear scale that clearly reveals both strong and weak features,
| (1) |
The signal S is first multiplied by a scale factor c to make its magnitude close to 1. For cS< 1 the scale is linear, arcsinh(cS) ≈ cS, and for larger cS it becomes logarithmic, arcsinh(cS) ≈ (S|S|−1)ln(2|cS|), so that weak features are amplified.
FIG. 2.
(A): The Gaussian shape laser pulse power spectrum, and NUV CD and LA spectra (linear scale and arbitrary unit) of the fibril F9 below. The absorption band in the NUV region is covered by the pulse bandwidth. (B) (Bottom) Simulated NUV CD (mean residue ellipticity) spectra (bottom) of F1, F2, F4, and F9 Aβ9–40 fibrils. (Top) two experimental spectra: Exp1[43] and Exp2[44] (magnified × 30). Dashed vertical lines mark the primary CD negative peaks. (C): Variation of intensities (ellipticity of the whole protein) of the four main CD peaks with the number of peptides n in Fn fibrils.
III. RESULTS
A. CD Spectra
The electronic spectra of the aromatic chromophores in proteins are sensitive to exciton couplings, which in turn depend on protein geometry [42]. Simulated 1D CD spectra of amyloid fibril series F1, F2, F4 and F9 are displayed in the bottom panel of Fig. 2 (B). Two experimental spectra are shown in the top panel (Exp1[43] and Exp2[44]). The magnitude of the simulated mean residue ellipticity (ellipticity of the protein divided by the number of residues) is in good agreement with experiment. The simulated CD intensity closely resembles the latest experimental CD spectrum (exp1) [43]. The negative feature observed in exp1 between 35000 cm−1 (286 nm) and 40000 cm−1 (250 nm) is reproduced by the simulations. ‘The CD peaks in exp2 are sharper than in exp1 and in our simulations. Nevertheless, the main negative CD peaks in exp2 at 36200 cm−1 (276 nm), 37300 cm−1 (268 nm), and 38300 cm−1 (261 nm) are well reproduced by simulations for F2, F4, and F9 at 36500 cm−1 (274 nm), 37300 cm−1 (268 nm), and 38200 cm−1 (262 nm), with less than 2 nm shifts. The negative peaks at 37300 cm−1 (268 nm), and 38300 cm−1 (261 nm) are missing in the CD spectrum of F1, suggesting that they originate from interactions between peptides.
We have used the ellipticity of the whole protein instead of the mean residue ellipticity, to compare CD intensities of fibrils with different size. The intensities of the four main CD peaks at wavelengths λ = 262, 268, 274, 315 nm (marked by dashed vertical lines in Fig. 2 (B)) grow linearly with the number of peptides n as seen in Fig. 2 (C), suggesting that the electronic transitions are localized within the peptide.
B. Non-chiral 2DNUV Signals
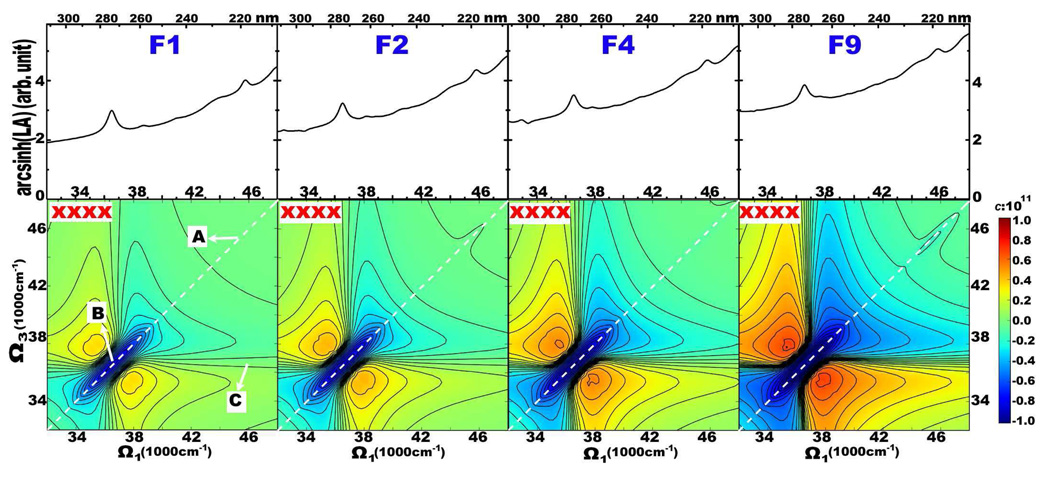
The simulated 2DNUV spectra of F1, F2, F4 and F9 for the non-chiral xxxx pulse polarization configuration [30] displayed in the bottom panel of Fig. 3 show a similar pattern. The corresponding linear absorption (LA) spectra with the nonlinear scale (Eq. 1) are shown in the top panel. The 1Lb and 1La transitions show up as two LA peaks at ~37000 and 46500 cm−1. These result in two diagonal peaks in the 2D spectra. Since we used Gaussian shaped laser pulses centered at 37000 cm−1, the signals are dominated by the 1Lb transitions, which show up as a negative (blue) diagonal peak (B) at 37000 cm−1 accompanied by two positive (red) side-bands. A relatively weak negative (blue) 1La diagonal peak (A) appears at ~46500 cm−1. The cross-peak of A and B, marked C, is too weak to be observed.
FIG. 3.
Simulated 2DNUV xxxx (bottom panel) spectra of fibrils F1, F2, F4, and F9 as marked. Linear absorption (LA) are given as top marginals. The scaling factor in Eq. 1 is c = 1011. A and B label diagonal peaks at 46500 and 37000 cm−1, and C marks their cross-peak. White dashed lines mark the diagonal.
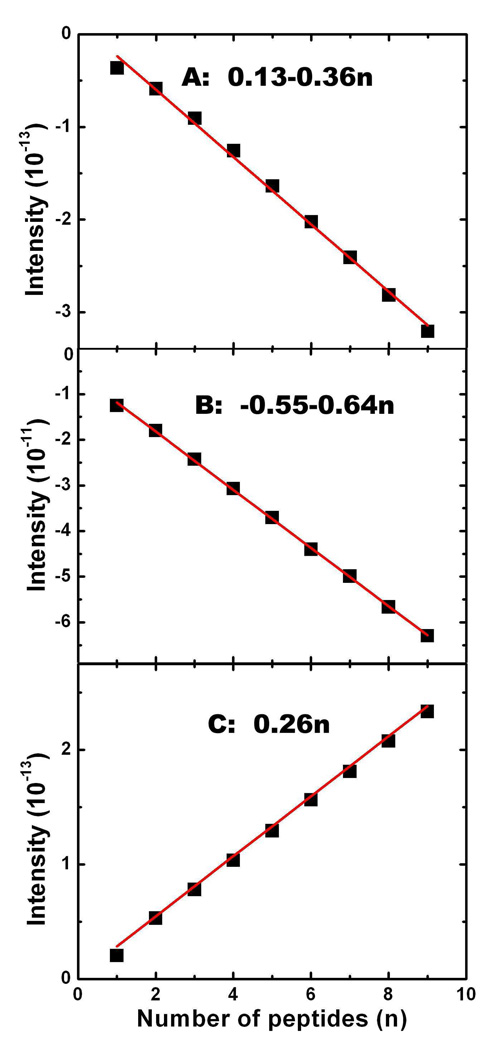
The intensities of the A, B, and C peaks scale linearly with the number of peptides, as shown in Fig. 4. As in Fig. 2 (B), this suggests that the excitons are localized. The 2DNUV peak intensities for F1–F9 satisfy:
| (2) |
where b is the slope in Fig. 4, and a accounts for edge effects in finite fibrils. The parameters a and b are listed in Table I. The finite a values for A and B comes from interactions between peptides. We believe that these are limited to the nearest neighboring peptides. Peak C has a = 0, suggesting the interactions between peptides do not contribute to the cross-peak.
FIG. 4.
Variation of intensities of 2DNUV xxxx peaks A, B and C with the number of peptides n in Fn fibrils.
TABLE I.
Fitted a, b, and c parameters of the linear (Eq. 2) or parabolic (Eq. 3) functions of 2DNUV signal as the function of the number of peptides n in Fn fibrils.
| Signal | a | b | c |
|---|---|---|---|
| xxxx, A | 0.13E-13 | −0.36E-13 | — |
| xxxx, B | −0.55E-11 | −0.64E-11 | — |
| xxxx, C | 0 | 0.26E-13 | — |
| xxxy, A | −1.23E-18 | 0 | 0.59E-18 |
| xxxy, B1 | 25.19E-17 | 5.50E-17 | −0.87E-17 |
| xxxy, B2 | −25.19E-17 | 5.50E-17 | −0.87E-17 |
| xxxy, C | −0.10E-18 | −0.33E-18 | — |
C. Chiral 2DNUV Signals
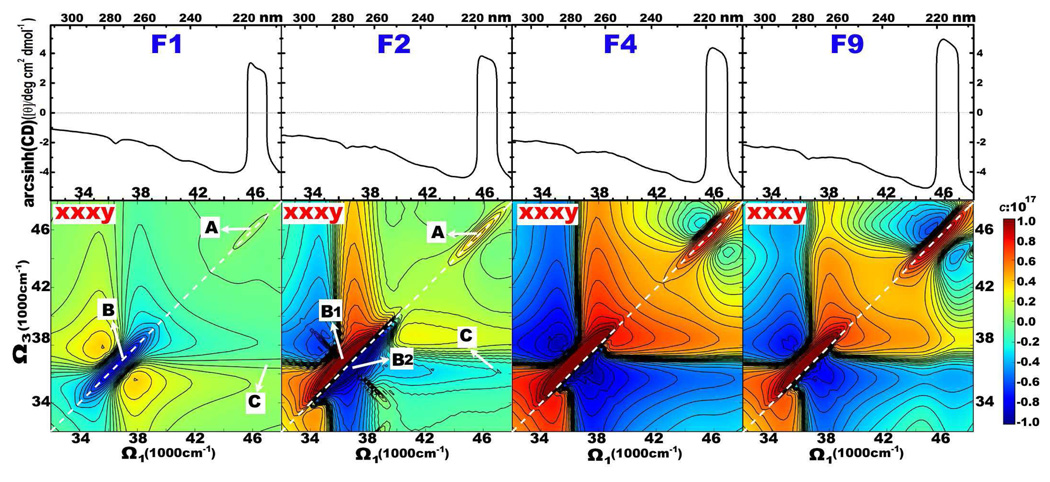
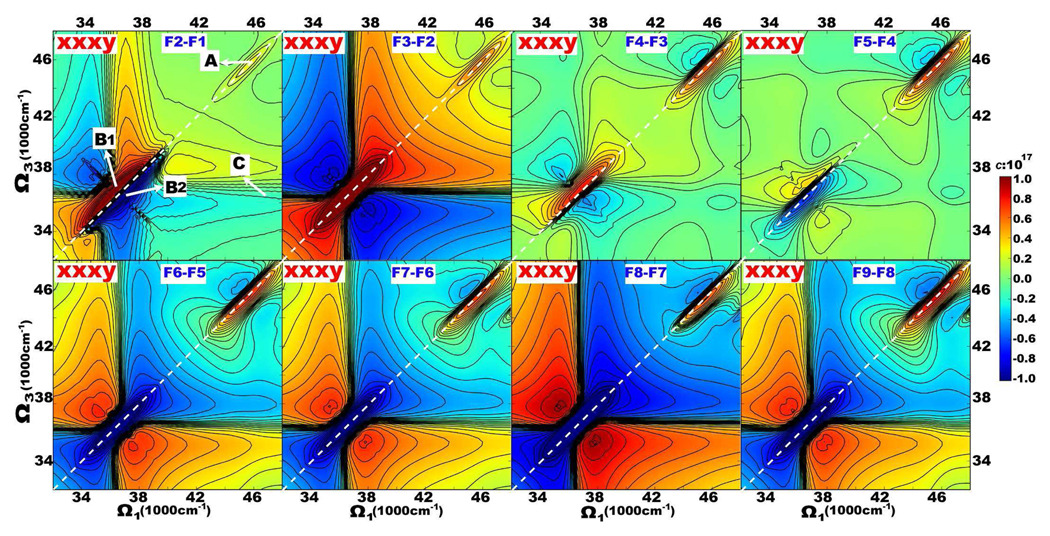
Our earlier studies [20, 30, 31] had demonstrated that chirality-induced 2D signals are more sensitive to protein geometry, and provide richer spectral features compared to their non-chiral counterparts. Simulated chiral 2DNUV xxxy spectra of F1, F2, F4 and F9 fibrils are displayed in the bottom panel of Fig. 5. The CD spectra on the top are given as marginals. CD Signals induced by 1La and 1Lb show up as the positive and negative peaks at 37000 and 46500 cm−1, respectively. These correspond to peaks A and B in the diagonal region of 46500 cm−1 and 37000 cm−1, respectively. Here again peak B is enhanced by the laser pulse power spectrum centered at 37000 cm−1. The coupled 1La/1Lb transitions produces cross-peak C. Unlike the non-chiral spectra, here the spectral pattern does change with fibril size. Difference spectra of Fn + 1-Fn are shown in Fig. 6.
FIG. 5.
Simulated 2DNUV xxxy (bottom panel) spectra of fibrils F1, F2, F4, and F9 as marked. CD spectra are given as top marginals. The scaling factor used in Eq. 1 is c = 1017. A and B label diagonal peaks at 46500 and 37000 cm−1, and C marks their cross-peak. White dashed lines mark the diagonal.
FIG. 6.
2DNUV xxxy difference spectra of F2-F1 to F9-F8. The scaling factor in Eq. 1 is c = 1017. White dashed lines mark the diagonal.
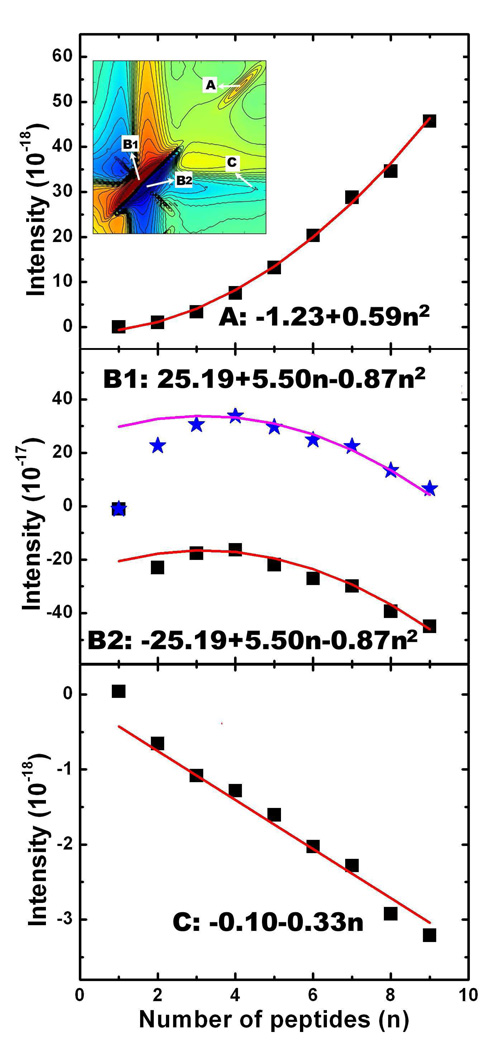
Moving from F1 to F9, peak A (1La transitions) retains the same pattern: a positive (red) diagonal peak accompanied by two negative (blue) side-bands, while the signal intensities increase monotonically. The rise of signal A can be seen in the difference spectra of F2-F1 to F9-F8, which increase with fibril size. Peak A intensities in F1 to F9 Fibrils plotted in Fig. 7 (A) show quadratic variation with n, unlike the linear dependence found for non-chiral xxxx signals.
FIG. 7.
Variation of intensities of 2DNUV xxxy peaks A, B1 and B2, and C with the number of peptides n in Fn fibrils. A, B1, B2, and C peak locations are given in the 2DNUV xxxy signal of a dimer fibril F2 shown in the inset 2D graph of (A).
The variation of signal B (1Lb transitions) with fibril size is more complex. In F1 it is dominated by a negative (blue) diagonal peak which is symmetric across the diagonal. Proceeding from F1 to F2, the negative (blue) diagonal peak is split into a positive (red) and a negative (blue) peak in the upper and lower triangle region, labeled B1 and B2 in Fig. 5, respectively. Correspondingly, the diagonal slice of F2 consists of one positive and one negative peaks. The difference signals of F2-F1 given in Fig. 6 suggest that interactions between two adjacent peptides produce B1 and B2. In the F3-F2 and F4-F3 difference spectra, the 1Lb region is dominated by a positive (red) diagonal peak. Consequently, the upper positive peak B1 becomes stronger while the lower negative peak B2 becomes weaker as we move from F2 to F4 in Fig. 5. A strong negative (blue) diagonal peak appears in the B region in F5-F4, which maintains the pattern and becomes dominant in F6-F5, F7-F6, F8-F7 and F9-f8, as shown in Fig. 6. Because of this, the xxxy signal of F9 in Fig. 5 has one strong B1 and one weak B2 peak, accompanied by two negative side-bands. The positive peak of 1Lb transitions in the diagonal slice of F9 is lower than that of F4, meaning that the B1 peak in 2D spectra is decreasing with the increase of fibril size. The peak intensities of B1 and B2 displayed in Fig. 7 (B) show that the size variation is parabolic, F1 being an exception. The extreme points (with the highest intensity) of B1 and B2 occur at F4, instead of F1 or F2. This suggests that interactions between neighboring peptides saturate only beyond F4.
The variation of the chiral 2DNUV diagonal peaks with fibril size n is parabolic:
| (3) |
c represents the delocalization of exciton states, b accounts for the localized contributions, whereas a represents the edge effect. The computed xxxy signal A and B of fibrils up to F9 are well reproduced by the fitted parabolic curves in Fig. 7 (A) and (B). Since signal B becomes stable only beyond F4, we have excluded F1, F2, and F3 in fitting for signal B. The coherence length of delocalized 1La and 1Lb transitions in fibrils exceeds nine peptides. The coefficients a, b, and c are listed in Table I. For A, b = 0, implying that the chiral signals induced by 1La transitions are delocalized. B1 and B2 have non-zero b, suggesting the existence of localized contributions. Our previous study[31] showed that the 1Lb transitions are strongly affected by the intra-molecular interactions of three aromatic chromophores in the same peptide. We have also found that xxxy peak B induced only by one Tyr or Phe chromophore in each peptide has no linear b term. We therefore believe that the localized parts of signal B1 and B2 originate from intra-molecular interactions between chromophores in the same peptide. The difference spectra of F6-F5 to F9-F8 shown in Fig. 6 reveal that the evolutions of signal B1 and B2 are dominated by the increase of a symmetric negative (blue) diagonal peak. This explains why they possess the same b and c values.
The cross-peaks C between the 1La/1Lb transitions in F1, F2 and F4 of Fig. 5, are very weak, but they may be observed in F9. These signals are clearly resolved in the difference spectra of Fig. 6. For peak C, fibrils F2 to F9 show linear size dependence in Fig. 7 (C), while F1 deviates from this trend. It is interesting to see that cross-peak C has linear scaling, and is therefore localized. Most likely, the cross-peak is induced by the coupled 1La/1Lb transitions of the same aromatic chromophore. As discussed above, the interaction between chromophores in the same peptide normally produces localized signals. We expect that the coupled 1La/1Lb transitions of the same chromophore should also be localized. The fitted red line based on Eq. 2 is displayed in Fig. 7, which explains very well fibrils F2 to F9, but not F1. This suggests that interactions inside a trimer still contribute. The fitted linear coefficients in Eq. 3 are given in Table I.
D. Exciton delocalization underlying the 2DNUV signals
The exciton eigen-state e is a superposition of localized chromophore n. To connect 2DNUV spectral features to the transition populations of aromatic side chains, we first examined the populations of exciton wavefunctions (ψe,n)2. A good measure of the coherence (delocalization) length of 2DNUV signals is provided by the participation ratio [45]
| (4) |
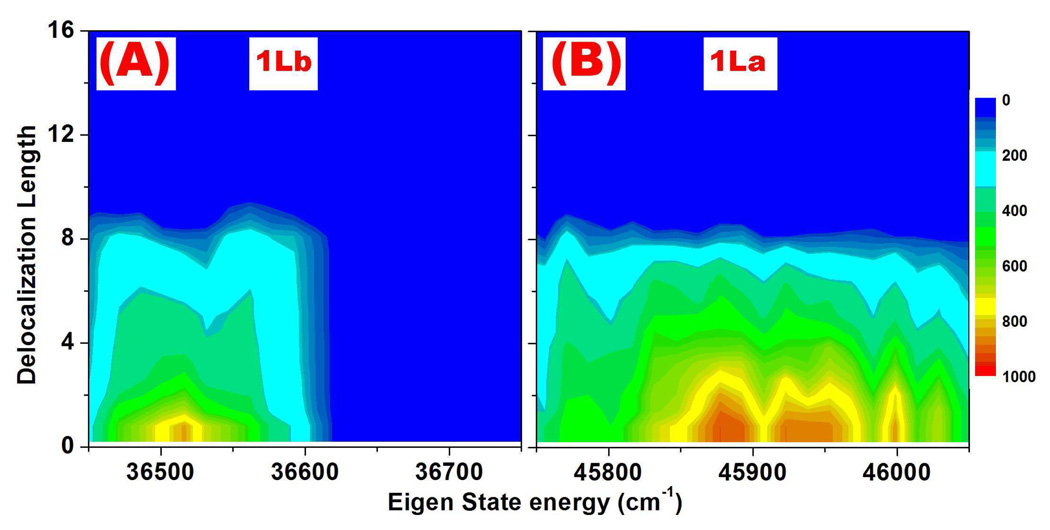
The distribution of delocalization length for different eigen-state energy is plotted in Fig. 8. Most eigen-states are delocalized over four to six peptides.
FIG. 8.
(A) and (B): Distribution of coherence lengths (Le in Eq. 4) of the exciton eigen wavefunction of 1Lb and 1La transitions in the F16 fibril.
The different size scaling of non-chiral and chiral signals can be rationalized by examining the origin of UV responses. The non-chiral response is induced by the transition dipoles of the zero-moment excited states, based on the dipole approximation which assumes that the optical fields are uniform across the molecules. On the other hand, chiral signals record interferences among transitions at different parts of molecules, and reflect variations of the phase of optical fields at different points. Our previous work [46] showed that non-chiral response SNC depends on the average product of exciton transition dipoles and the wavefunctions:
| (5) |
where m (n) denotes local chromophores, and ψe,m and μe,m (ψe,n and μe,n) are the wavefunction and transition dipole of the eigen-state e, respectively. Consequently, the non-chiral 2D signal originating from chromophore n can be estimated by
| (6) |
We can then calculate the coherence length of non-chiral 2DNUV signals using the following participation ratio:
| (7) |
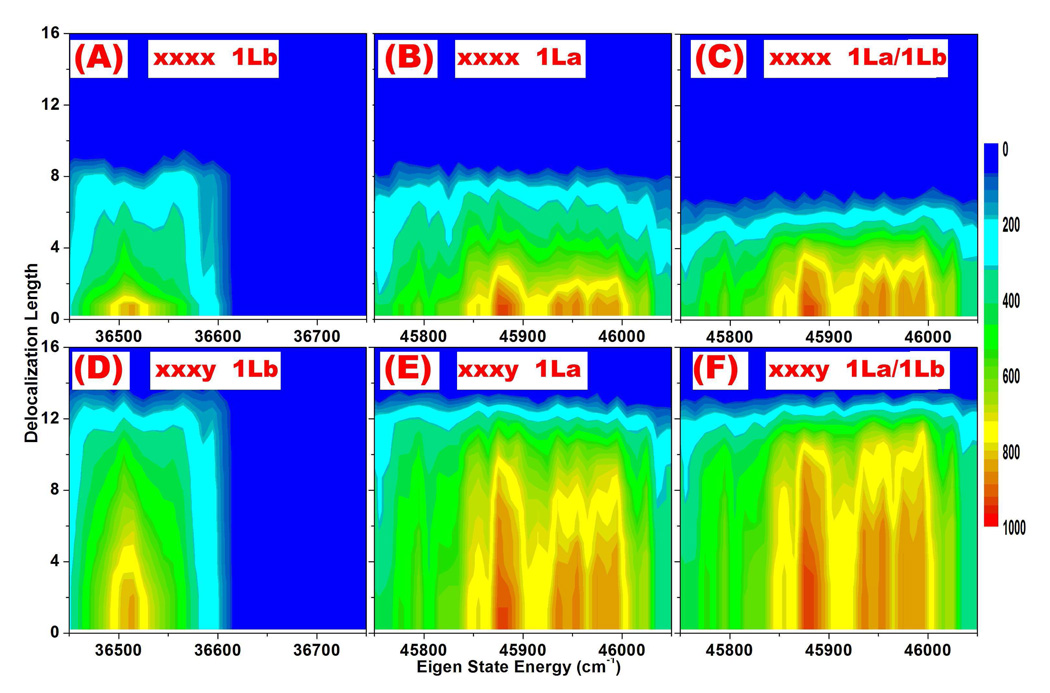
With two identical eigen-state energies e1 = e2, we have computed the coherence length of non-chiral (xxxx) diagonal peak A (1La) and B (1Lb). That of non-chiral (xxxx) cross-peak C (1La/1Lb transitions) has also been computed, by setting eigen-states e1 and e2 corresponding to 1La and 1Lb transitions, respectively. The distribution of coherence lengths of xxxx signals in F16 are displayed as the function of energy e1 in Fig. 9 (A), (B), and (C). The coherence lengths of 1Lb and 1La transitions induced xxxx signals displayed in Fig. 9 (A) and (B) are typically less than eight peptides, and averaged at around four, while that of coupled 1La/1Lb cross-peaks as shown in Fig. 9 (C) is three. Compared to the eigen-states displayed in Fig. 8, non-chiral signals have similar localization effects. This suggests the contributions of inter-molecular couplings decay quickly with increasing peptide-peptide distance, and demonstrates the localized behavior of non-chiral 2DNUV signals.
FIG. 9.
Distribution of the coherence lengths of non-chiral (top panel, Le1,e2,NC in Eq. 7) and chiral (bottom panel, Le1,e2,CH in Eq. 10) 2DNUV signal induced by 1Lb, 1La, and coupled 1La/1Lb transitions as marked in F16 fibril.
Chiral signals are much weaker than their non-chiral counterparts. In 2D spectroscopy, chiral signals can be measured if non-chiral signals (the leading dipole contributions) are eliminated by laser pulses with odd number of non-parallel polarization configurations (e.g. xxxy). The chiral response SCH can then be estimated from [23]
| (8) |
where Rmn is the displacement vector between the position of the two transition dipoles μe,m and μe,n. Because of the Rmn term, chiral signals could be much more delocalized than the non-chiral ones. Therefore, the chiral 2D signals of chromophore n can be evaluated from
| (9) |
We can thus calculate the coherence length of chiral signals using the participation ratios:
| (10) |
The distributions of coherence lengths of chiral (xxxy) 2DNUV signals in F16 are displayed in Fig. 9 (D), (E) and (F), corresponding to 1Lb, 1La, and 1La/1Lb transitions, respectively. Obviously, chiral signals are much more delocalized than eigen-states displayed in Fig. 8. The coherence lengths of xxxy signals have average at around nine peptides for 1Lb and ten peptides for 1La. The same average coherence lengths have been obtained in transition population analysis of F20. This enables us to establish the coherence lengths of chiral 2DNUV diagonal signals in amyloid fibrils as nine to ten peptides. However, the average coherence lengths of xxxy 1La/1Lb cross-peaks are found to be ten peptides in F16 and eleven peptides in F20, suggesting that they are delocalized as well. This is inconsistent with their linear scaling behavior, which we believe is due to the neglect of the effect of mismatched eigen-state energies (i:e:, |e1 − e2| >> 0) in Eq. 9. The energy differences between 1Lb and 1La transitions are about 10000 cm−1, so the correlations in the cross-peaks should be much more localized than those induced by two identical transitions in the diagonal peaks.
IV. DISCUSSION
We have employed a QM/MM protocol, to simulate the CD and 2DNUV spectra of a series of 32-residue β-amyloid (Aβ9–40) fibrils with a different number of peptides. Good agreement with experimental CD spectra validates our protocol. 2DNUV signals induced by the 1La, 1Lb, and coupled 1La/1Lb transitions, of the aromatic side chains in fibrils show that they are sensitive to the interactions between neighboring peptides, and are good indicators of size.
Interactions between peptides contribute to the non-chiral and chiral 2DNUV signals in a different way, leading to different size dependencies. We found that the coherence (delocalization) length of non-chiral 2D response is about four peptides for diagonal signals and three peptides for cross-peaks. Due to their localized nature, non-chiral 2DNUV signals grow linearly with fibril size, The 1La or 1Lb transitions-induced signals mainly come from two structural elements: monomers and dimers. Signals induced by coupled 1La/1Lb transitions are even more localized, as the inter-molecular interactions between peptides hardly contribute.
Since the coherence length of chiral 2D response is found to be nine to ten peptides, the chirality-induced 2DNUV signals in F1 to F9 show non-linear dependence on the fibril size. Signals produced by 1La transition grow quadratically in fibrils from one to nine peptides, indicating that the coherence length exceeds nine. For fibrils smaller than F4, the evolution of signals produced by 1Lb transitions is not as simple, since the spectral pattern varies. For larger fibrils, 1Lb signals show both parabolic and linear size dependence. The quadratic term represents delocalized inter-molecular interactions and the linear term is resulted from the localized intra-molecular interactions of aromatic chromophores in the same peptide. In contrast, signals induced by coupled 1La/1Lb transitions have linear size scaling as expected for transitions localized on three peptides.
The fact that 2DNUV signals induced by different transitions and interactions of various structural elements have a different scaling with size, should be useful for probing fibril size. A linear or a quadratic formula represent very well the size dependencies of most 2DNUV signals in amyloid fibrils, and can distinguish signals induced by different mechanisms. Using the coefficients tabulated here, the number of peptides can be calculated by comparing the intensities of different signals. The fibril aggregation kinetics can thus be monitored with a single-peptide resolution.
FIG. 1.
The series of Aβ9–40 amyloid Fibrils Fn (with n peptides) studied in this work.
Acknowledgments
We gratefully acknowledge the support of the National Institutes of Health (Grant GM059230 and GM091364), and the National Science Foundation (Grant CHE-0745892).
References
- 1.Rishton GM. Aggregator compounds confound amyloid fibrillization assay. Nat. Chem. Biol. 2008;4:159–160. doi: 10.1038/nchembio0308-159. [DOI] [PubMed] [Google Scholar]
- 2.Feng BY, Toyama BH, Wille H, Colby DW, Collins SR, May BCH, Prusiner SB, Weissman J, Shoichet BK. Small-molecule aggregates inhibit amyloid polymerization. Nat. Chem. Biol. 2008;4:197–199. doi: 10.1038/nchembio.65. [DOI] [PMC free article] [PubMed] [Google Scholar]
- 3.Chiti F, Dobson CM. Amyloid formation by globular proteins under native conditions. Nat. Chem. Biol. 2009;5:15–22. doi: 10.1038/nchembio.131. [DOI] [PubMed] [Google Scholar]
- 4.Fu L, Ma G, Yan ECY. In situ misfolding of human islet amyloid polypeptide at interfaces probed by sum frequency generation. J. Am. Chem. Soc. 2010;132:5405–5412. doi: 10.1021/ja909546b. [DOI] [PubMed] [Google Scholar]
- 5.Bleiholder C, Dupuis NF, Wyttenbach T, Bowers MT. Ion mobility-mass spectrometry reveals a conformational conversion from random assembly to β-sheet in amyloid fibril formation. Nature Chem. 2011;3:172–177. doi: 10.1038/nchem.945. [DOI] [PMC free article] [PubMed] [Google Scholar]
- 6.Tycko R. Progress towards a molecular-level structural understanding of amyloid fibrils. Curr. Opin. Struct. Biol. 2004;14:96–103. doi: 10.1016/j.sbi.2003.12.002. [DOI] [PubMed] [Google Scholar]
- 7.Caughey B, Lansbury PT. Protofibrils, pores, fibrils, and neurodegeneration: Separating the responsible protein aggregates from the innocent bystanders. Annu. Rev. Neurosci. 2003;26:267–298. doi: 10.1146/annurev.neuro.26.010302.081142. [DOI] [PubMed] [Google Scholar]
- 8.Lester-Coll NE, Riviera EJ, Soscia SJ, Doiron K, Wands JR, de la Monte SM. Intracerebral streptozotocin model of type 3 diabetes: Relevance to sporadic Alzheimer’s disease. J Alzheimers Dis. 2006;9:13–33. doi: 10.3233/jad-2006-9102. [DOI] [PubMed] [Google Scholar]
- 9.Sandberg A, Luheshi LM, Söllvander S, Pereira de Barros T, Macao B, Knowles TP, Biverstȧl H, Lendel C, Ekholm-Petterson F, Dubnovitsky A, Lannfelt L, Dobson CM, Härd T. Stabilization of neurotoxic Alzheimer amyloid-beta oligomers by protein engineering. Proc Natl Acad Sci U S A. 2010;107:15595–15600. doi: 10.1073/pnas.1001740107. [DOI] [PMC free article] [PubMed] [Google Scholar]
- 10.O’Nuallain B, Freir DB, Nicoll AJ, Risse E, Ferguson N, Herron CE, Collinge J, Walsh DM. Amyloid beta-protein dimers rapidly form stable synaptotoxic protofibrils. J. Neurosci. 2010;30:14411–14419. doi: 10.1523/JNEUROSCI.3537-10.2010. [DOI] [PMC free article] [PubMed] [Google Scholar]
- 11.Wei G, Jewett AI, Shea J-E. Structural diversity of dimers of the alzheimer amyloid-beta(25–35) peptide and polymorphism of the resulting fibrils. Phys. Chem. Chem. Phys. 2010;12:3622–3629. doi: 10.1039/c000755m. [DOI] [PubMed] [Google Scholar]
- 12.Fawzi NL, Yap E-H, Okabe Y, Kohlstedt KL, Brown SP, Head-Gordon T. Contrasting disease and nondisease protein aggregation by molecular simulation. Acc. Chem. Res. 2008;41:1037–1047. doi: 10.1021/ar800062k. [DOI] [PMC free article] [PubMed] [Google Scholar]
- 13.Shankar GM, Li S, Mehta TH, Garcia-Munoz A, Shepardson NE, Smith I, Brett FM, Farrell MA, Rowan MJ, Lemere CA, Regan CM, Walsh DM, Sabatini BL, Selkoe DJ. Amyloid-protein dimers isolated directly from Alzheimer’s brains impair synaptic plasticity and memory. Nat. Med. 2008;14:837–842. doi: 10.1038/nm1782. [DOI] [PMC free article] [PubMed] [Google Scholar]
- 14.Bernstein SL, Dupuis NF, Lazo ND, Wyttenbach T, Condron MM, Bitan G, Teplow DB, Shea J-E, Ruotolo BT, Robinson CV, Bowers MT. Amyloid-β protein oligomerization and the importance of tetramers and dodecamers in the aetiology of Alzheimer’s disease. Nature Chem. 2009;1:326–331. doi: 10.1038/nchem.247. [DOI] [PMC free article] [PubMed] [Google Scholar]
- 15.Chung HS, Ganim Z, Jones KC, Tokmakoff A. Transient 2D IR spectroscopy of ubiquitin unfolding dynamics. Proc. Natl. Acad. Sci. USA. 2007;104:14237–14242. doi: 10.1073/pnas.0700959104. [DOI] [PMC free article] [PubMed] [Google Scholar]
- 16.Mukamel S, Abramavicius D, Yang L, Zhuang W, Schweigert IV, Voronine D. Coherent multidimensional optical probes for electron correlations and exciton dynamics: from NMR to X-rays. Acc. Chem. Res. 2009;42:553–562. doi: 10.1021/ar800258z. [DOI] [PMC free article] [PubMed] [Google Scholar]
- 17.Bagchi S, Falvo C, Mukamel S, Hochstrasser RM. 2D-IR experiments and simulations of the coupling between amide-I and ionizable side chains in proteins: Applications to the villin headpiece. J. Phys. Chem. 2009;113:11260–11273. doi: 10.1021/jp900245s. [DOI] [PMC free article] [PubMed] [Google Scholar]
- 18.Kim YS, Liu L, Axelsen PH, Hochstrasser RM. Two-dimensional infrared spectra of isotopically diluted amyloid flbrils from Aβ40. Proc. Natl. Acad. Sci. USA. 2008;105:7720–7725. doi: 10.1073/pnas.0802993105. [DOI] [PMC free article] [PubMed] [Google Scholar]
- 19.Zhuang W, Abramavicius D, Voronine DV, Mukamel S. Multidimensional ultrafast spectroscopy special feature: Simulation of two-dimensional infrared spectroscopy of amyloid fibrils. Proc. Natl. Acad. Sci. USA. 2007;104:14233–14236. doi: 10.1073/pnas.0700392104. [DOI] [PMC free article] [PubMed] [Google Scholar]
- 20.Jiang J, Abramavicius D, Falvo C, Bulheller BM, Hirst JD, Mukamel S. Simulation of two dimensional ultraviolet (2DUV) spectroscopy of amyloid fibrils. J. Phys. Chem. B. 2010;114:12150–12156. doi: 10.1021/jp1046968. [DOI] [PMC free article] [PubMed] [Google Scholar]
- 21.Strasfeld DB, Ling YL, Shim SH, Zanni MT. Tracking fiber formation in human islet amyloid polypeptide with automated 2D-IR spectroscopy. J. Am. Chem. Soc. 2008;130:6698–6699. doi: 10.1021/ja801483n. [DOI] [PMC free article] [PubMed] [Google Scholar]
- 22.Shim S-H, Gupta R, Ling YL, Strasfeld DB, Raleigh DP, Zanni MT. Two-dimensional IR spectroscopy and isotope labeling defines the pathway of amyloid formation with residue-specific resolution. Proc. Natl. Acad. Sci. USA. 2009;106:6614–6619. doi: 10.1073/pnas.0805957106. [DOI] [PMC free article] [PubMed] [Google Scholar]
- 23.Zhuang W, Sgourakis NG, Li ZY, Garcia AE, Mukamel S. Discriminating early stage aβ42 monomer structures using chirality-induced 2dir spectroscopy in a simulation study. Proc. Natl. Acad. Sci. USA. 2010;107:15687–15692. doi: 10.1073/pnas.1002131107. [DOI] [PMC free article] [PubMed] [Google Scholar]
- 24.Ajdarzadeh Oskouei A, Bram O, Cannizzo A, van Mourik F, Tortschanoff A, Chergui M. Photon echo peak shift experiments in the uv: p-terphenyl in different solvents. J. Mol. Liq. 2008;141:118–123. [Google Scholar]
- 25.Ajdarzadeh Oskouei A, Bram O, Cannizzo A, van Mourik F, Tortschanoff A, Chergui M. Ultrafast uv photon echo peak shift and uorescence up conversion studies of non-polar solvation dynamics. Chem. Phys. 2008;350:104–110. [Google Scholar]
- 26.Tseng C, Matsika S, Weinacht TC. Two-dimensional ultrafast fourier transform spectroscopy in the deep ultraviolet. Opt. Express. 2009;17:18788–18793. doi: 10.1364/OE.17.018788. [DOI] [PubMed] [Google Scholar]
- 27.Beutler M, Ghotbi M, Noack F, Brida D, Manzoni C, Cerullo G. Generation of high-energy sub-20 fs pulses tunable in the 250–310 nm region by frequency doubling of a high-power noncollinear optical parametric amplifier. Opt. Lett. 2009;34:710–712. doi: 10.1364/ol.34.000710. [DOI] [PubMed] [Google Scholar]
- 28.Corkum P, De Silvestri S, Nelson KA, Riedle E, Schoenlein RW, editors. Ultrafast Phenomena XVI. Springer: 2009. [Google Scholar]
- 29.Selig U, Schleussner C-F, Foerster M, Langhojer F, Nuernberger P, Brixner T. Coherent two-dimensional ultraviolet (2d-uv) spectroscopy in fully noncollinear geometry. Opt. Lett. 2010 doi: 10.1364/OL.35.004178. (In Press) [DOI] [PubMed] [Google Scholar]
- 30.Abramavicius D, Jiang J, Bulheller BM, Hirst JD, Mukamel S. Simulation study of chiral two dimensional ultraviolet (2DUV) spectroscopy of the protein backbone. J. Am. Chem. Soc. 2010;132:7769–7775. doi: 10.1021/ja101968g. [DOI] [PMC free article] [PubMed] [Google Scholar]
- 31.Jiang J, Mukamel S. Two-dimensional near-ultraviolet spectroscopy of aromatic residues in amyloid fibrils: A first principles study. Phys. Chem. Chem. Phys. 2011;13:2394–2400. doi: 10.1039/c0cp02047h. [DOI] [PMC free article] [PubMed] [Google Scholar]
- 32.Petkova AT, Yau WM, Tycko R. Experimental constraints on quaternary structure in Alzheimer’s beta-amyloid fibrils. Biochemistry. 2006;45:498–512. doi: 10.1021/bi051952q. [DOI] [PMC free article] [PubMed] [Google Scholar]
- 33.Buchete N-V, Tycko R, Hummer G. Molecular dynamics simulations of Alzheimer’s-amyloid protofilaments. J. Mol. Biol. 2005;353:804–821. doi: 10.1016/j.jmb.2005.08.066. [DOI] [PubMed] [Google Scholar]
- 34.Phillips JC, Braun R, Wang W, Gumbart J, Tajkhorshid E, Villa E, Chipot C, Skeel RD, Kalé L, Schulten K. Scalable molecular dynamics with NAMD. J. Comput. Chem. 2005;26:1781–1802. doi: 10.1002/jcc.20289. [DOI] [PMC free article] [PubMed] [Google Scholar]
- 35.MacKerell AD, Jr, Bashford D, Bellott M, Dunbrack RL, Jr, Evanseck JD, Field MJ, Fischer S, Gao J, Guo H, Ha S, Joseph-McCarthy D, Kuchnir L, Kuczera K, Lau FTK, Mattos C, Michnick S, Ngo T, Nguyen DT, Prodhom B, Reiher W, III, Roux B, Schlenkrich M, Smith JC, Stote R, Straub J, Watanabe M, Wiorkiewicz-Kuczera J, Yin D, Karplus M. All-atom empirical potential for molecular modeling and dynamics studies of proteins. J. Phys. Chem. B. 1998;102:3586–3616. doi: 10.1021/jp973084f. [DOI] [PubMed] [Google Scholar]
- 36.Jorgensen WL, Chandrasekhar J, Madura JD, Impey RW, Klein ML. Comparison of simple potential functions for simulating liquid water. J. Chem. Phys. 1983;79:926–935. [Google Scholar]
- 37.Aquilante F, De Vico L, Ferré N, Ghigo G, Malmqvist P-A, Neogrády P, Pedersen TB, Pitonák M, Reiher M, Roos BO, Serrano-Andrées L, Urban M, Veryazov V, Lindh R. Molcas 7: The next generation. J. Comput. Chem. 2009;31:224–247. doi: 10.1002/jcc.21318. [DOI] [PubMed] [Google Scholar]
- 38.Jiang J, Abramavicius D, Bulheller BM, Hirst JD, Mukamel S. Ultraviolet spectroscopy of protein backbone transitions in aqueous solution: Combined QM and MM simulations. J. Phys. Chem. B. 2010;114:8270–8277. doi: 10.1021/jp101980a. [DOI] [PMC free article] [PubMed] [Google Scholar]
- 39.Hirst JD. Improving protein circular dichroism calculations in the far ultraviolet through reparametrizing the amide chromophore. J. Chem. Phys. 1998;109:782–788. [Google Scholar]
- 40.Bulheller BM, Rodger A, Hirst JD. Circular and linear dichroism of proteins. Phys. Chem. Chem. Phys. 2007;9:2020–2035. doi: 10.1039/b615870f. [DOI] [PubMed] [Google Scholar]
- 41.Abramavicius D, Palmieri B, Voronine DV, Šanda F, Mukamel S. Coherent multidimensional optical spectroscopy of excitons in molecular aggregates; quasiparticle, vs. super-molecule perspectives. Chem. Rev. 2009;109:2350–2408. doi: 10.1021/cr800268n. [DOI] [PMC free article] [PubMed] [Google Scholar]
- 42.Rogers DM, Hirst JD. First-principles calculations of protein circular dichroism in the near ultraviolet. Biochemistry. 2004;43:11092–11102. doi: 10.1021/bi049031n. [DOI] [PubMed] [Google Scholar]
- 43.Tang C-H, Zhang Y-H, Wen Q-B, Huang QR. Formation of amyloid fibrils from kidney bean 7s globulin (phaseolin) at pH 2.0. J. Agric. Food Chem. 2010;58:8061. doi: 10.1021/jf101311f. [DOI] [PubMed] [Google Scholar]
- 44.Sian AK, Frears ER, El-Agnaf OMA, Patel BP, Manca MF, Siligardi G, Hussain R, Austen BM. Oligomerization of β-amyloid of the alzheimer’s and the dutch-cerebral-haemorrhage types. Biochem. J. 2000;349:299–308. doi: 10.1042/0264-6021:3490299. [DOI] [PMC free article] [PubMed] [Google Scholar]
- 45.Hayashi T, Mukamel S. Vibraion-exciton couplings for the amide i, ii, iii and a modes of peptides. J. Phys. Chem. B. 2007;111:11032–11046. doi: 10.1021/jp070369b. [DOI] [PubMed] [Google Scholar]
- 46.Zhuang W, Hayashi T, Mukamel S. Coherent multidimensional vibrational spectroscopy of biomolecules; concepts, simulations and challenges. Agnew Chem. Int. Ed. 2009;48:3750–3781. doi: 10.1002/anie.200802644. [DOI] [PMC free article] [PubMed] [Google Scholar]


