

Abstract
Major depression (MD) is one of the most prevalent psychiatric disorders and a leading cause of loss in work productivity. A combination of genetic and environmental risk factors likely contributes to MD. We present data from a genome-wide association study revealing a neuron-specific neutral amino acid transporter (SLC6A15) as a novel susceptibility gene for MD. Risk allele carrier status in humans and chronic stress in mice were associated with a downregulation of the expression of this gene in the hippocampus, a brain region implicated in the pathophysiology of MD. The same polymorphisms also showed associations with alterations in hippocampal volume and neuronal integrity. Thus, decreased SLC6A15 expression, due to genetic or environmental factors might alter neuronal circuits related to the susceptibility for MD. Our convergent data from human genetics, expression studies, brain imaging and animal models suggest a novel pathophysiological mechanism for MD that may be accessible to drug targeting.
INTRODUCTION
Major depression (MD) is a common psychiatric disorder with a lifetime prevalence rate of 15–17% (95% CI) (Ebmeier et al., 2006). It is not only a potentially fatal disease with about 2% of patients committing suicide (Bostwick and Pankratz, 2000)but also one of the leading causes worldwide for loss in work productivity (Ebmeier et al., 2006; Ustun et al., 2004). Current treatments are indispensable but their clinical efficacy is still unsatisfactory, as reflected by high rates of treatment resistance and side effects (Fava and Rush, 2006). Identification of mechanisms causing depression is pertinent for discovery of better antidepressants. The heritability of this disorder has been estimated to range from 34–42% (95% CI) (Ebmeier et al., 2006) and several attempts to identify susceptibility genes by linkage and candidate gene approaches have been undertaken. In candidate gene studies, BDNF, SLC6A4, ACE, P2RX7, TPH2, PDE9A, PDE11A, DISC1, and GRIK3 have been reported to be associated with the disease (Levinson, 2006). Only few of these initial reports have been confirmed by subsequent studies or in meta-analyses. In the last years, the first genome-wide association (GWA) case-control studies in MD were published. None reported genome-wide significant results and their top hits were difficult to be replicated (Lewis et al., 2010a; Muglia et al., 2008; Rietschel et al., 2010; Shi et al., 2010; Sullivan et al., 2009; Wray et al., 2010). Phenotypic diversity and genetic heterogeneity as well as a considerable environmental contribution inherent to MD have been considered to represent major obstacles for the identification of causative variants.
Here we present results of a GWA case-control study in a stringently selected sample of MD inpatients of a tertiary clinic in Munich, Germany, and matched controls devoid of any lifetime psychiatric diagnoses (N=353/366) recruited for the Munich Antidepressant Response Signature (MARS) study (Hennings et al., 2009; Ising et al., 2009). We performed replication of the results of the GWAS in six additional independent samples of German, Dutch, United Kingdom (U.K.) and African American origin (Binder et al., 2008; Choy et al., 2009; Hofman et al., 2007; Lewis et al., 2010b; Muglia et al., 2008; Rietschel et al., 2010). The herein reported association results are based on an overall sample size of 15,089 unrelated individuals.
To further characterize the functional relevance of the identified locus, we analyzed genotypic influences of associated SNPs on pre-mortem human hippocampus and lymphoblastoid cell line expression profiles. We also employed in vivo high resolution structural magnetic resonance imaging (MRI) and proton nuclear magnetic resonance spectroscopy (1H-NMR) with a focus on the hippocampal formation. We selected this brain region based on our gene expression results and because decreased neuronal integrity in this brain region had previously been identified as a risk factor for major depression (Frodl et al., 2002). Moreover, we investigated a possible role of the candidate locus in mediating stress vulnerability by interrogating its hippocampal expression in a well established mouse model of chronic social stress (Schmidt et al., 2007) as chronic stress represents an established risk factor for MD (Wang, 2005).
RESULTS
SNPs on 12q21.31 are associated with MD
We performed a GWA study in a sample of 353 unipolar depressed German inpatients from the MARS study (Hennings et al., 2009) and 366 screened controls using Illumina 100k and 300k Beadchips (Manhattan plot, see fig. S2). After applying stringent quality control criteria (see methods), 365,676 SNPs entered association analysis. Neither genomic controls nor Eigenstrat showed evidence for population stratification in this sample (fig. S1). The common SNP rs1545843 (MAF=0.41 in controls) on chr12q21.31 showed experiment-wide significance in a recessive mode of inheritance (AA vs. AG+GG) after applying the permutation-based minimum p method for multiple comparison correction over all tested SNPs and genetic models (tab. 1, fig. 1B and fig. S2; N=353/366, nominal p=5.53e-08; OR=2.84 {95% confidence interval 1.92 – 4.21}). Seven additional common SNPs in linkage disequilibrium (LD) with rs1545843 located in a region spanning about 450 kb gave nominal p-values smaller than 5.0e-04 applying the recessive model (tab. 1, fig. 1B and fig. S2). The pairwise r2-values ranged from 0.40 to >0.99 in controls (fig. 2A and fig. S2A) suggesting that all eight SNPs might tag the same underlying causative variant. In fact rs1545843 and rs1031681 can be used as tagging SNPs for the associated variants within this locus in Europeans and fall into two separate bins, with an interbin r-squared of 0.67.
Table 1. Association results of the discovery GWAS and the first round of replication.
rs1545843 showed genome-wide significant association with MD in the discovery case-control GWAS (MARS) under a recessive model. This genome-wide significant association was confirmed in a subsequent meta-analysis over a total of 6 samples from 5 independent studies. rs1545843 and rs1031681 best tag the region of association with MD on chr12q.21.31 defined by eight SNPs in moderate to strong linkage disequilibrium with each other in Europeans (fig. 1 and 2). rs7975057 is shown as an example of a third SNP which was one of the more consistently associated SNPs across all round 1 replication samples.
| SNP (position on chr. 12) |
Allelesa | MARS study (GWAS sample) |
Southern German recurrent depression replication sample |
MARS study replication sample |
Bonn replication sample (West Germany) |
ERF study (Dutch replication sample) |
EMORY study (African-Americans) |
Meta Analysis
|
||||||||||||||
|---|---|---|---|---|---|---|---|---|---|---|---|---|---|---|---|---|---|---|---|---|---|---|
| N | P | OR | N | P | OR | N | P | OR | N | P | OR | N | P | OR | N | P | OR | N | P | OR | ||
| Co | Allelic | Allelic | Co | Allelic | Allelic | Co | Allelic | Allelic | Co | Allelic | Allelic | Co | Allelic | Allelic | Co | Allelic | Allelic | Co | Allelic | Allelic | ||
| Ca | Rec | Rec | Ca | Rec | Rec | Ca | Rec | Rec | Ca | Rec | Rec | Ca | Rec | Rec | Ca | Rec | Rec | Ca | Rec | Rec | ||
| All | Dom | Dom | All | Dom | Dom | All | Dom | Dom | All | Dom | Dom | All | Dom | Dom | All | Dom | Dom | All | Dom | Dom | ||
| rs1545843 (83088199) | A/G | 366 | 6.0E-05 | 1.55 | 1022 | 3.3E-03 | 1.19 | 236 | 1.3E-01 | 1.15 | 1157 | 4.4E-01 | 0.99 | 290 | 6.8E-02 | 1.19 | 684 | 6.8E-03 | 1.29 | 3755 | 1.9E-06 | 1.20 |
| 353 | 5.5E-08 | 2.85 | 917 | 1.6E-02 | 1.27 | 300 | 4.2E-02 | 1.47 | 292 | 1.4E-01 | 1.18 | 283 | 9.3E-03 | 1.62 | 307 | 2.9E-02 | 1.30 | 2452 | 2.3E-08 | 1.42 | ||
| 719 | 1.8E-01 | 0.80 | 1939 | 1.1E-02 | 0.79 | 536 | 3.9E-01 | 0.95 | 1449 | 1.1E-01 | 1.19 | 573 | 4.3E-01 | 0.97 | 991 | 1.1E-02 | 0.59 | 6207 | 2.9E-02 | 0.87 | ||
|
|
|
|
|
|
|
|
|
|||||||||||||||
| rs7975057 (83288331) | A/G | 366 | 1.5E-03 | 1.42 | 998 | 1.4E-03 | 1.22 | 236 | 2.9E-02 | 1.27 | 1155 | 5.0E-01 | 1.00 | 290 | 4.1E-03 | 1.38 | 675 | 3.0E-02 | 1.20 | 3720 | 4.1E-07 | 1.22 |
| 353 | 3.0E-05 | 2.43 | 898 | 3.2E-02 | 1.25 | 300 | 8.4E-03 | 1.82 | 291 | 1.7E-01 | 1.17 | 283 | 2.2E-03 | 1.92 | 299 | 3.6E-02 | 1.30 | 2424 | 2.0E-07 | 1.43 | ||
| 719 | 1.7E-01 | 0.80 | 1896 | 1.6E-03 | 0.75 | 536 | 1.8E-01 | 0.84 | 1446 | 2.2E-01 | 1.11 | 573 | 4.9E-02 | 0.75 | 974 | 1.1E-01 | 0.80 | 6144 | 1.3E-03 | 0.83 | ||
|
|
|
|
|
|
|
|
|
|||||||||||||||
| rs1031681 (83444465) | A/G | 366 | 2.0E-03 | 1.41 | 1016 | 1.6E-03 | 1.21 | 236 | 3.3E-02 | 1.27 | 1130 | 3.8E-01 | 0.97 | 290 | 1.7E-03 | 1.42 | 681 | 3.2E-01 | 1.05 | 3719 | 1.2E-05 | 1.18 |
| 353 | 2.5E-04 | 2.17 | 915 | 1.2E-02 | 1.31 | 300 | 3.0E-02 | 1.61 | 289 | 3.7E-01 | 1.05 | 283 | 1.4E-03 | 1.98 | 303 | 5.0E-01 | 1.00 | 2443 | 4.7E-05 | 1.32 | ||
| 719 | 1.0E-01 | 0.77 | 1931 | 5.7E-03 | 0.78 | 536 | 1.1E-01 | 0.79 | 1419 | 2.4E-01 | 1.11 | 573 | 2.5E-02 | 0.71 | 984 | 2.1E-01 | 0.87 | 6162 | 1.6E-03 | 0.83 | ||
Abbreviation: Allelic: additive allele dosage model (A vs. G), Ca: cases, Co: controls, Dom: dominant model (GG vs. AA+AG), N: number of individuals, OR: odds ratio, P: nominal p-value, Rec: recessive model (AAvs. AG+GG).
The allele shown in bold confers greater odds that the carrier is a case (risk allele for depression). The direction of association is consistent between samples. There is a minor-major allele switch between Europeans (minor allele: A, MAF in controls: 0.36–0.45) and African-Americans (minor allele G, MAF in controls:0.35–0.46).
Fig. 1. Genomic context of the associated region on 12q21.31.

(A) Relevant features of the genomic architecture of a 3 Mb region comprising the 450 kb region of association with MD according to the UCSC Genome Browser: RefSeq annotated genes (blue), human mRNAs and expressed sequence tags from GenBank (black), HapMap Linkage Disequilibrium (red: high LD, white: low LD) and hotspots of homologous recombination from SNP genotyping data provided by HapMap and Perlegen (black). The associated region did not map to any known gene (compare with 2B). The flanking next genes to the region of association are SLC6A15 (+287 kb), a solute carrier family 6 gene that codes for a sodium-dependent branched amino acid transporter with high gene expression in neurons of the brain and TMTC2 (−989 kb), the transmembrane and tetratricopeptide repeat containing 2 gene of unknown function (see also tab. S1). (B) The negative common logarithm (−log10) of the best model p-values (y-axis) of all tested SNPs in the shown region from genome-wide case-control association testing in the discovery sample were plotted against the SNP’s chromosome positions (x-axis). The horizontal line across the figure indicates the genome-wide significance level of the experiment. The dot above this line represents the -log10 p-value of rs1545843. The corresponding Manhatten plot over all tested SNPs and chromosomes is shown in fig. S2.
Fig. 2.
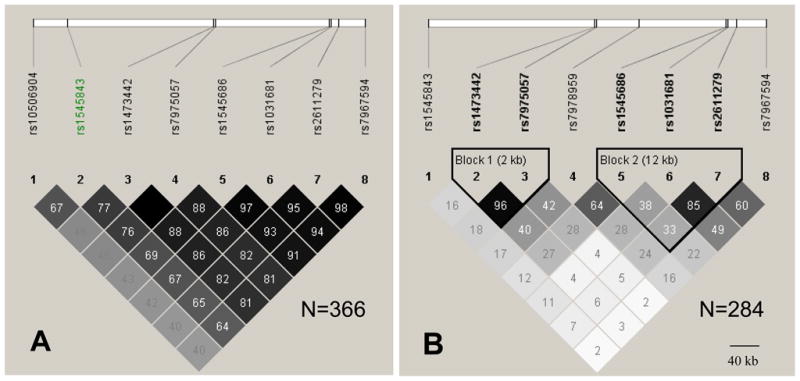
LD structure of the 8 SNPs associated with MD on 12q21.31 is presented in (A) German controls of the GWAS in MD (N=366); and (B) in the African-American control sample (BDI<14, N=284). Pairwise r-squared values multiplied with 100 are shown for each SNP pair. rs1545843 (SNP 2) which reached experiment-wide significance in the GWAS, is in medium LD with the other seven associated SNPs in Europeans, but in low LD in African-Americans (SNP 1).
We then genotyped the genome-wide significant SNP (rs1545843) of the GWA study together with seven to nineteen SNPs in LD within this locus in five independent samples. These comprised three German case-control samples, including two samples for which GWA data have been published (Muglia et al., 2008; Rietschel et al., 2010). The German samples consist of patients with recurrent MD and matched controls screened for the absence of life time anxiety and mood disorders recruited in Southern Germany (N=920/1024) (Muglia et al., 2008), patients with major depression and controls recruited around the German city of Bonn (N=292/1155) as well as patients and controls recruited as a follow-up of the discovery sample (N=300/236). In addition, the association was tested in a sample from the Netherlands. In the Erasmus Rucphen Family (ERF) study subsample (N=1160)(Choy et al., 2009) symptoms of depression during the past week were assessed using the Center for Epidemiologic Studies Depression Scale (CES-D) and the depression subscale of the Hospital Anxiety and Depression Scale (HADS-D). To create a proxy for case/control status, we compared the individuals rating in the upper depression scale quartile (CES-D≥16.0: cases, indicative of a depressive disorder (Luijendijk et al., 2008)) with those rating in the lower quartile (CES-D≤3: controls). Finally, we tested for association of the identified locus in a cross-sectional study of African-American subjects with significant levels of trauma recruited in the waiting rooms of an urban public hospital in Atlanta (N=991) (Binder et al., 2008). Depression was rated by using the quantitative Beck Depression Inventory (BDI). In contrast to populations of European descent these SNPs displayed much less LD among each other (fig. 2B). For this study, we also created a proxy for case-control status. As BDI scores higher than 16 are equated to clinically relevant symptoms of current MD (Viinamaki et al., 2004), we divided the sample at this cut-off for a case-control analysis.
Table 1 shows the results of the association in all six samples for rs1545843 as well as two SNP in moderate LD with it, rs1031681 and rs7975057. Testing the recessive model of rs1545843, we observed nominally significant association in four of the five replication samples, with the same direction of the effect in all samples. A meta-analysis conducted across all samples resulted in a genome-wide significant association with a p-value of 2.34e-08 (4.37e-08 corrected for three tested genetic models) for the recessive model of rs1545843 (see tab. 1). Homozygote carriers of the A-allele of this SNP had a 1.42-fold higher risk to suffer from depression and depressive symptoms compared to carriers of the two other genotypes.
To replicate the genome-wide significant association of increased risk for depression in homozygous carriers of the A-allele of rs1545843, we performed an additional replication study with the UK-cases and controls of the RADIANT study(Lewis et al., 2010b) and adding the WTCCC2 control cohorts. This resulted in a cohort of 1636 cases with recurrent unipolar depression and 7246 controls. An analysis using logistic regression showed significant evidence for both an effect of the AA genotype on risk in the same direction as in the other studies (OR = 1.344, 95% CI 1.080–1.672, p = 0.008) as well as for an interaction of sex with this effect (p = 0.0150). The RADIANT/WTCCC2 study was the only study showing such sex × genotype interaction on depression. A more detailed description of this association is given in the supplemental data section. Finally, when combining the corrected estimate for the genotypic effect of AA on depression in the RADIANT/WTCCC2 study with the effects in the previous studies we arrive at an estimate of an OR = 1.398 (95% CI 1.254–1.557) with a combined two-sided p-value of 1.41e-09 (fig. 3). Considering only the replication studies (thus excluding MARS) we have an estimate of 1.315 for the OR (95% CI 1.172 – 1.477) with a two-sided p-value of 3.19e-06.
Fig. 3. Forest plot of the combined meta-analysis over six independent studies.

rs1545843 remained genome-wide significantly associated with MD in the meta-analysis after replication round 1 under the recessive model (AA vs. AG+GG, see tab. 1). This association was further replicated in the RANDIANT/WTCCC2 sample. The combined meta-analysis p-value over a total of 7 samples was 1.41e-09. MARS: The Munich antidepressant response signature study, the German GWAS discovery case-control MD sample (N=353/366). Munich recurrent depression: The Southern German recurrent depression and control replication sample (N=917/1022). ERF: The Dutch Erasmus Rucphen Family study MD case-control subsample (N=283/290) Emory: The African-American MD case-control subsample from Emory University in Atlanta (N=307/684). Bonn: West German MD case-control replication sample (N=292/1157)(Rietschel et al., 2010). MARS2: Additional MD cases and controls from the MARS study which were recruited after the GWAS (N=300/236). RADIANT/WTCCC2: UK-cases and controls of the RADIANT study and additional controls from the WTCCC2 cohorts (N=1636/7246).
While the association with major depression and depressive symptoms thus was consistent in samples across different ethnicities, this did not hold true for incident late-life depression. The association did not replicate in the Rotterdam study (N=3512) (Hofman et al., 2007) where subjects older than 55 years of age and free of dementia were screened with the CES-D at baseline and two follow up time points (Luijendijk et al., 2008). A case-control analysis was performed by comparing subjects who developed depressive disorders and depressive syndromes at follow up time points (N=438) with individuals without clinically relevant depressive symptoms (N=3074) (mean age SD of cases: 72.7 ± 7.4 and controls: 73.9 ± 8.3). None of the investigated SNPs reached significant association. The average age of 72 years at which the index depressive episode in the Rotterdam sample was diagnosed is substantially older than the average age in the combined German discovery sample and recurrent depression sample (50.4 ± 13.9 years), the Dutch ERF sample (48.7 ± 15.0 years) and the African-American sample (39.3 ± 13.7 years). In fact, in the other samples significant associations with rs1545843 were only observed when individuals ≤55 years were selected but not in the older age group. A series of studies indicate that late-life depression is pathophysiologically distinct from earlier onset MD being more strongly related to vascular disease and future cognitive impairment (Alexopoulos, 2006).
In summary – as shown in the forest plot in figure 3, the initial GWAS revealed a SNP (rs1545843) on chr12q21.31 to be associated with MD with experiment-wide significance. This could be confirmed in a meta-analysis across 6 additional independent samples, including one sample of African American heritage, with the recessive model of rs1545843 reaching genome-wide significance.
Genomic context of the associated region on 12q21.31
The associated SNP lies within a region of SNPs in moderate LD that span a gene desert of about 450 kb in size on 12q21.31 mapping neither to any annotated gene nor to predicted human mRNAs with the exception of some small human expressed sequence tags (EST, fig. 1A and tab. S1). The closest RefSeq annotated gene is SLC6A15 (NM_182767) which ends 287 kb further distal to the region of association. It belongs to the solute carrier 6 (SLC6) gene family and codes for a sodium-dependent branched-chain amino acid transporter (Broer, 2006). SLC6A15 gene expression is highest in the human brain as well as the brain of other vertebrate species (UniGene, 2009). In rodents and humans, SLC6A15 expression has been shown to be restricted to neurons with strong expression in many brain regions including the hippocampus (Anonymous2009; Farmer et al., 2000; Masson et al., 1996). Other genes distal to SLC6A15 are TSPAN19, LRRIQ1 and ALX1 (fig. 1A). Their function is largely unknown and their expression levels are low in the vertebrate brain (Anonymous2009; UniGene, 2009). The nearest gene on the proximal side, transmembrane and tetratricopeptide repeat containing 2 gene (TMTC2, NM_152588) ends 989 kb from the region of association. It is expressed in a variety of tissues including the brain, but its function is also unknown. According to HapMap- and Perlegen (Myers et al., 2005) genotyping data, several hotspots of homologous recombination are predicted between the associated region and the flanking genes (fig. 1A), making it unlikely that the underlying functional variant might directly hit a classical promoter region or the open reading frame of a known gene. However, long-range regulatory effects have been described (van Heyningen et al., 2006). To address this issue, we analysed genome-wide gene expression data sets of human hippocampus and lymphoblastoid cell lines (Stranger et al., 2005).
Gene expression studies reveal SLC6A15 as putative candidate gene within the 12q21.31 locus
We analysed genome-wide Illumina expression array data on the locus associated with MD on 12q21.31 in a pre-mortem human hippocampus expression study from individuals with temporal lobe epilepsy of European descent and gene expression from EPV-transformed lymphoblastoid cell lines of the 210 unrelated HapMap individuals of different human populations (CEU, CHB, JPT, YRB)(Stranger et al., 2005). Previous studies reported that the median distance between SNPs and genes whose mRNA expression is significantly regulated by them is approximately 30 kb, ranging up to a maximum of 1 Mb (Myers et al., 2007). We therefore assessed all five RefSeq annotated genes within 1.5 Mb proximal and distal of rs1545843 on 12q21.31 (fig. 1A and tab. S1, TMTC2, SLC6A15, TSPAN19, LRRIQ1, ALX1). Expression levels of all seven available probes (3 for SLC6A15) were related to genotypes of two of the SNPs associated with MD which best tag the overall associated SNPs on 12q21.31 for European populations, rs1545843 and rs1031681 (tab. 1). We tested the allelic and both alternative recessive-dominant genetic models of rs1545843 and rs1031681 and each probe and applied Bonferroni correction for the number of performed statistical tests. Both SNPs showed association only with the hippocampal expression of the full-length mRNA isoform of SLC6A15 reaching experiment-wide significance under a recessive model of inheritance (AA vs. AG+GG: rs1545843: p=4.3e-04, corrected p=1.8e-02, and rs1031681: p=1.4e-04, corrected p=6.6e-03, N=137). Risk genotype carrier status was associated with less SLC6A15 transcript (fig. 4A and B). These associations were supported by data from lymphoblastoid cell lines from the HapMap individuals where expression of the full-length SLC6A15 transcript was lower in carriers of the depression risk genotypes (fig. S3) and in an expression data set from peripheral blood monocytes (Heinzen et al., 2008) but not in a frontal cortex expression study (Myers et al., 2007), likely due to the lower expression of this gene in this brain region. Thus, gene expression experiments, including hippocampus expression, point towards an effect of the associated locus on SCL6A15 expression via long-range regulatory mechanisms (van Heyningen et al., 2006).
Fig. 4.

SLC6A15 mRNA expression per rs1545843 genotype group measured in pre-mortem human hippocampus from individuals with temporal lobe epilepsy of European descent. (A) The MD risk genotype (AA) is associated with reduced full-length (FL, red boxes in part B) SLC6A15 mRNA expression levels compared to the non-risk genotypes (AG+GG). None of the other genes flanking the region of association with MD showed experiment-wide significant rs1545843 genotype-specific alterations in expression levels. SLC6A15 S: Short mRNA isoform of SLC6A15; (B) Box plot diagrams of FL (red) and S (blue) SLC6A15 mRNA expression levels in human hippocampus. On the x-axis the 3 genotype groups of rs1545843 are plotted against normalized SLC6A15 mRNA levels on the y-axis (group means: solid horizontal lines). Blue box-plots depict the expression levels of the short SLC6A15 isoform (S) and red plots expression levels of the full-length (FL) SLC6A15 transcript. For results of an analogues eQTL analysis in lymphoblastoid cell lines of HapMap individuals see supplemental fig. S3.
Presumed function of SLC6A15
SLC6A15 belongs to the solute carrier 6 (SLC6) gene family which also includes the monoamine and gamma-amino butyric acid (GABA) transporters and codes for a sodium-dependent branched-chain amino acid transporter (Broer, 2006). Experimental data from SLC6A15 knockout mice indicate a moderate contribution of SLC6A15 to total proline and leucine transport into cortical synaptosomes of about 15% (Dronova et al., 2007). Proline, the amino acid with the highest affinity for SLC6A15, and leucine may act as precursors for glutamate synthesis (Broer et al., 2006) and this transporter could thus be involved in the regulation of glutamate transmission (Tapiero et al., 2002).
Effects of risk genotypes on hippocampal volume and neurochemistry
Due to the expression profile of SLCA615 and its presumed role in neuronal amino acid transport and glutamate synthesis (Broer et al., 2006) and due to reported hippocampal volume changes in MD (Frodl et al., 2002; Videbech and Ravnkilde, 2004), we investigated both volumetric and 1H-NMR-spectroscopy (1H-NMR) markers of hippocampal integrity and signalling in subsamples of the Southern German discovery and replication samples (for sample see supplemental methods).
We confirmed bilateral hippocampal volume reductions in recurrent depression (F5,381>15.128, p<1.2e-04, N=204, tab. S2) and found a rs1545843 genotype diagnosis interaction effect on both left and right total hippocampal volumes (left: group: case- control, genotypes AA vs. AG/GG: F5,381=5.861, p=0.016, right: F5,381=5.686, p=0.018). Subregional analysis within the hippocampal formation revealed strongest effects for the bilateral cornu ammonis (CA) (left: group: case-control, genotypes AA vs. AG/GG: F5,381=9.512, p=0.002, pcorr<0.05, right: F5,381=5.686, p=0.011, N=204 cases and 186 controls, tab. S2). For rs1081681 which is highly correlated with rs1545843 in the MR morphology sample (r=0.819), diagnosis genotype interaction effects were even stronger with a similar emphasis on the left hemisphere and the CA region (fig. 5 and tab. S2). No genotype or diagnosis genotype effects were observed for either polymorphism for the dentate gyrus and the subiculum of the hippocampus and the control region (precentral gyrus). Hippocampal morphology is a heritable trait (h2=0.4) (Sullivan et al., 2001), nonetheless it is subject to stronger environmental influences compared to other brain regions (Glahn et al., 2007), and interactions between recurrent depression and specific genetic predispositions as indicated by our results may thus promote hippocampal atrophy, which has been repeatedly reported for MD (Videbech and Ravnkilde, 2004).
Fig. 5. NMR imaging: Genotype-by-diagnosis interaction effects on hippocampal volume.

(a) Based on cytoarchitectonic probability maps, automated volumetry of grey matter (GM) of the total hippocampus (cornu ammonis, subiculum and dentate gyrus) and respective subregions was performed in 390 subjects after optimized segmentation and coregistration. The resulting maximum probability maps projected on a standard brain template in atlas space are shown. (b) Results of the left total hippocampal GM: Bars show adjusted mean values and one standard error of the mean for the main effect of diagnosis and the rs1545843 genotype (AA vs. AG/GG) × diagnosis interaction effect. Lowest mean volumes were seen for patients with the AA genotype. (c) Corresponding depiction for the left cornu ammonis (* nominal p<0.05, ** Bonferroni corrected p<0.05.). Results of other subregions and of right hemisphere are reported in tab. S2.
These analyses were complemented by analyzing 1H-NMR markers of hippocampal integrity, including N-acetyl aspartate (NAA). While NAA serves mainly as marker of neuronal viability, it is also regarded as reservoir for glutamate (Benarroch, 2008). To investigate genotype effects of left hippocampal neurochemistry we focused on healthy, non-medicated control subjects (N=81) as mood state and medication might influence hippocampal neurochemistry. Multivariate analysis detected a significant genotype effect of rs1031681 on hippocampal metabolites (Wilks’ lambda: 0.683, F2,75=2.976, p=0.002) with univariate comparisons pointing towards NAA (F2,75=6.143, p=0.003, pcorr<0.05). More specifically, A-risk-allele-carriers of rs1031681 showed lower levels of hippocampal NAA and glutamate/glutamine (Glx) indicating impaired neuronal integrity and Glx signalling already in healthy carriers (NAA: F1,76=5.575, p=0.021; Glx: F1,76=5.752, p=0.019; Cr: F1,76=4.009, p=0.049, fig. S4b). For NAA, a similar effect was detected for A-carriers of rs1545843 (F2,75=5.333, p=0.024).
The imaging data thus suggest that risk allele-carrier status is associated with a decrease in hippocampal neuronal integrity already in healthy controls, and that patients with recurrent major depression and the risk genotype experience an exacerbated reduction in hippocampal volume.
Evidence for a role of SLC6A15 in stress vulnerability
Epidemiological studies on MD report a 2–3 fold risk increase for individuals exposed to chronic stress (Wang, 2005) and twin studies clearly point to an increased susceptibility for MD as a result of a combination of environmental and genetic risk factors (Kendler et al., 2002). To further validate a role for SLC6A15 in MD, we used microarray gene-expression data from the hippocampus of mice subjected to chronic stress according to a recently developed and extensively validated mouse paradigm of chronic social stress in which susceptible animals show behavioural, endocrine as well as molecular changes reminiscent of a depression like phenotype (Schmidt et al., 2007; Schmidt et al., 2009) (fig. S5). We selected the 6 most susceptible and the 6 most resilient individuals from a formerly stressed group of 120 mice. Pooled mRNA samples of laser-assisted microdissections from the CA subregion 1 (CA1) of the hippocampus from both experimental groups (supplemental methods) were analysed on genome-wide Illumina BeadChips. Expression data for the probes specific for the genes in the associated region, TMTC2, SLC6A15, LRRIQ1 and ALX1 were compared between the two groups. SLC6A15 mRNA levels were reduced 1.9-fold in the CA1 region in stress susceptible versus stress resilient mice. Expression levels of the other genes did not exceed background noise in the CA1 region, and are thus likely not expressed at higher levels in this brain region (tab. S3). This further supports SLC6A15 as the gene of interest within this locus. The reduction of SLC6A15 expression in CA1 could be validated by in situ hybridisation in 9 stress susceptible versus 9 stress resilient mice (fig. 6A and 6B). Moreover, a significant reduction in SLC6A15 expression could also be observed in the dentate gyrus of stress susceptible animals (fig. 6C and 6D). The demonstrated downregulation of SLC6A15 expression in stress-susceptible mice, most prominent in the CA1 region of the hippocampus, suggests SLC6A15 to play a role in long-term effects of chronic stress on neuronal circuits and is in accordance with the human MD risk genotype-dependent effects assayed by in vivo volumetry which were also strongest in the CA subregion of the hippocampus.
Fig. 6. Reduced hippocampal SLC6A15 mRNA expression in stress susceptible mice.

(A) The significant reduction in SLC6A15 mRNA levels in the CA1 hippocampal region between stress resilient (R) and susceptible (S) mice detected by microarray analysis could be confirmed by in situ hybridisation (N=9/9, −2.1-fold reduction). (B) Two representative autoradiographs of hippocampal slices from one animal per group are shown. (C,D) SLC6A15 mRNA was also significantly reduced in the dentate gyrus (DG, −1.5-fold) and by trend reduced in the visual cortex (Cx, −1.7-fold). + P<0.06; **P<0.01; ***P<0.001. See also fig. S5 for description of the mouse model and tab. S3 for microarray results.
DISCUSSION
We performed a GWA study, with replication of the top hit and genome-wide significant association in the meta-analysis across a total of 4088 patients and 11001 controls, including one sample from a different ethnic background. Together with gene expression data, neuroimaging correlates and evidence from a mouse model of chronic stress our results point towards SLC6A15, a neuronal amino acid transporter, as a novel candidate gene in the pathophysiology of major depression.
Even though the direction of the association of rs1545843 with depression and depressive symptoms was the same in all samples with non-geriatric depression, the effect sizes were heterogeneous, with a much larger effect in the discovery sample (OR=2.8 for the recessive model) as compared to the other samples with odds ratios ranging from 1.18 to 1.61. The strong association and low p-value in the discovery sample is probably due to the “winners’ curse”, but this phenomenon has also been observed for other, now established, disease loci. For example, the association of a SNP in the FGFR2 gene with breast cancer was much stronger in the rather small discovery sample than in any of the subsequent replication samples. However, the direction of the association was consistent and reached a p-value of 2e-76 in close to 30,000 cases and controls (Easton et al., 2007). This indicates that heterogeneous effect sizes with overestimation of the effect in a small discovery sample may still be in agreement with a true signal. In addition to the genome-wide significance (Dudbridge and Gusnanto, 2008) observed in our study, replication of the effect in samples of different ethnicities, European and African American, might be a further indicator for a true effect.
In addition to replication in independent samples, the functional relevance of the associated locus is supported by results of gene expression analyses in pre-mortem human hippocampus and EBV-transformed lymphoblastoid cell lines of the HapMap individuals (Stranger et al., 2005) and peripheral blood monocytes (Heinzen et al., 2008). While there is a strong indication of the regulatory relevance of the region associated with MD for SLC6A15 expression, we cannot exclude that these variants might also influence the expression of six unspliced brain ESTs and four spliced ESTs of other than brain tissue which have been mapped to the region of association, since they were not probed by the used Illumina chip (fig. 1A and supplementary text, tab. S1). Additional non-annotated transcripts, as described in the ENCODE pilot project in regions of the genome previously thought to be transcriptionally silent (Birney et al., 2007) might also be functionally relevant for this association.
The imaging genomics results provide evidence that the associated SNPs and related functional effects on SLC6A15 expression might be of relevance for the integrity of brain neurocircuits shown to be important in MD (Frodl et al., 2002). We found lower total hippocampal volumes, particularly of the cornu ammonis, in risk genotype carriers of the patient- but not the control group, indicating a higher vulnerability to the well-documented effects of recurrent depressive episodes on hippocampal volume (Frodl et al., 2002; Videbech and Ravnkilde, 2004). Further support for the detrimental effects of the risk allele on neuronal integrity in this brain region came from 1H-NMR spectroscopy. We noted that healthy risk allele carriers exhibited lower hippocampal NAA compared to non-risk allele carriers. Reduced hippocampal NAA has been reported for different psychiatric disorders and was also decreased in currently depressed unipolar patients in this study (fig. S4b). In animal models, hippocampal NAA can be decreased by chronic stress (Czeh et al., 2001; Li et al., 2008). Thus, a genetic predisposition towards lower hippocampal NAA, similar to a condition induced by chronic stress experiments, may impair an individual’s resilience to stress which is a risk factor for MD (Wang, 2005).
While the genetic association data pointed most strongly to rs1545843, gene expression and imaging data association were strong with both tag-SNPs of the locus, rs1545843 and rs1031681. In healthy subjects, genotype effects on hippocampal neurochemistry were more prominent for rs1031681 compared with rs1545843, both in terms of effects on NAA and Glx and in terms of robustness towards multiple test correction. This is an indication that both SNPs tag the likely underlying functional variants that still remains to be identified. To this aim deep-sequencing analyses are currently underway.
Together with the demonstrated downregulation of SLC6A15 expression in stress-susceptible mice, human gene expression and imaging data support a role for hippocampal SLC6A15 function in stress sensitivity and the pathophysiology of MD. This would be in line with a proposed role of the SLC6A15 transporters in neuronal metabolism and the provision of substrates for neurotransmitters, and specifically glutamate synthesis (Broer et al., 2006). Thus, decreased hippocampal NAA and by extension glutamate neurotransmission (Benarroch, 2008), related to genetic factors, may limit excitatory signalling capacity with secondary effects on stress response regulation and hippocampal function in general (Herman et al., 2003).
In conclusion, the above presented results from human genetics, gene expression, volumetric imaging, spectroscopy, and a mouse model of chronic stress all support the notion that lower SLC6A15 expression, especially in the hippocampus, could increase an individual’s stress susceptibility by altering neuronal integrity and excitatory neurotransmission in this brain region. Recently, the prokaryotic leucine transporter homologue (LeuTaa) of SLC6A15 has been crystallized from Aquifex aeolicus and was shown to bind tricyclic antidepressant drugs that can directly block leucine transport by closing the molecular gate for the substrate in a non-competitive manner (Zhou et al., 2007). Due to the high degree of phylogenetic conservation of the antidepressant binding site, these drugs probably also bind to the human transporter. Because SLC6A15 appears amenable to drug targeting, our results may incite the discovery of a novel class of antidepressant drugs.
EXPERIMENTAL PROCEDURES
MARS (GWAS) sample
353 unipolar depressive inpatients (155 males, 198 females) were recruited for the Munich Antidepressant Response Signature (MARS) project (Hennings et al., 2009; Ising et al., 2009) at the Max Planck Institute of Psychiatry (MPIP) in Munich, Germany. The mean age (±SD) was 49.5 ± 14.3 (males: 48.4 ± 13.4, females: 50.4 ± 15.0) years. Please see Hennings et al. and Ising et al. for more details on patient recruitment (Hennings et al., 2009; Ising et al., 2009). Briefly, patients were included in the study within 1–3 days of admission to the hospital and diagnosis was ascertained according to the Diagnostic and Statistical Manual of Mental Disorders (DSM) IV criteria. Patients fulfilling the criteria for at least a moderate depressive episode (HAM-D ≥ 14 on the 21-item Hamilton Depression Rating Scale) entered the analysis. Patients suffered from a first depressive episode (36.8 %) or from recurrent depressive disorder (63.2 %). All included patients were of European descent and 88.7% were of German origin. 366 control subjects were matched to the patient sample for age, gender and ethnicity from a randomly selected Munich-based community sample and underwent a strict screening-procedure for the absence of psychiatric and severe somatic disease (Heck et al., 2009). The overall inclusion rate of all contacted probands was 50.3 %. These subjects thus represent a group of individuals from the general population who have never been mentally ill. Age, gender and ethnicity did not differ from the patient sample. This study has been approved by the ethics committee of the Ludwig-Maximilians-University (LMU) in Munich and written informed consent was obtained from all subjects.
The Southern German Recurrent Depression Replication sample included 920 patients (302 males, 618 females) suffering from recurrent major depression (Lucae et al., 2006; Muglia et al., 2008) as well as 1024 controls matched to the patient sample for age, gender and ethnicity.
The MARS replication sample included an additional 300 unipolar depressed patients and 236 controls, recruited according to the same protocol as the MARS discovery sample but not genotyped on the initial Illumina platforms.
The Bonn replication sample included patients with a DSM-IV diagnosis of major depression who were recruited from consecutive admissions to the Department of Psychiatry of the University of Bonn, Germany as described in (Rietschel et al., 2010). Of the 604 individuals described in this publication, only the 292 without a family history of an axis I disorder other than major depression were used in this analysis. Population-based controls were recruited as described in (Rietschel et al., 2010).
The Erasmus Rucphen Family study subsample included 1160 participants from the Erasmus Rucphen Family (ERF) study, part of the Genetic Research in Isolated Population (GRIP) program (Aulchenko et al., 2004). The Center for Epidemiologic Studies Depression Rating Scale (CES-D) (Radloff, 1977; Zigmond and Snaith, 1983) (Spinhoven et al., 1997; Weissman et al., 1977) was used to define depression using a cut-off of CES-D ≥ 16 as indicative of a depressive disorder (Luijendijk et al., 2008).
The African-American replication sample included 972 African-Americans (356 males, 616 females) all screened with the Beck Depression Inventory (BDI) (Beck et al., 1961; Viinamaki et al., 2004)(Viinamaki et al., 2004). Study design, ascertainment and rating protocols have been described elsewhere in more detail (Binder et al., 2008). A BDI score of 16 or greater was considered indicative of current depression.
The Rotterdam study subsample included 7983 from the Rotterdam Study, a prospective cohort study from 1990 conducted in the Netherlands. All inhabitants aged 55 and over were eligible (Hofman et al., 2007). Depression was ascertained using the CES-D, a semi-structured interview with the Present State Examination (PSE) by a clinician as well as GP-records and specialist letters.
The U.K. replication sample (RADIANT) included 1636 patients with a diagnosis of recurrent major depression (except for 20 with first episode) recruited within the Depression Case Control (DeCC) study, the Depression Network (DeNET) affected siblings linkage study and the Genome-Based Therapeutics in Depression (GENDEP) study (Lewis et al., 2010b). The matched screened controls described in Lewis et al,. 2010 (N = 1594) and the publicly available controls from the Wellcome Trust Case Control Consortium 2 (N = 5652) were used for this analysis.
A more detailed description of the study samples can be found in the supplemental methods.
SNP genotyping
Genome-wide SNP genotyping for the MARS discovery sample was performed on Sentrix Human-1 (100k) and HumanHap300 (317k) Genotyping BeadChips (Illumina Inc., San Diego, USA) according to the manufacturer’s standard protocols. On the Illumina Human-1 Genotyping BeadChip about 109,000 exon-centric SNPs can be interrogated. Nearly 25,000 of the loci are located in transcripts and more than 73,000 loci are within 10kb of coding sequences. The Illumina HumanHap300 Genotyping BeadChip comprises about 317,000 SNPs. The average call rate achieved was higher than 99%, with samples below 98% being either retyped or excluded from the study. Genotyping of the German replication samples (except MARS replication) and the African American replication sample was performed on a MALDI-TOF mass-spectrometer (MassArray® system, Sequenom Inc., San Diego, USA) employing the manufacturer’s AssayDesigner software for primer selection, multiplexing and assay design, and the homogeneous mass-extension (hMe) process for producing primer extension products. MALDI-TOF SNP genotyping was performed at the Genome Analysis Center (GAC) facility of the Helmholtz Zentrum Munich, Germany. All primer sequences used are available upon request. The individual-wise mean call rate over all plates and these SNPs was above 98%. Genotypes of all SNPs were in HWE (p<0.05). To exclude genotyping errors in the German studies, we re-genotyped the two tagging SNPs (rs1545843 and rs1031681) in more than 95% and 80% of individuals in the MARS discovery GWAS and the German recurrent depressive replication sample, respectively using the MALDI-TOF platform. We obtained a genotype concordance rate with the genotypes produced by the Illumina assays of >99.9%. In the U.K. studies, all subjects had been genotyped on the Illumina 610k-Quad Beadchips. In the ERF study 1000 individuals were genotyped with Illumina 300k, 100 individuals with Illumina 370k arrays and 200 individulas with the Affymetrix 250k array. The Rotterdam study samples were genotyped by using the Illumina 550k arrays and the additional MARS samples using the Illumina 610k array.
Imputation of genotypes from ERF and Rotterdam study was performed using Maximum Likelihood Method as implemented in the MACH software v 1.0.16. Release 22 HAPMAP CEU population was used as reference. This effort yielded a total of 2,500,000 SNPs. Only SNPs with call rates > 98%, MAF>1% and HWE P-values > 1e-06 were used for imputations. Mean r2 after imputations was 0.97 for the 19 SNPs tested within the 450 kb region on 12q21.31. For the MARS replication sample, the genotypes of rs1031681 were imputed using Impute v2.1.0 and the HapMap CEU as a reference population. rs1545843 failed QC in the controls of the UK sample with call rates < 98% and a p-value for differential missingness < 1e-08. Its genotypes were therefore imputed in both cases and controls using BEAGLE 3.1(Browning and Browning, 2009) on HapMap 3.
Power calculation
Power calculations were performed using the Genetic Power Calculator (Purcell et al., 2003) (http://pngu.mgh.harvard.edu/~purcell/gpc). Given a prevalence of unipolar depression of 16% (Kessler et al., 2003), a marker in LD (D′=1) with a risk allele R and an alternative protective allele N under an allelic log-additive, dominant or recessive model and 80% power in our discovery genome-wide study at a significance level −7 (=0.05/365,676 SNPs ), we would be able to detect an effect with an OR of 2.2 or larger.
Genomic controls
Genomic controls (Devlin et al., 2001) for the case-control phenotype were calculated with R-2.5.0 (http://cran.r-project.org) on a genome-wide level in the MARS GWAS sample. In addition, population stratification was tested with EIGENSTRAT implemented in EIGENSOFT (Price et al., 2006) (http://genepath.med.harvard.edu/~reich/EIGENSTRAT.htm). Neither the genomic control method (λ =1.023, see fig. S1) nor EIGENSTRAT analysis gave any indication for population stratification.
Linkage disequilibrium
The linkage disequilibrium (LD) pattern and haplotype block delineation were determined by applying Haploview 4.0 (http://www.broad.mit.edu/mpg/haploview) (Barrett et al., 2005). Blocks were defined using the confidence interval method described by Gabriel et al. (Gabriel et al., 2002). Pairwise LD measures (r2 and D′) were calculated in the 366 healthy controls of the GWAS sample and in 284 controls of the African-American sample for the eight most associated SNPs on chr12.21.31 (see fig. 2). German controls were also compared to the HapMap CEU population (CEPH sample consisting of Utah residents with ancestry from northern and western Europe, N=60, http://www.hapmap.org) (Frazer et al., 2007). No deviation in LD could be observed in this comparison (data not shown).
Association testing
Genome-wide case-control analyses were conducted by applying the WG-Permer software (http://www.mpipsykl.mpg.de/wg-permer/). For post-hoc analyses, applications in R-2.5.0 (http://cran.r-project.org) and SPSS for Windows (Releases 16, SPSS Inc., Chicago, Illinois 60606, USA) were used. SNPs with genotype distributions deviating from HWE at a significance level of 10−5 or 0.05 with a call rate below 98% or 95% in the GWAS or German replication sample, respectively, and SNPs with a MAF below 5% were excluded from statistical analysis. Autosomal SNPs were tested for association with unipolar depressive disorder in a case-control design using Chi-square test statistics under allelic and both alternative recessive-dominant modes of inheritance. The level of significance was set to 5% (family-wise error rate). Nominal p-values were corrected for multiple comparisons by the permutation-based minimum p method proposed by Westfall and Young (Westfall and Young, 1993; Westfall et al., 2001) under 104 permutations over the 3 performed genetic models and all SNPs tested per study. Empirical and nominal p-values for all reported associations did not deviate from each other. Moreover, sample demographic statistics and post-hoc tests on age, gender and German origin, life events, recurrence of MD, age at onset, number of previous depressive episodes, first degree family history of MD and life time attempted suicide status were performed by logistic regression analysis and ANCOVA. P-values including these covariates did not differ from those of the Chi square test statistics for all reported associations. Thus, none of these additional covariates showed a significant effect on the reported associations. In the RADIANT study from the UK, sex was coded as a factorial covariate for the analysis presented in the main text. The validity of the p-values and the distribution of the estimates were verified using Monte-Carlo (permutation and bootstrap) methods. Below we give the odds ratios (OR) without sex as a factorial covariate and the ORs in a gender stratified analysis: OR of all RADIANT cases and RADIANT plus WTCCC2 controls, sex not included as covariate: 1.082 (95% C.I. 0.951; 1.231), n = 1636 cases and 7261 controls with a p = 0.274. OR of only male cases and male controls: 1.344 (95% C.I. 1.080; 1.672), n = 485 cases and 3465 controls with a p = 0.00797. OR of only female cases and female controls: 0.959 (95% C.I. 0.816; 1.127), n = 1151 cases, 3781 controls with a p = 0.615.
Meta-analysis
Meta-analyses were conducted using the R library rmeta applying a fixed effect model. In the first meta-analysis, three genetic models were tested, the two opposite carrier models and an allelic model resulting in a number of 2.02 effective tests as estimated from 10,000 permutations. In the second meta-analysis (combining the results of the first meta-analysis with the data from the RADIANT/WTCCC2 sample) only the recessive model for rs1545843 was tested. The adjustment for the two tests performed in RADIANT/WTCCC2 was done by adjusting the standard error of the estimate accordingly.
Genotype-specific mRNA levels (eQTLs)
We used two independent genome-wide SNP/ mRNA expression data sets for SNP-eQTL analyses on 12q21.31. The first data set was from pre-mortem human hippocampus of 137 individuals involved in the Epilepsy Surgery Program at Bonn University, Germany. Methods related to the hippocampal eQTL experiment are detailed in the supplemental method section The second was the publicly available GENEVAR - GENe Expression VARiation–data set of EPV-transformed lymphocytes from the 210 unrelated HapMap individuals (http://www.sanger.ac.uk/humgen/genevar/) (Stranger et al., 2005; Stranger et al., 2007). Experimental design and statistical analysis: In both data sets, we selected all RefSeq annotated genes (Pruitt et al., 2005) located within 1.5 megabase on both sides of the genome-wide significant SNP of the GWAS (rs1545843, total sequence of 3 Mb). The five following genes intersect with the defined genomic region (hybridisation probes in brackets, see also tab. S1): TMTC2 (GI_22749210-S), SLC6A15 (GI_33354280-A, GI_21361692-I, GI_33354280-I), TSPAN19 (GI_37541880-S), LRRIQ1 (hmm2373-S) and ALX1 (GI_5901917-S). For the GENEVAR data set a residual expression variable for each probe was built by regression analysis to correct for ethnicity. We tested an allelic and both alternative recessive-dominant genetic models for rs1545843 and rs1031681 for each of the probes (N=7) by performing ANOVA under 106 permutations using the WG-Permer software (http://www.mpipsykl.mpg.de/wg-permer). P-values were corrected for multiple comparisons by the Bonferroni procedure. Subsequently, we repeated this analysis by including data of all available non-RefSeq (EST) gene probes (N=+6: Hs.365699-S, Hs.506230-S, GI_41149683-S, Hs.208111-S, GI_41149726-S, hmm21473-S, tab. S1) for ESTs from GenBank in the same genomic window. Data of four ESTs were excluded from the analysis, because their probes did not map completely or uniquely to any target EST sequence of the current GenBank database (GI_37541937-S, hmm21470-S, GI_37541941-S, hmm21472-S). Target sequences of all probes included in expression analyses mapped uniquely and completely to the human genome and are all devoid of known common variations denominated by dbSNP build 129.
Regional volumetry
Structural MRI sample acquisition and quality control: Structural MRI with high resolution T1-weighted images adequate for morphometry was available for 204 patients with recurrent unipolar depression and 186 control subjects. MRI was acquired at the MPI of Psychiatry in the context of the acquisition of the Munich recurrent unipolar depression replication samples. A detailed description of study participant selection and image processing is available in the supplemental method section. Automated regional volumetry: In brief, image preprocessing was performed as for voxel based morphometry to gain grey matter (GM) maps with preserved local volume in stereotactic space. Histologically validated cytoarchitectonic probability maps (Amunts et al., 2005) were used to create regional volumetry masks for the left and right hippocampus and subregions cornu ammonis (CA: CA1–3), subiculum (SUB) and dentate gyrus (DG). The sum of all modulated GM voxels within the regional masks was calculated using in-house software programmed in IDL (http://www.creaso.com). Statistical analysis: Analysis of covariance (ANCOVA) was performed for left and right total hippocampal GM volume and each three subregions with two-level factors group (patients, controls), genotype (rs1545843 AA vs. AG/GG, equally for rs1081681), and gender, covarying for age, squared age, total GM volume and sequence type. Levene’s tests for equality of error variances was explored and found non-significant for all tests (fig. S4). P-values were compared with a Bonferroni-corrected threshold to adjust for 18 tests (2 SNPs, 9 volumetric measurements [including motor cortex as control region]: 0.05/18=0.0028). Both nominal and corrected p-values are indicated in fig. 5 and tab. S2.
Methods for 1H-NMR-spectroscopy are discussed in the supplemental method section.
Animal housing
Male CD1 mice were used for all experiments. Animals were 28 days old at the day of arrival and were kept on a 12L:12D cycle. Food and water was provided ad libitum. The experiments were carried out in accordance with European Communities Council Directive 86/609/EEC. All efforts were made to minimize animal suffering during the experiments. The protocols were approved by the committee for the Care and Use of Laboratory Animals of the Government of Upper Bavaria, Germany.
Chronic stress paradigm
The chronic social stress procedure was performed as described previously (Schmidt et al., 2007; Sterlemann et al., 2008) (see fig. S5 and supplemental methods). In this paradigm, mice are exposed to a highly unstable social and hierarchical situation during their adolescence and early adulthood. After the seven weeks stress procedure all animals were single housed for 5 weeks and then sacrificed under basal conditions.
Tissue dissection and expression profiling
Frozen brains were sectioned at the level of the dorsal hippocampus and the subregions CA1 and dentate gyrus were laser-microdissected using a laser capture microscope (P.A.L.M. Microlaser Technologies, Bernried, Germany). Extracted RNA was quality checked on the Agilent 2100 Bioanalyser, subjected to two rounds of linear amplification and hybridised to Illumina MouseRef-8 v1.0 Expression BeadChips according to the manufacturer’s protocol (see also supplemental methods). The data discussed in this publication have been deposited in NCBIs Gene Expression Omnibus (GEO, http://www.ncbi.nlm.nih.gov/geo/) and are accessible through GEO Series accession number GSE112211.
Gene expression analysis in stress susceptible versus stress resilient mice
We chose the same procedure to select genes adjacent to the region of association for validation in the described mouse experiment as we applied in the human expression analysis. Expression differences were checked for SLC6A15 (NM_175328.1; scl0003791.1), TMTC2 (NM_025775.1; scl066807.1_5-S), ALX1 (NM_009423.2; scl022032.1) and LRRIQ1 (XM_137221.4). Differentially expressed genes were validated by in-situ hybridisation as described previously (Schmidt et al., 2007). The antisense cRNA hybridisation probe of SLC6A15 was 487 base pairs long (left primer: TGCCGTGAGCTTTGTTTATG; right primer: CAGTGTTGGGGAACCACTTT covering exons 11 to 13 of the gene. The slides were exposed to Kodak Biomax MR films (Eastman Kodak Co., Rochester, NY) and developed. Autoradiographs were digitised and relative expression was determined by computer-assisted optical densitometry (Scion Image, Scion Corporation). The software package SPSS version 16 was used for statistical analysis. Group comparisons were performed using the two-tailed paired t-test to determine statistical significance (*P<0.05; **P<0.01; ***P<0.001). Data are presented as mean ± s.e.m.
Supplementary Material
Acknowledgments
This work has been funded by the Excellence Foundation for the Advancement of the Max Planck Society, the Bavarian Ministry of Commerce and the Federal Ministry of Education and Research (BMBF) in the framework of the National Genome Research Network (NGFN2 and NGFN-Plus, FKZ 01GS0481). The Dutch studies are supported by the Netherlands Organization of Scientific Research (NWO Investments #175.010.2005.011, 911- 03-012), the Netherlands Genomics Initiative (NGI)/Netherlands Organization for Scientific Research (NWO project #050-060-810), the Hersenstichting and the Centre for Medical Systems Biololgy (CMSB). The Atlanta cohort was sponsored by RO1 MH071537-01A1. The RADIANT study was supported by the UK MRC (G0701420). This study makes use of data generated by the Wellcome Trust Case-Control Consortium 2 (for author contributions see: www.wtccc.org.uk). Funding for the project was provided by the Wellcome Trust under award 085475.
This study was also supported by NeuroNova (a nonprofit Company for advancement of Genomics). The authors would like to thank G. Ernst-Jansen, G. Gajewsky, J. Huber, E. Kappelmann, S. Sauer, S. Damast, M. Koedel, M. Asmus, A. Sangl and H. Pfister for their excellent technical support. We further are grateful to R. Hemauer, R. Borschke and E. Schreiter for excellent MRI data aquisition. We acknowledge the work of Yurii S Aulchenko, A Cecile JW Janssens, Maksim Struchalin and Ben A Oostra for the ERF study.
Footnotes
Supplemental information is linked to the online version of the paper available on the Neuron website and contains supplemental figures (S1-S5) and tables (S1–S3), experimental procedures and references.
Author Information The mouse model data discussed in this publication have been deposited in NCBI’s Gene Expression Omnibus (GEO, http://www.ncbi.nlm.nih.gov/geo/) and are accessible through GEO Series accession number GSE112211.
Publisher's Disclaimer: This is a PDF file of an unedited manuscript that has been accepted for publication. As a service to our customers we are providing this early version of the manuscript. The manuscript will undergo copyediting, typesetting, and review of the resulting proof before it is published in its final citable form. Please note that during the production process errors may be discovered which could affect the content, and all legal disclaimers that apply to the journal pertain.
References
- Allen Brain Atlas. Seattle (WA): Allen Institute for Brain Science; © 2008 Available from: http://www.brain-map.org. [Google Scholar]
- Alexopoulos GS. The vascular depression hypothesis: 10 years later. Biol Psychiatry. 2006;60:1304–1305. doi: 10.1016/j.biopsych.2006.09.006. [DOI] [PubMed] [Google Scholar]
- Amunts K, Kedo O, Kindler M, Pieperhoff P, Mohlberg H, Shah NJ, Habel U, Schneider F, Zilles K. Cytoarchitectonic mapping of the human amygdala, hippocampal region and entorhinal cortex: intersubject variability and probability maps. Anatomy And Embryology. 2005;210:343–352. doi: 10.1007/s00429-005-0025-5. [DOI] [PubMed] [Google Scholar]
- Aulchenko YS, Heutink P, Mackay I, Bertoli-Avella AM, Pullen J, Vaessen N, Rademaker TA, Sandkuijl LA, Cardon L, Oostra B, van Duijn CM. Linkage disequilibrium in young genetically isolated Dutch population. Eur J Hum Genet. 2004;12:527–534. doi: 10.1038/sj.ejhg.5201188. [DOI] [PubMed] [Google Scholar]
- Barrett JC, Fry B, Maller J, Daly MJ. Haploview: analysis and visualization of LD and haplotype maps. Bioinformatics. 2005;21:263–265. doi: 10.1093/bioinformatics/bth457. [DOI] [PubMed] [Google Scholar]
- Beck AT, Erbaugh J, Ward CH, Mock J, Mendelsohn M. An Inventory For Measuring Depression. Archives Of General Psychiatry. 1961;4:561. doi: 10.1001/archpsyc.1961.01710120031004. [DOI] [PubMed] [Google Scholar]
- Benarroch EE. N-Acetylaspartate and N-acetylaspartylglutamate - Neurobiology and clinical significance. Neurology. 2008;70:1353–1357. doi: 10.1212/01.wnl.0000311267.63292.6c. [DOI] [PubMed] [Google Scholar]
- Binder EB, Bradley RG, Liu W, Epstein MP, Deveau TC, Mercer KB, Tang Y, Gillespie CF, Heim CM, Nemeroff CB, et al. Association of FKBP5 polymorphisms and childhood abuse with risk of posttraumatic stress disorder symptoms in adults. JAMA. 2008;299:1291–1305. doi: 10.1001/jama.299.11.1291. [DOI] [PMC free article] [PubMed] [Google Scholar]
- Birney E, Stamatoyannopoulos JA, Dutta A, Guigo R, Gingeras TR, Margulies EH, Weng ZP, Snyder M, Dermitzakis ET, Stamatoyannopoulos JA, et al. Identification and analysis of functional elements in 1% of the human genome by the ENCODE pilot project. Nature. 2007;447:799–816. doi: 10.1038/nature05874. [DOI] [PMC free article] [PubMed] [Google Scholar]
- Bostwick JM, Pankratz VS. Affective disorders and suicide risk: A reexamination. American Journal Of Psychiatry. 2000;157:1925–1932. doi: 10.1176/appi.ajp.157.12.1925. [DOI] [PubMed] [Google Scholar]
- Broer A, Tietze N, Kowalczuk S, Chubb S, Munzinger M, Bak LK, Broer S. The orphan transporter v7–3 (slc6a15) is a Na+-dependent neutral amino acid transporter (B(0)AT2) Biochemical Journal. 2006;393:421–430. doi: 10.1042/BJ20051273. [DOI] [PMC free article] [PubMed] [Google Scholar]
- Broer S. The SLC6 orphans are forming a family of amino acid transporters. Neurochemistry International. 2006;48:559–567. doi: 10.1016/j.neuint.2005.11.021. [DOI] [PubMed] [Google Scholar]
- Browning BL, Browning SR. A unified approach to genotype imputation and haplotype-phase inference for large data sets of trios and unrelated individuals. Am J Hum Genet. 2009;84:210–223. doi: 10.1016/j.ajhg.2009.01.005. [DOI] [PMC free article] [PubMed] [Google Scholar]
- Choy WC, Lopez-Leon S, Aulchenko YS, Mackenbach JP, Oostra BA, van Duijn CM, Janssens AC. Role of shared genetic and environmental factors in symptoms of depression and body composition. Psychiatr Genet. 2009;19:32–38. doi: 10.1097/YPG.0b013e328320804e. [DOI] [PubMed] [Google Scholar]
- Czeh B, Michaelis T, Watanabe T, Frahm J, de Biurrun G, van Kampen M, Bartolomucci A, Fuchs E. Stress-induced changes in cerebral metabolites, hippocampal volume, and cell proliferation are prevented by antidepressant treatment with tianeptine. Proceedings Of The National Academy Of Sciences Of The United States Of America. 2001;98:12796–12801. doi: 10.1073/pnas.211427898. [DOI] [PMC free article] [PubMed] [Google Scholar]
- Devlin B, Roeder K, Wasserman L. Genomic control, a new approach to genetic-based association studies. Theoretical Population Biology. 2001;60:155–166. doi: 10.1006/tpbi.2001.1542. [DOI] [PubMed] [Google Scholar]
- Dronova J, Liu QR, Hall FS, Krieger RM, Uhl GR. Deletion of v7–3 (SLC6A15) transporter allows assessment of its roles in synaptosomal proline uptake, leucine uptake and behaviors. Brain Research. 2007;1183:10–20. doi: 10.1016/j.brainres.2007.09.001. [DOI] [PMC free article] [PubMed] [Google Scholar]
- Dudbridge F, Gusnanto A. Estimation of significance thresholds for genomewide association scans. Genetic Epidemiology. 2008;32:227–234. doi: 10.1002/gepi.20297. [DOI] [PMC free article] [PubMed] [Google Scholar]
- Easton DF, Pooley KA, Dunning AM, Pharoah PD, Thompson D, Ballinger DG, Struewing JP, Morrison J, Field H, Luben R, et al. Genome-wide association study identifies novel breast cancer susceptibility loci. Nature. 2007;447:1087–1093. doi: 10.1038/nature05887. [DOI] [PMC free article] [PubMed] [Google Scholar]
- Ebmeier KP, Donaghey C, Steele JD. Recent developments and current controversies in depression. Lancet. 2006;367:153–167. doi: 10.1016/S0140-6736(06)67964-6. [DOI] [PubMed] [Google Scholar]
- Farmer MK, Robbins MJ, Medhurst AD, Campbell DA, Ellington K, Duckworth M, Brown AM, Middlemiss DN, Price GW, Pangalos MN. Cloning and characterization of human NTT5 and v7–3: Two orphan transporters of the Na+/Cl--dependent neurotransmitter transporter gene family. Genomics. 2000;70:241–252. doi: 10.1006/geno.2000.6387. [DOI] [PubMed] [Google Scholar]
- Fava M, Rush AJ. Current status of augmentation and combination treatments for major depressive disorder: A literature review and a proposal for a novel approach to improve practice. Psychotherapy And Psychosomatics. 2006;75:139–153. doi: 10.1159/000091771. [DOI] [PubMed] [Google Scholar]
- Frazer KA, Ballinger DG, Cox DR, Hinds DA, Stuve LL, Gibbs RA, Belmont JW, Boudreau A, Hardenbol P, Leal SM, et al. A second generation human haplotype map of over 3.1 million SNPs. Nature. 2007;449:851–U3. doi: 10.1038/nature06258. [DOI] [PMC free article] [PubMed] [Google Scholar]
- Frodl T, Meisenzahl EM, Zetzsche T, Born C, Groll C, Jager M, Leinsinger G, Bottlender R, Hahn K, Moller HJ. Hippocampal changes in patients with a first episode of major depression. American Journal Of Psychiatry. 2002;159:1112–1118. doi: 10.1176/appi.ajp.159.7.1112. [DOI] [PubMed] [Google Scholar]
- Gabriel SB, Schaffner SF, Nguyen H, Moore JM, Roy J, Blumenstiel B, Higgins J, DeFelice M, Lochner A, Faggart M, et al. The structure of haplotype blocks in the human genome. Science. 2002;296:2225–2229. doi: 10.1126/science.1069424. [DOI] [PubMed] [Google Scholar]
- Glahn DC, Thompson PM, Blangero J. Neuroimaging endophenotypes: Strategies for finding genes influencing brain structure and function. Human Brain Mapping. 2007;28:488–501. doi: 10.1002/hbm.20401. [DOI] [PMC free article] [PubMed] [Google Scholar]
- Heck A, Lieb R, Ellgas A, Pfister H, Lucae S, Erhardt A, Himmerich H, Horstmann S, Kloiber S, Ripke S, et al. Polymorphisms in the angiotensin-converting enzyme gene region predict coping styles in healthy adults and depressed patients. Am J Med Genet B Neuropsychiatr Genet. 2009;150B:104–114. doi: 10.1002/ajmg.b.30784. [DOI] [PubMed] [Google Scholar]
- Heinzen EL, Ge D, Cronin KD, Maia JM, Shianna KV, Gabriel WN, Welsh-Bohmer KA, Hulette CM, Denny TN, Goldstein DB. Tissue-specific genetic control of splicing: implications for the study of complex traits. PLoS Biol. 2008;6:e1. doi: 10.1371/journal.pbio.1000001. [DOI] [PMC free article] [PubMed] [Google Scholar]
- Hennings JM, Owashi T, Binder EB, Horstmann S, Menke A, Kloiber S, Dose T, Wollweber B, Spieler D, Messer T, et al. Clinical characteristics and treatment outcome in a representative sample of depressed inpatients - findings from the Munich Antidepressant Response Signature (MARS) project. J Psychiatr Res. 2009;43:215–229. doi: 10.1016/j.jpsychires.2008.05.002. [DOI] [PubMed] [Google Scholar]
- Herman JP, Figueiredo H, Mueller NK, Ulrich-Lai Y, Ostrander MM, Choi DC, Cullinan WE. Central mechanisms of stress integration: hierarchical circuitry controlling hypothalamo-pituitary-adrenocortical responsiveness. Frontiers In Neuroendocrinology. 2003;24:151–180. doi: 10.1016/j.yfrne.2003.07.001. [DOI] [PubMed] [Google Scholar]
- Hofman A, Breteler MM, van Duijn CM, Krestin GP, Pols HA, Stricker BH, Tiemeier H, Uitterlinden AG, Vingerling JR, Witteman JC. The Rotterdam Study: objectives and design update. Eur J Epidemiol. 2007;22:819–829. doi: 10.1007/s10654-007-9199-x. [DOI] [PMC free article] [PubMed] [Google Scholar]
- Ising M, Lucae S, Binder EB, Bettecken T, Uhr M, Ripke S, Kohli MA, Hennings JM, Horstmann S, Kloiber S, et al. A genomewide association study points to multiple Loci that predict antidepressant drug treatment outcome in depression. Arch Gen Psychiatry. 2009;66:966–975. doi: 10.1001/archgenpsychiatry.2009.95. [DOI] [PMC free article] [PubMed] [Google Scholar]
- Kendler KS, Gardner CO, Prescott CA. Toward a comprehensive developmental model for major depression in women. American Journal Of Psychiatry. 2002;159:1133–1145. doi: 10.1176/appi.ajp.159.7.1133. [DOI] [PubMed] [Google Scholar]
- Kessler RC, Berglund P, Demler O, Jin R, Koretz D, Merikangas KR, Rush AJ, Walters EE, Wang PS. The epidemiology of major depressive disorder - Results from the National Comorbidity Survey Replication (NCS-R) JAMA. 2003;289:3095–3105. doi: 10.1001/jama.289.23.3095. [DOI] [PubMed] [Google Scholar]
- Levinson DF. The genetics of depression: A review. Biological Psychiatry. 2006;60:84–92. doi: 10.1016/j.biopsych.2005.08.024. [DOI] [PubMed] [Google Scholar]
- Lewis CM, Ng MY, Butler AW, Cohen-Woods S, Uher R, Pirlo K, Weale ME, Schosser A, Paredes UM, Rivera M, et al. Genome-wide association study of major recurrent depression in the u.k. Population. Am J Psychiatry. 2010a;167:949–957. doi: 10.1176/appi.ajp.2010.09091380. [DOI] [PubMed] [Google Scholar]
- Lewis CM, Ng MY, Butler AW, Cohen-Woods S, Uher R, Pirlo K, Weale ME, Schosser A, Paredes UM, Rivera M, et al. Genome-wide association study of major recurrent depression in the U.K. population. Am J Psychiatry. 2010b;167:949–957. doi: 10.1176/appi.ajp.2010.09091380. [DOI] [PubMed] [Google Scholar]
- Li CX, Wang Y, Gao H, Pan WJ, Xiang Y, Huang M, Lei H. Cerebral metabolic changes in a depression-like rat model of chronic forced swimming studied by ex vivo high resolution 1H magnetic resonance spectroscopy. Neurochem Res. 2008;33:2342–2349. doi: 10.1007/s11064-008-9739-0. [DOI] [PubMed] [Google Scholar]
- Lucae S, Salyakina D, Barden N, Harvey M, Gagne B, Labbe M, Binder EB, Uhr M, Paez-Pereda M, Sillaber I, et al. P2RX7, a gene coding for a purinergic ligand-gated ion channel, is associated with major depressive disorder. Human Molecular Genetics. 2006;15:2438–2445. doi: 10.1093/hmg/ddl166. [DOI] [PubMed] [Google Scholar]
- Luijendijk HJ, van den Berg JF, Dekker MJ, van Tuijl HR, Otte W, Smit F, Hofman A, Stricker BH, Tiemeier H. Incidence and recurrence of late-life depression. Arch Gen Psychiatry. 2008;65:1394–1401. doi: 10.1001/archpsyc.65.12.1394. [DOI] [PubMed] [Google Scholar]
- Masson J, Pohl M, Aidouni Z, Giros B, Hamon M, ElMestikawy S. The two orphan Na+/Cl--dependent transporters Rxt1 and V-7–3-2 have an overlapping expression pattern in the rat central nervous system. Receptors & Channels. 1996;4:227–242. [PubMed] [Google Scholar]
- Muglia P, Tozzi F, Galwey NW, Francks C, Upmanyu R, Kong XQ, Antoniades A, Domenici E, Perry J, Rothen S, et al. Genome-wide association study of recurrent major depressive disorder in two European case-control cohorts. Mol Psychiatry. 2008 doi: 10.1038/mp.2008.131. [DOI] [PubMed] [Google Scholar]
- Myers AJ, Gibbs JR, Awebster J, Rohrer K, Zhao A, Marlowe L, Kaleem M, Leung D, Bryden L, Nath P, et al. A survey of genetic human cortical gene expression. Nature Genetics. 2007;39:1494–1499. doi: 10.1038/ng.2007.16. [DOI] [PubMed] [Google Scholar]
- Myers S, Bottolo L, Freeman C, McVean G, Donnelly P. A fine-scale map of recombination rates and hotspots across the human genome. Science. 2005;310:321–324. doi: 10.1126/science.1117196. [DOI] [PubMed] [Google Scholar]
- Price AL, Patterson NJ, Plenge RM, Weinblatt ME, Shadick NA, Reich D. Principal components analysis corrects for stratification in genome-wide association studies. Nature Genetics. 2006;38:904–909. doi: 10.1038/ng1847. [DOI] [PubMed] [Google Scholar]
- Pruitt KD, Tatusova T, Maglott DR. NCBI Reference Sequence (RefSeq): a curated non-redundant sequence database of genomes, transcripts and proteins. Nucleic Acids Research. 2005;33:501–504. doi: 10.1093/nar/gki025. [DOI] [PMC free article] [PubMed] [Google Scholar]
- Purcell S, Cherny SS, Sham PC. Genetic Power Calculator: design of linkage and association genetic mapping studies of complex traits. Bioinformatics. 2003;19:149–150. doi: 10.1093/bioinformatics/19.1.149. [DOI] [PubMed] [Google Scholar]
- Radloff LS. The CES-D Scale: A Self-Report Depression Scale for Research in the General Population. Appl Psychol Measurment. 1977;3:385. [Google Scholar]
- Rietschel M, Mattheisen M, Frank J, Treutlein J, Degenhardt F, Breuer R, Steffens M, Mier D, Esslinger C, Walter H, et al. Genome-Wide Association-, Replication-, and Neuroimaging Study Implicates HOMER1 in the Etiology of Major Depression. Biol Psychiatry. 2010 doi: 10.1016/j.biopsych.2010.05.038. [DOI] [PubMed] [Google Scholar]
- Schmidt MV, Scharf SH, Sterlemann V, Ganea K, Liebl C, Holsboer F, Muller MB. High susceptibility to chronic social stress is associated with a depression-like phenotype. Psychoneuroendocrinology. 2009 doi: 10.1016/j.psyneuen.2009.10.002. [DOI] [PubMed] [Google Scholar]
- Schmidt MV, Sterlemann V, Ganea K, Liebl C, Alam S, Harbich D, Greetfeld M, Uhr M, Holsboer F, Muller MB. Persistent neuroendocrine and behavioral effects of a novel, etiologically relevant mouse paradigm for chronic social stress during adolescence. Psychoneuroendocrinology. 2007;32:417–429. doi: 10.1016/j.psyneuen.2007.02.011. [DOI] [PubMed] [Google Scholar]
- Shi J, Potash JB, Knowles JA, Weissman MM, Coryell W, Scheftner WA, Lawson WB, Depaulo JR, Jr, Gejman PV, Sanders AR, et al. Genome-wide association study of recurrent early-onset major depressive disorder. Mol Psychiatry. 2010 doi: 10.1038/mp.2009.124. [DOI] [PMC free article] [PubMed] [Google Scholar]
- Spinhoven P, Ormel J, Sloekers PP, Kempen GI, Speckens AE, Van Hemert AM. A validation study of the Hospital Anxiety and Depression Scale (HADS) in different groups of Dutch subjects. Psychol Med. 1997;27:363–370. doi: 10.1017/s0033291796004382. [DOI] [PubMed] [Google Scholar]
- Sterlemann V, Ganea K, Liebl C, Harbich D, Alam S, Holsboer F, Muller MB, Schmidt MV. Long-term behavioral and neuroendocrine alterations following chronic social stress in mice: Implications for stress-related disorders. Hormones And Behavior. 2008;53:386–394. doi: 10.1016/j.yhbeh.2007.11.001. [DOI] [PubMed] [Google Scholar]
- Stranger BE, Forrest MS, Clark AG, Minichiello MJ, Deutsch S, Lyle R, Hunt S, Kahl B, Antonarakis SE, Tavare S, Deloukas P, Dermitzakis ET. Genome-wide associations of gene expression variation in humans. Plos Genetics. 2005;1:695–704. doi: 10.1371/journal.pgen.0010078. [DOI] [PMC free article] [PubMed] [Google Scholar]
- Stranger BE, Nica AC, Forrest MS, Dimas A, Bird CP, Beazley C, Ingle CE, Dunning M, Flicek P, Koller D, et al. Population genomics of human gene expression. Nature Genetics. 2007;39:1217–1224. doi: 10.1038/ng2142. [DOI] [PMC free article] [PubMed] [Google Scholar]
- Sullivan EV, Pfefferbaum A, Swan GE, Carmelli D. Heritability of hippocampal size in elderly twin men: equivalent influence from genes and environment. Hippocampus. 2001;11:754–762. doi: 10.1002/hipo.1091. [DOI] [PubMed] [Google Scholar]
- Sullivan PF, de Geus EJ, Willemsen G, James MR, Smit JH, Zandbelt T, Arolt V, Baune BT, Blackwood D, Cichon S, et al. Genome-wide association for major depressive disorder: a possible role for the presynaptic protein piccolo. Mol Psychiatry. 2009;14:359–375. doi: 10.1038/mp.2008.125. [DOI] [PMC free article] [PubMed] [Google Scholar]
- Tapiero H, Mathe G, Couvreur P, Tew KD. Dossier: Free amino acids in human health and pathologies - II. Glutamine and glutamate. Biomedicine & Pharmacotherapy. 2002;56:446–457. doi: 10.1016/s0753-3322(02)00285-8. [DOI] [PubMed] [Google Scholar]
- UniGene. 2009 http://www.ncbi.nlm.nih.gov/sites/entrez?db=unigene.http://www.ncbi.nlm.nih.gov/sites/entrez?db=unige.
- Ustun TB, Ayuso-Mateos JL, Chatterji S, Mathers C, Murray CJL. Global burden of depressive disorders in the year 2000. Br J Psychiatry. 2004;184:386–392. doi: 10.1192/bjp.184.5.386. [DOI] [PubMed] [Google Scholar]
- van Heyningen V, McBride D, Kleinjan DA. Long-range gene regulation in development and disease. Journal Of Medical Genetics. 2006;43:S15–S15. [Google Scholar]
- Videbech P, Ravnkilde B. Hippocampal volume and depression: A meta-analysis of MRI studies. American Journal Of Psychiatry. 2004;161:1957–1966. doi: 10.1176/appi.ajp.161.11.1957. [DOI] [PubMed] [Google Scholar]
- Viinamaki H, Tanskanen A, Honkalampi K, Koivumaa-Honkanen H, Haatainen K, Kaustio O, Hintikka J. Is the Beck Depression Inventory suitable for screening major depression in different phases of the disease? Nordic Journal Of Psychiatry. 2004;58:49–53. doi: 10.1080/08039480310000798. [DOI] [PubMed] [Google Scholar]
- Wang JL. Work stress as a risk factor for major depressive episode(s) Psychological Medicine. 2005;35:865–871. doi: 10.1017/s0033291704003241. [DOI] [PubMed] [Google Scholar]
- Weissman MM, Sholomskas D, Pottenger M, Prusoff BA, Locke BZ. Assessing depressive symptoms in five psychiatric populations: a validation study. Am J Epidemiol. 1977;106:203–214. doi: 10.1093/oxfordjournals.aje.a112455. [DOI] [PubMed] [Google Scholar]
- Westfall PH, Young SS. Resampling-Based Multiple Testing. John Wiley & Sons, Inc; New York: 1993. [Google Scholar]
- Westfall PH, Zaykin DV, Young SS. Multiple tests for genetics effects in association studies: biostatistical methods. Humana Press; Totawa, NJ: 2001. [DOI] [PubMed] [Google Scholar]
- Wray NR, Pergadia ML, Blackwood DH, Penninx BW, Gordon SD, Nyholt DR, Ripke S, Macintyre DJ, McGhee KA, Maclean AW, et al. Genome-wide association study of major depressive disorder: new results, meta-analysis, and lessons learned. Mol Psychiatry. 2010 doi: 10.1038/mp.2010.109. [DOI] [PMC free article] [PubMed] [Google Scholar]
- Zhou Z, Zhen J, Karpowich NK, Goetz RM, Law CJ, Reith MEA, Wang DN. LeuT-desipramine structure reveals how antidepressants block neurotransmitter reuptake. Science. 2007;317:1390–1393. doi: 10.1126/science.1147614. [DOI] [PMC free article] [PubMed] [Google Scholar]
- Zigmond AS, Snaith RP. The hospital anxiety and depression scale. Acta Psychiatr Scand. 1983;67:361–370. doi: 10.1111/j.1600-0447.1983.tb09716.x. [DOI] [PubMed] [Google Scholar]
Associated Data
This section collects any data citations, data availability statements, or supplementary materials included in this article.