Abstract
This paper presents a highly efficient single cell capture scheme using hydrodynamic guiding structures in a microwell array. The implemented structure has a capturing efficiency of >80%, and has a capacity to place individual cells into separated microwells, allowing for the time-lapse monitoring on single cell behavior. Feasibility was tested by injecting microbeads (15 μm in diameter) and prostate cancer PC3 cells in an 8×8 microwell array chip and >80% of the microwells were occupied by single ones. Using the chips, the number of cells required for cell assays can be dramatically reduced and this will facilitate overcoming a huddle of assays with scarce supply of cells.
Typically, information regarding cells such as proliferation, differentiation, response to external stimuli, etc., has been derived by averaging over relevant individual cells assuming that purified cell samples are uniform; however, cells are often known to be not identical but heterogeneous.1, 2, 3, 4 Therefore, single-cell analysis enables a more precise understanding of differences between individual cells, which would lead to, for example, better understanding of diseases, such as cancer. Conventionally, a serial dilution method has been used for single cell analysis. This is a macroscopic technique: diluting cell samples down to a concentration that there is only a single cell in hundreds of microliter and loading single cells in a conventional platform, such as a 96 well plate. However, it is very labor-intensive, yields low-throughput, brings low single-cell loading efficiency and lacks reproducibility, and is thus, rarely performed. On the other hand, microfluidic devices can provide high-throughput cell manipulation with accurate control at single cell level. A few groups have reported microfluidic chips which are providing platforms to analyze single cells by incorporating active or passive single-cell capturing schemes. Active single-cell capture schemes such as dielectrophoresis5, 6, 7 and optical image driven dielectrophoresis,8 offer accurate cell manipulation and selective cell capturing; however, it needs cell suspension media of high conductivity to generate dielectrophoresis, limiting its potential applications and requires the connection to external equipments with precise control. On the other hand, passive methods using hydrodynamic weirs9, 10, 11, 12 are attractive because their implementation is simple and does not require any external equipment and expertise for control. Most weir systems, however, have relatively poor capturing efficiencies (the ratio of the captured cells to the injected cells), making it difficult to apply them to study rare cells populations (e.g., stem cells or circulating tumor cells). Overcoming the challenge, Skelley et al.,13 reported a passive weir structure with the capturing efficiency of ∼70% but the structure was nonoptimal for long-term cell culture. Here, we present a passive microfluidic scheme for efficient cell capturing using hydrodynamic guiding structures. The simple structure in a microwell splits the incoming fluid into two pathways having different hydrodynamic resistances. This enables single cell captures at high-throughput from gravity flow without using any external force. The capturing efficiency was estimated by simple modeling and simulations using COMSOL™. To verify feasibility, we have fabricated a prototype device with 8×8 microwell arrays and demonstrated the passive single cell loading with a capturing efficiency higher than 80%.
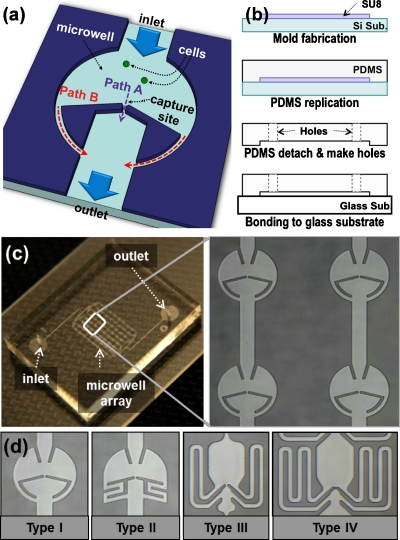
Figure 1a shows the schematic view for the unit microwell of the proposed array chip. In each unit well, a hydrodynamic guiding structure is implemented to divide the injected flow into two streams: path A through the center and path B along the border of the microwell (path B consists of two symmetric ones). Path A has a shorter length than path B; thus, path A has a smaller flow resistance than path B. Due to the flow resistance difference, most of the incoming flow and injected cells in suspension will take path A rather than path B. Path A has a small capture site in the pathway which is smaller than cell diameter, so that cells can be precisely captured at single cell resolution. Once the cell is captured, path A is blocked and accordingly its flow resistance becomes larger. As a result, the remaining cells will pass through path B and will be captured in the next microwells in downstream. This hydrodynamic passive capture scheme significantly increases the cell capturing efficiency and accurately positions cells at the capture sites.
Figure 1.
(a) Schematic diagram of a unit microwell with hydrodynamic guiding structures for a high capturing efficiency, (b) illustration of fabrication procedures, (c) photograph of the fabricated microwell array chip and the magnified view of four microwells, (d) four microwell structures with various channel length ratios of path A and path B.
Figure 1b shows the fabrication process. The capturing structures can be easily fabricated using soft-lithography with one layer of polydimethylsiloxane (PDMS, Dow corning, MI) on glass substrate. The 25-μm-thick mold was patterned on a bare silicon substrate using epoxy-based negative photoresist, SU8-10 (Microchem, MA). Liquid PDMS was cast on it and solidified at 90 °C on a hotplate for 3 h. Then, the cured PDMS was cut into pieces and detached. Holes for inlet and outlet were generated with a custom-made punch (2 mm in diameter). After surface treatment the PDMS and glass with O2 plasma [600 mTorr, O2 100 SCCM (SCCM denotes cubic centimeter per minute at STP), 100 W, 10 s], the PDMS was bonded to the glass slide at 65 °C on a hotplate for 2 h. The microwell size is 400 μm in diameter with a flow channel of 150 μm in width and 25 μm in height. The fabricated device is shown in Fig. 1c and the four different microwell designs have been fabricated for comparison study as shown in Fig. 1d.
The capturing efficiency can be calculated from the probability of how much portion of the injected cells may take path A, assuming that all the cells passing through path A can be captured in a capture site. The initial position of the injected cells can be assumed to be uniformly distributed across the fluidic channel and the probability can be obtained as the ratio of the volumetric flow stream passing through path A to the total injected flow, which is given by:
| (1) |
where Q is a volumetric flow rate and the subscripts A and B denote path A and path B. The volumetric flow ratio between path A and path B can be simply modeled14 as given in Eq. 2, approximating that the pressure differences across path A and path B are almost same for the Eq. 2.
| (2) |
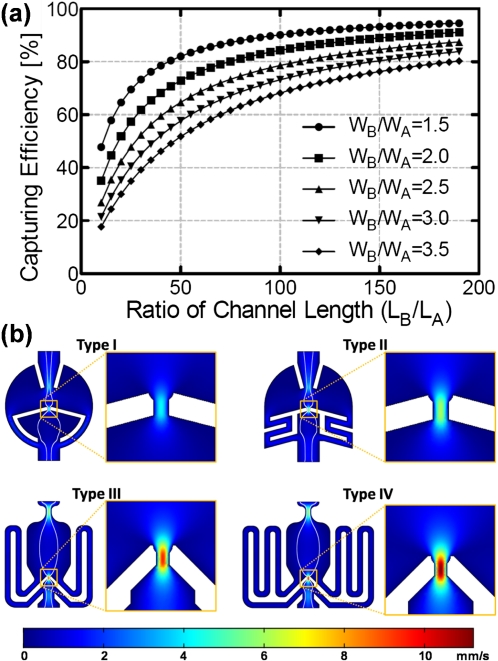
where L is the channel length, W is the channel width, and H is the channel height. There are two important design-parameters, LB∕LA and WB∕WA, that will determine the capturing efficiency when the channel height is uniform. For higher capturing efficiency, it is desirable to make LB∕LA larger and WB∕WA smaller. However, there are limitations in determining these dimensions. The width of path A (WA) should be designed smaller than the diameter of the target cells because path A should work as a capturing site as well. The width of the path B (WB) and also the channel height (HA and HB) should be larger than cell diameters to allow cells flow fluently without being clogged. The PC3 cells chosen for feasibility test have a diameter from 15 to 22 μm. We minimized the width ratio (WB∕WA) to achieve a higher capturing efficiency and designed the four different length ratios [type I–IV; ratios are 1:20, 1:40, 1:80, and 1:160, respectively, shown in Fig. 1d]. The design parameters are summarized in Table 1. Figure 2a shows the estimated capturing efficiencies for different dimensions. We performed simulations with COMSOL MULTIPHYSICS and the simulated fluid velocity (by color map) and streamlines are shown in Fig. 2b. The fluid velocity at capture sites (path A) is much higher than that of path B, verifying that most of the injected fluid goes through path A. The streamlines represent the outer boundaries of flow, inside which the cells will take path A and be captured. The width of the boundaries becomes larger with bigger channel length ratios.
Table 1.
Dimension of path A and path B.
| Length (μm) | Width (μm) | Height (μm) | |
|---|---|---|---|
| Path A | 10 | 10 | 25 |
| Path B | 200 (I), 400 (II), 800 (III), 1600 (IV) | 25 | 25 |
Figure 2.
(a) Estimated capturing efficiencies as a function of channel width (WB∕WA) and channel length ratios (LB∕LA) and (b) COMSOL simulation results of flow velocity distribution and streamlines. (The inserted bar indicates velocity profiles at an injecting flow speed of 1 mm/s and the white lines are velocity streamlines).
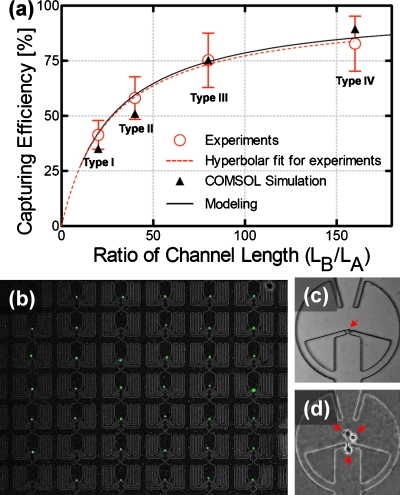
For quantitative analysis, we first tested the prototype device using microbeads (15 μm in diameter, micromer-M, Micromod, Germany) to emulate the movement of PC3 cells inside the microwell array. A syringe pump (KDS101, KD scientific, MA) was connected to an inlet port of the microwell array chip to generate a continuous and constant flow. The movement of the injected microbeads was monitored under a microscope (SMA1500, Nikon, Japan). To prevent the injected microbeads from sinking and being stuck to the bottom surface during operation, we suspended the microbeads in a 22% sucrose solution, which has the same density as the microbeads. We also added a surfactant, 1% Triton X-100 (Sigma-Aldrich, MO), to disperse the microbeads and prevent the aggregation onto the inner microchannel walls. Suspended microbeads with a concentration of 1.8×10⁵ beads∕ml were injected from the inlet at a constant flow rate of 1.5 μl∕min. It took less than 1 min for the microbeads to fill all the capturing sites with single microbeads. Microbeads would take path A first. After a single microbead is trapped in the capture site, the following microbeads go through path B and are trapped in the next microwells. The capturing movie clip can be found in Ref. 15. A capturing efficiency was obtained by counting all the injected microbeads through one column (eight successive microwells) until all the capture sites were occupied. The capturing efficiencies were obtained as 41% (type I), 58% (type II), 75% (type III), and 82% (type IV), respectively, and are in good agreement with the modeling and COMSOL simulation results as shown in Fig. 3a. This is a significant improvement over other previously-reported passive capturing schemes that have capturing efficiencies <1%.9, 12 Figure 3a verifies that capturing efficiency increases as the length ratio between path A and B (LB∕LA) gets larger.
Figure 3.
(a) Capturing efficiency vs length ratio (LB∕LA) when a channel width ratio (WB∕WA) is 2.5 (error bar represents its standard deviation, N=8). (b) Photograph of captured single green-fluorescence-activated PC3 cells in microwell array. Only one PC3 cell was captured at each capturing site. In the image, 39 microwells are occupied with single cells out of 42 microwells, (d) and (e) Single cell culture for three days: photographs were taken in an identical microwell at day 0 (c) and day 3 (d).
We also performed capturing experiments with PC3 cells. Suspension of PC3 cells (∼5×10⁴ cells∕ml) in cell culture media [RPMI+10% fetal bovine serum (FBS)] was prepared and injected through the inlet. The capturing result is shown in Fig. 3b. Green dots represent PC3 cells. (To facilitate a simple optical observation, we used the PC3 cells expressing green fluorescent protein. Over 80% of microwells were occupied by single cells. After capturing cells, we cultured them for three days in an incubator (37 °C, 5% CO2, and 90% humidity). In order to supply nutrients to the cells, we refresh the media once a day. Figure 3d shows the PC3 cells after culturing for three days. The captured single PC3 cells had proliferated into three cells, confirming that the hydrodynamic guiding structure does not affect cell viability. This high efficient capturing scheme can be easily expanded to a larger array size for high-throughput single cell assay and drug screening applications.
References
- Poste G., Tzeng J., Doll J., Greig R., Rieman D., and Zeidman I., Proc. Natl. Acad. Sci. U.S.A. 79, 6574 (1982). 10.1073/pnas.79.21.6574 [DOI] [PMC free article] [PubMed] [Google Scholar]
- Heppner G. H., Cancer Res. 44, 2259 (1984). [PubMed] [Google Scholar]
- Ljungberg B., Stenling R., and Roos G., Cancer 56, 503 (1985). [DOI] [PubMed] [Google Scholar]
- Dexter D. L. and Leith J. T., J. Clin. Oncol. 4, 244 (1986). [DOI] [PubMed] [Google Scholar]
- Huang Y., Joo S., Duhon M., Heller M., Wallace B., and Xu X., Anal. Chem. 74, 3362 (2002). 10.1021/ac011273v [DOI] [PubMed] [Google Scholar]
- Taff B. M. and Voldman J., Anal. Chem. 77, 7976 (2005). 10.1021/ac0513616 [DOI] [PubMed] [Google Scholar]
- Jaeger M. S., Uhlig K., Schnelle T., and Mueller T., J. Phys. D: Appl. Phys. 41, 175502 (2008). 10.1088/0022-3727/41/17/175502 [DOI] [Google Scholar]
- Chiou P. Y., Ohta A. T., and Wu M. C., Nature (London) 436, 370 (2005). 10.1038/nature03831 [DOI] [PubMed] [Google Scholar]
- Di Carlo D., Aghdam N., and Lee L. P., Anal. Chem. 78, 4925 (2006). 10.1021/ac060541s [DOI] [PubMed] [Google Scholar]
- Carlo D. D. and Lee L. P., Anal. Chem. 78, 7918 (2006). 10.1021/ac069490p [DOI] [PubMed] [Google Scholar]
- Taff B. M., Desai S. P., and Voldman J., Appl. Phys. Lett. 94, 084102 (2009). 10.1063/1.3085955 [DOI] [PMC free article] [PubMed] [Google Scholar]
- Kim Y. -J., Chung J., Lee H. -K., and Yoon E., IEEE MEMS Conference Technical Digest (IEEE, New York, 2008), pp. 13–17.
- Skelley A. M., Kirak O., Suh H., Jaenisch R., and Voldman J., Nat. Methods 6, 147 (2009). 10.1038/nmeth.1290 [DOI] [PMC free article] [PubMed] [Google Scholar]
- Tan W. -H. and Takeuchi S., Proc. Natl. Acad. Sci. U.S.A. 104, 1146 (2007). 10.1073/pnas.0606625104 [DOI] [PMC free article] [PubMed] [Google Scholar]
- See supplementary material at http://dx.doi.org/10.1063/1.3565236 for a movie clip of a single-bead capturing.


