

Abstract
The genotype-phenotype map consists of developmental and physiological mechanisms mapping genetic onto phenotypic variation. It determines the distribution of heritable phenotypic variance on which selection can act. Comparative studies of morphology as well as of gene regulatory networks show that the genotype-phenotype map itself evolves, yet little is known about the actual evolutionary mechanisms involved. The study of such mechanisms requires exploring the variation in genotype-phenotype maps at the population level, which presently is easier to quantify by statistical genetic methods rather than by regulatory network structures. We focus on the evolution of pleiotropy, a major structural aspect of the genotype-phenotype map. Pleiotropic genes affect multiple traits and underlie genetic covariance between traits, often causing evolutionary constraints. Previous quantitative genetic studies have demonstrated population-level variation in pleiotropy in the form of loci, at which genotypes differ in the genetic covariation between traits. This variation can potentially fuel evolution of the genotype-phenotype map under selection and/or drift. Here, we propose a developmental mechanism underlying population genetic variation in covariance, and test its predictions. Specifically, the mechanism predicts that the loci identified as responsible for genetic variation in pleiotropy are involved in trait-specific epistatic interactions. We test this prediction for loci affecting allometric relationships between traits in an advanced intercross between inbred mouse strains. The results consistently support the prediction. We further find a high degree of sign epistasis in these interactions, which we interpret as an indication of adaptive gene complexes within the diverged parental lines.
INTRODUCTION
Response to selection and therefore the pattern of evolutionary change is determined by the distribution of heritable phenotypic variance. At the core of this distribution is the mapping from genotypic to phenotypic variation, the so-called genotype-phenotype map (GP map). The map describes the wiring structure of genetic effects on the phenotype (polygeny and pleiotropy), and their effect sizes. Of particular interest is pleiotropy, as it is a major cause of evolutionary constraint.
The genotype-phenotype map not only structures heritable variation but also evolves. This is evident in comparative studies at both morphological and molecular levels. At the morphological level, differentiation of serially homologous or symmetrical structures offers the most striking examples (e.g., Palmer, 2004; Beldade et al., 2008). The underlying genetic/developmental programs of these structures must be differentiated in related species with and without individuation of serially homologous structures. At the molecular level, further insight into the evolution of the GP map is provided by studies of homologous regulatory paths or networks across different taxa (e.g., Tsong et al., 2006; Davidson and Erwin, 2006, 2010; Jovelin et al., 2010). Detailed molecular studies of single pathways and networks of genes are being extended with high-throughput approaches. Recent studies of interactomes suggest that understanding changes in the interaction structure rather than changes in single gene products is critical for understanding phenotypic variation (“edgetics”, Zhong et al., 2009; Dreze et al., 2009).
Even so, we have little insight into the processes underlying evolution of the genotype-phenotype map. Recently, several population-genetic studies presented evidence for variance in the genotype-phenotype map at the population level (Cheverud et al., 2004; Pavlicev et al., 2008; Leamy et al., 2009). Specifically, the studies identified loci, called relationship loci (rQTL), at which genotypes differ in genetic covariance between traits, and hence in pleiotropic structure, even though they do not differ in trait means. Both gene-by-environment (e.g., Barret et al., 2009) and gene-by-gene (epistatic) interactions (e.g., Cheverud et al., 2004) can cause this kind of variation. We focus here on epistasis. In the rQTL studies cited above, different epistatic interactions for different traits are responsible for this kind of variation.
While variation in the GP map is required for its evolution, the existence of such variation is not sufficient to define GP map evolution. Pavlicev et al. (2011) present a model of GP map evolution due to the response of rQTL frequencies to directional selection on phenotypes. Yet a full understanding of the evolution of the GP map also requires an understanding of the mechanisms producing variation in it, truly connecting developmental with population genetic processes. Experimentally this is not a trivial task, as currently it is sufficiently difficult to establish the structure of molecular regulatory systems, let alone quantifying their effects on variation in a population.
Here, we suggest one possible mechanism generating the type of population variation in pleiotropy that manifests in rQTL and test it against data from an advanced intercross between two inbred mouse strains. Specifically, this model predicts that rQTL will be involved predominantly in trait-specific, rather than general pleiotropic interactions. We test this prediction by mapping rQTL for eight trait relationships and assessing their interactions with other genomic locations. We furthermore discuss alternative molecular explanations for population-level variation in pleiotropy.
BACKGROUND
Population variation in pleiotropy
As mentioned above, variation in pleiotropy can be detected at the population level and mapped to relationship QTL. Relationship QTL are loci at which the genotype classes differ in their genetic variance-covariance matrix. In a corresponding univariate case, changed variance across genotype classes is a consequence of environmental and/or genetic interactions (Fig. 1A), often referred to as environmental or genetic (de)canalization. When interactions affect the variance of multiple traits (Fig. 1B), changes in trait relationships depend on the relative effects on different traits. Interaction differentially affecting the variance of traits (Fig. 1C) causes intertrait relationships to change across the genotypic classes. In other words, the genotypic classes vary with respect to their pleiotropic effects across traits.
Figure 1.
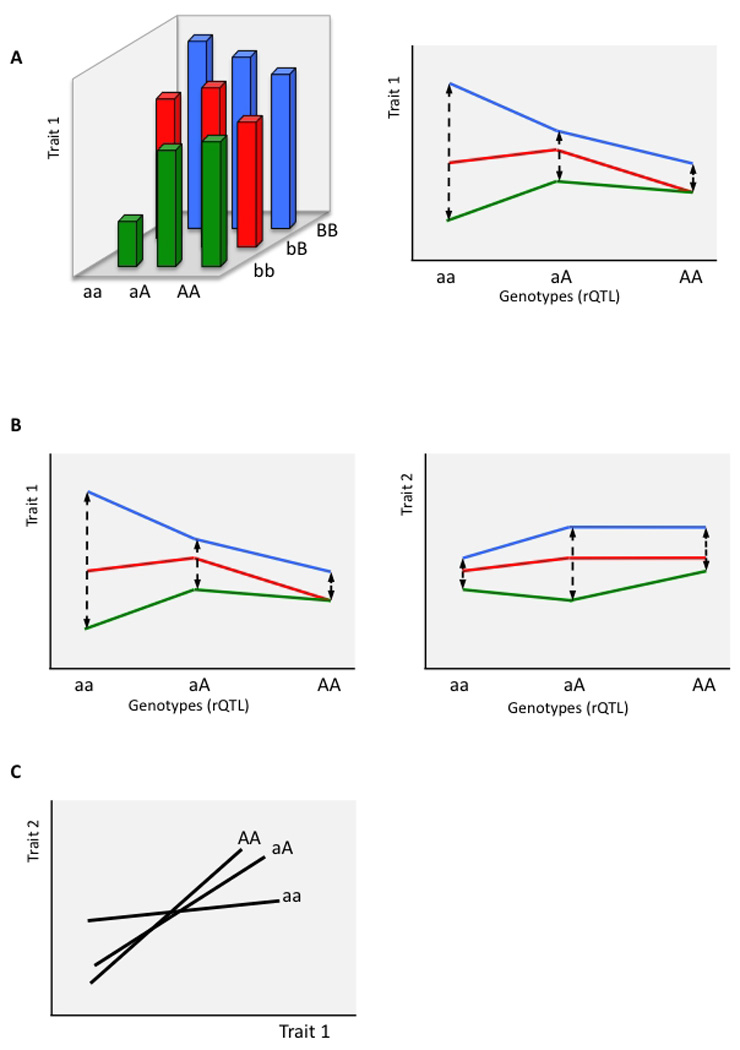
Interaction effect resulting in the variation in the relationship between two traits. A) The effect of interaction on univariate trait-variance within genotype classes at a rQTL A. Note that the interaction effect can be due to another locus (i.e., epistasis, here with locus B), or due to environment (an allele having different effects in different environments). Different lines represent different genotypes at the interacting locus B. B) Simultaneous effect of the interaction with locus A on two traits. Note that interaction affects the rQTL-genotype differently for the two traits, causing the relationship between the two variances to vary across the genotypes at locus A, as shown in C). C) The lines represent regression lines of trait 2 on trait 1. The slopes vary depending on the genotype at the rQTL A.
Mechanistic model
A developmental model for phenotypic variation describes a simple mechanistic relation that has consequences for population-level variation and can be used to explore the evolutionary consequences of developmental processes. Pleiotropy can be caused by the single gene products that are utilized in different spatial and temporal contexts during development (He and Zhang, 2006; Hodgkin, 1998). These contexts can be thought of as pathways that produce an organism's individual characters. Pathways and networks of physiological interactions can also plausibly generate nonlinear effects at the phenotypic level (epistasis). The autonomy of phenotypic characters then depends on the degree to which the pathways (e.g., regulatory circuits) are independent with respect to the genes and gene interactions involved. If the focal gene product interacts in distinct pathways with distinct, non-overlapping sets of genes, mutations in these genes affect the characters in a quasi-independent way, causing variation in their interrelationship. This is then manifested as population-level variation in pleiotropy at the focal locus (see scheme in Fig. 2). The result is that the characters, even though sharing a focal gene product, can vary and evolve in a relatively independent way. In the realm of this model, the loci detected as rQTL are epistatically interacting with pleiotropic loci. However these interactions only affect a subset of the phenotypic traits affected by the pleiotropic locus.
Figure 2.
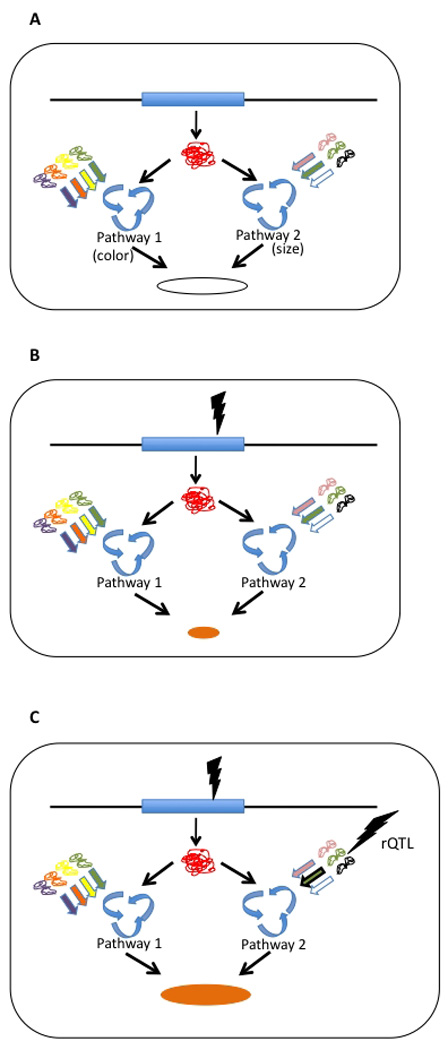
Mechanistic model for the appearance of rQTL-type variation in pleiotropy. A) The single gene product is involved in two pathways, in this example determining the color and the growth (size) of the yeast colony. There is no genetic variation (“wildtype”). The resulting colony is white and large. B) A mutation happens at the pleiotropic locus that affects both pathways, resulting in a change in both traits: the phenotype is a slow-growing, orange colony. C) A compensatory mutation occurs in one of the pathways, affecting the result of one, but not another pathway. The colony hence manifests mutated color, but “wildtype” growth rate (it is not necessarily a fully compensating mutation, but it causes variation that is independent of the other trait).
A well worked-out example from research on the budding yeast, Saccharomyces cerevisiae, can be used to illustrate the model. Kim et al. (2009) analyzed the molecular basis of a pleiotropic mutation at CYS4 that causes both rust coloration of colonies growing on copper sulfate and increased drug sensitivity to multiple drugs (Fay et al., 2004; Kim and Fay, 2007). The single nucleotide substitution was shown to lower cysteine levels. Cysteine is an essential amino acid involved in both the sulphur assimilation pathway and in the detoxification pathway. Low levels of cysteine cause an increased assimilation of sulphur, and therefore rust coloration, and also increased sensitivity to multiple drugs. Different gene products interact with the focal gene in these two pathways. Therefore mutations in these other genes (i. e., different backgrounds) affect the two phenotypes separately, and the relationship between the phenotypes varies with genotypes at the locus. Of course there are further genes involved in production of the two phenotypes, however these effects may or may not cause variation in pleiotropy at the locus considered.
In this study we address genetic variation in the relationships between pairs of traits. If the model outlined above underlies the variation observed, epistatic interactions of loci with the rQTL will typically affect only one of the two traits, indicating that pathways are character-specific and enabling evolutionary individuation of the characters. We find that most epistatic interactions with loci (rQTL) contributing to the variation in pleiotropy are indeed character-specific.
MATERIALS AND METHODS
The main goal of this study is to characterize epistatic interactions with loci contributing to variation in pleiotropy. To this end, we applied QTL mapping approaches in an advanced intercross population formed from two inbred mouse strains, first, to reveal loci contributing to genetic variation in intertrait relationships, and second, to reveal interactions of these loci with other genomic locations.
Population
The data stem from a population of F10 generation animals and their F9 generation parents (henceforth F9F10) from an advanced intercross between inbred mouse (house mouse, Mus musculus) strains LG/J and SM/J (Cheverud et al., 1996; Kramer et al., 1998; Vaughn et al. 1999; Cheverud et al. 2001; Kenney-Hunt et al. 2008; Norgard et al. 2008). Prior to the intercross, the parental strains had been selected for about 80 generations for large or small body weight at 60 days of age (Goodale, 1938; Macarthur, 1949) and then inbred. The details of population history, husbandry, and experimental design are described in Norgard et al. (2008).
Phenotypic measurements
We focused on the genetic architecture of the following morphological traits: the lengths of the tail and long bones (mm; femur, tibia, humerus and ulna) and the weights of internal organs (g; heart, liver, spleen, left and right kidney). We also measured body weight (g). All phenotypic measurements were taken at necropsy after 10 weeks of age. We accounted for the effects of sex, age at necropsy and litter size by taking the residuals from a multiple regression of each phenotype on these factors as independent variables, prior to further analysis. We added the residuals of the regression for each trait to their respective mean to produce covariate-corrected individual trait scores. The weight measurements (body, heart, kidney, spleen and liver weights) were additionally transformed by taking the cube root of the individual values to place them on a comparable scale as the long bone and tail lengths. All traits are originally on the ratio scale. Table 1 lists the means and standard errors for all traits, and their evolvabilities. We calculated the additive genetic variance from the F10 population using the full sibship method (Falconer and Mackay, '96). The univariate measure of trait evolvability (IA; Houle, ‘92; Hansen et al. 2003; Hansen and Houle 2008), was calculated as the additive variance divided by the square of the trait mean:
Table 1.
Mean values and evolvabilities of traits
| Trait | Evolvability | Arithmetic mean (±SE) |
|---|---|---|
| Femur lt | 5.15E-04 | 15.487 (±0.016) mm |
| Humerus lt | 4.29E-04 | 12.258 (±0.012) mm |
| Tibia lt | 5.14E-04 | 17.157 (±0.015) mm |
| Ulna lt | 4.13E-04 | 14.145 (±0.012) mm |
| Tail lt | 2.80E-03 | 89.872 (±0.166) mm |
| L. kidney wt1 | 1.38E-02 | 0.232 (±0.002) g |
| R. kidney wt1 | 1.30E-02 | 0.263 (±0.016) g |
| Spleen wt | 1.28E-02 | 0.133 (±0.002) g |
| Liver wt | 9.41E-03 | 1.914 (±0.020) g |
| Body wt | 9.26E-03 | 31.803 (±0.173) g |
lt: length, wt: weight
Quantitative genetic estimation of genetic variation in trait relationship
We tested for the presence of genetic variation in allometry by measuring the effect of family on the relationship between body size and local traits. We used analysis of covariance in the F10 animals to measure the extent of genetic variation in trait (Y) allometry with overall body size (z):
where the coefficient βz is the across-family average allometry of the bone length, Family is a random effect accounting for heritable variation in bone lengths independent of body size, and the interaction coefficient βFZ measures the extent to which allometries vary between families. The heritable variation in allometry is captured in the variance associated with the interaction term.
Relationship QTL mapping
rQTL mapping reveals loci at which the effects of an allele substitution vary depending on the value of the phenotypic covariate, body weight. These loci contribute to genetic variation in the relationship between size and shape, i.e., the variation in allometric slope. The relevant information on epistatic interactions (see below) was extracted from the results of previous studies that performed complete two-way epistatic interaction scans in this population on the same phenotypic traits (Norgard et al., 2009; Fawcett et al, 2010).
The experimental population is comprised of 1456 individuals (F9: n = 150 and F10: n = 1,306), genotyped at 1470 polymorphic SNPs using the Illumina GoldenGate platform. Genetic markers were approximately evenly distributed on 19 autosomes (i.e., 1 marker for every 1.66 Mb in the F9F10). Additional genotype scores were imputed in the intervals between markers, to arrive at a genotyped or imputed marker each 1 cM along the genome map (interval mapping, Lander and Botstein, ’89; Haley and Knott, ‘92). To map genetic effects on the phenotypes, we used the mixed-models procedure (PROC MIXED) in the SAS software package (ver. 9.1). In the advanced intercross generations, family members are genetically autocorrelated and this autocorrelation has to be accounted for in measuring statistical significance (Wolf et al., 2008; Cheverud et al, 2010). In the model, we included family and its interaction with body weight as random variables. Body size, additive direct effect (Xa), dominance direct effect (Xd), and the interactions between body size and direct effects were included as fixed effects:
where Y is a focal trait whose relationship with body weight (z) is under consideration. Significance thresholds need to be adjusted to limit false positive findings given the large number of tests performed in the scan. We calculated threshold values for each chromosome based on the correlation of the genotypes as described by Li and Ji (2005).
Direct effect quantitative trait loci
Apart from the effects on the relationship between the two traits, we were also interested in the direct effects of the loci on the mean values of single traits. The direct effects were mapped in the previous studies (Norgard et al, 2009; Fawcett et al, 2010). We screened the results of these studies to reveal co-localization of rQTL with direct-effect loci. We consider rQTL and direct effect QTL as co-localized if their confidence intervals overlap. Confidence intervals were defined as the region surrounding the location of the LOD peak value within which the LOD score is within 1.0 LOD of its maximum score.
Epistatic QTL mapping
The final QTL analysis focused on loci that interact with the rQTL affecting either body size or the focal trait (e.g., if rQTL A affects the allometry of femur, we are interested in epistatic interactions of A with effects on either body size or the femur). The full epistatic scan of this population for all the traits included in the present study was conducted previously and the results have been presented for the long bones in Norgard et al. (2009) and for the internal organs and tail length in Fawcett et al. (2010). For this study, we did not repeat the scans (see the above studies for details of the mapping), but rather extracted the interactions involving specific rQTL from the results of the previous studies. Because we only consider epistatic interactions with independently identified rQTL, we applied lower detection thresholds in this study than in original studies reporting epistatic interactions. This was done because we are only interested in interactions with the specific rQTL identified in this study. The resulting thresholds are the same as those used in the single locus direct effect scans (Norgard et al, 2009; Fawcett et al, 2010). We tested patterns of epistasis using only the top 25% most significant interactions in the analysis to determine whether the relatively low thresholds bias interaction patterns. The results were qualitatively equivalent (not shown) to those reported here. The subset of interactions with individual rQTL was then analyzed to reveal the patterns of epistasis for the traits involved.
Characterizing directionality of epistasis
To further characterize the epistatic interactions with rQTL, we estimated the effect of epistasis on the additive genetic variance component. To this end we applied the multilinear model of epistatic interaction (Hansen and Wagner, 2001; Carter et al., 2005). We fitted the models in the NOIA framework, (Alvarez-Castro et al., 2008), as implemented in the R package noia (Le Rouzic, 2008; Le Rouzic and Alvarez-Castro, 2008). For a detailed description of this approach using QTL data see Pavlicev et al. (2010). In short, this characterization of epistasis first defines the effects of allele substitutions at individual loci in the multilocus reference genotype. Then the effect of epistasis is modeled as a change in these ‘reference’ effects due to a previous change in the reference genotype:
where xij is an observed phenotype after substitutions at loci i, j ; xr is the average phenotype of individuals with the reference genotype, iy is an effect of a substitution at locus i in the reference genotype, and jy is the effect of a substitution at a locus j in the reference genotype. The epistatic factor i→jf describes the rescaling of the locus’ reference effect due to the previous change in genetic background (Wagner et al., 1998). Note that f = 1 means no epistasis, |f| <1 indicates a decrease in the effect of a substitution with respect to the reference effect leading to a smaller additive genetic variance, and |f| >1 reflects an increase in the substitution effect relative to the reference effect and an increase in additive genetic variance. f < 0 is a case where the sign of the effect changes (sign epistasis). We further use the epistatic coefficient ijε that describes epistatic relationship between loci i and j, such that any phenotype can be expressed (with respect to the two loci) as:
It follows that when ijε > 0 positive changes at locus i will enhance the positive effects at locus j with respect to the reference effect, while the opposite happens when ijε < 0. The coefficient ijε therefore describes the directionality of epistasis in the interaction. Composite measures of directionality can be calculated as a variance-weighted average of the epistatic modifications across interactions (Pavlicev et al., 2010), or as an average of an epistatic modification of an allele substitution at the particular locus, across different backgrounds: where iV is the variance at the locus . As the trait measurements were mean standardized, the directionality can be compared across traits. For example, the coefficient of directionality of +1 is indicates that the allelic substitution at locus 1 that increases the mean trait value by 5% increases the effect of the substitution at locus 2 by 5% (i.e., 1 × 5%). We focus here on the distribution of epistatic effects involving one particular locus at a time, namely each rQTL. We are particularly interested in epistatic factors associated with rQTL interactions.
We also estimated these parameters for the epistatic interactions previously detected in this intercross population (Norgard et al, 2009; Fawcett et al, 2010). These interactions are not restricted to those involving a rQTL as an interaction partner and thus serve for comparison with the epistatic interactions involving rQTL.
RESULTS
The population mean values and evolvabilities are presented in Table 1. Note that these were calculated on the natural scale of the traits. Table 2 lists the heritabilities of the allometric relationship on a log-log scale, as well as on the natural scale. The variation in intertrait relationship on the natural scale represents the variation in the intercept of the allometric line and thus the variation in shape. This is comparable to studies that previously addressed these relationships (e.g., Pavlicev et al., 2008; also note that in the present study body weight was cube-root-transformed prior to all analyses). Variation in the intertrait relationship on the log-log scale represents the variation in allometric slope. Heritability of allometric relationships between traits indicates the proportion of genetic variance relative to the phenotypic variance after covariate correction (i.e., relative to the sum of the interaction and residual variance). For the intertrait relationships in this study, heritabilities range from 7–20% on the log-scale, and 7–15% on the natural scale. We focus on the variation in the allometric slope in the following.
Table 2.
Heritability of allometric relationships on log-transformed and natural scales.
| Heritability of the relationship to body weight | ||
|---|---|---|
| Trait | log- scale | natural scale |
| Femur lt | 0.119 | 0.112 |
| Humerus lt | 0.122 | 0.113 |
| Tibia lt | 0.103 | 0.097 |
| Ulna lt | 0.103 | 0.102 |
| Tail lt | 0.071 | 0.068 |
| L. kidney wt1 | 0.091 | 0.100 |
| R. kidney wt1 | 0.068 | 0.067 |
| Spleen wt | 0.071 | 0.071 |
| Liver wt | 0.195 | 0.154 |
P<0.003 in all cases
We detected a total of 85 rQTL for the eight trait relationships studied (eight traits vs. body weight) when only one rQTL per trait relationship is expected under the null model (reflecting 1 false positive in 20 chromosomes). The locations of rQTL are listed in Table 3. Nineteen of the 85 loci affecting the relationship between two traits co-localize with loci directly affecting mean values of one or both traits. In other words, roughly 18% of the rQTL also detectably affect trait means (in two cases both trait means are affected, in others only one of the traits). Three rQTL also co-localize with rQTL detected in a previous study on a less advanced generation of the same intercross (Table 3). The previous study mapped rQTL for long bone lengths and tail length only, and found 11 rQTL (Pavlicev et al., 2008).
Table 3.
List of rQTL detected.
| Chr | cM from centro- mere |
Support interval | Closest marker | Dist. to closest marker |
Focal trait | QTL overlap |
rQTL F2F3 overlap |
|---|---|---|---|---|---|---|---|
| 1 | 0 | 0–14 | wu-rs3683945 | 0 | Liver | − | − |
| 1 | 178 | 170–187.6 | wu-rs13475919 | 2.0355 | Liver | − | − |
| 1 | 193 | 189–197 | wu-rs3692549 | 0 | Liver | − | − |
| 1 | 193 | 189–212 | wu-rs3692549 | 0 | R. kidney | − | − |
| 2 | 0 | 0–7 | wu-rs13476319 | 0 | Tail | − | − |
| 2 | 86 | 67–105 | wu-rs3688854 | 21.984 | Tibia | − | − |
| 2 | 119 | 86–144 | wu-rs13476425 | 5.22 | Humerus | − | − |
| 2 | 127.3 | 77–133 | wu-rs3680197 | 0 | Femur | − | − |
| 2 | 448 | 444–455 | wu-rs6185704 | 0 | Humerus | − | − |
| 2 | 448 | 444–454 | wu-rs6185704 | 0.01 | R. kidney | − | − |
| 2 | 462.8 | 443–476 | wu-rs6160839 | 0 | Tibia | − | − |
| 3 | 15.2 | 6–22 | wu-rs3689046 | 0 | Liver | − | − |
| 3 | 116 | 101–119 | wu-rs13477123 | −2.088 | R. kidney | − | − |
| 3 | 118.1 | 91–121 | wu-rs13477123 | 0 | Spleen | − | − |
| 3 | 175.7 | 170–183 | wu-rs6243021 | 0 | Femur | − | − |
| 3 | 175.7 | 166–185 | wu-rs6243021 | 0 | Humerus | − | − |
| 3 | 324.2 | 306–329 | gnf03.138.849 | 0 | Humerus | − | − |
| 4 | 252.2 | 250–253 | wu-rs13474356 | 0 | L. kidney | + | − |
| 4 | 302 | 270–327 | wu-rs3663950 | 19.01 | Liver | − | − |
| 4 | 352 | 346–356 | UT-4-146.099338 | −1.45 | Liver | − | − |
| 5 | 81.5 | 67–88 | wu-rs13478184 | 0 | R. kidney | − | − |
| 5 | 399 | 364–415 | mCV22895274 | 7.44 | Femur | − | − |
| 5 | 420.7 | 398–420.6 | wu-rs3718776 | 0 | Humerus | − | − |
| 6 | 36.3 | 22.9–40 | wu-rs13478667 | 0 | Tibia | + | − |
| 6 | 56.8 | 40–72 | wu-rs13478717 | 0 | L. kidney | − | − |
| 6 | 58.7 | 56–68 | wu-rs13478719 | 0 | Femur | − | − |
| 6 | 58.7 | 45–61 | wu-rs13478719 | 0 | R. kidney | − | − |
| 6 | 88.5 | 80–100 | wu-rs3684860 | 0 | L. kidney | − | − |
| 6 | 153 | 149–158 | wu-rs13478853 | −1.13 | Tail | + | − |
| 6 | 185.4 | 183–197 | gnf06.092.758 | 0 | Femur | − | − |
| 6 | 185.4 | 184–205 | gnf06.092.758 | 0 | Tibia | − | − |
| 6 | 185.4 | 184–220 | gnf06.092.758 | 0 | Ulna | − | − |
| 7 | 226 | 217–244 | wu-rs13479457 | 0.34 | R. kidney | + | − |
| 7 | 229 | 227–241 | wu-rs13479470 | 0 | L. kidney | + | − |
| 8 | 0 | 0–1 | wu-rs6273176 | 0 | R. kidney | − | − |
| 8 | 6 | 0–19 | wu-rs13479601 | 4.59 | Liver | − | − |
| 8 | 33 | 0–43 | wu-rs13479624 | −0.9 | Tail | + | − |
| 8 | 62.1 | 59–81 | CEL-8-25677705 | 0 | L. kidney | − | − |
| 8 | 84 | 59–103 | CEL-8-25677705 | 21.94 | R. kidney | − | − |
| 8 | 344.6 | 241–350 | wu-rs3675125 | 0 | L. kidney | − | − |
| 8 | 355 | 338–360.0 | wu-rs6300613 | 2.19 | Liver | − | − |
| 9 | 118 | 111–124 | wu-rs13480191 | 1.45 | Liver | − | − |
| 9 | 264.8 | 260–273 | wu-rs3723953 | 0 | L. kidney | − | − |
| 10 | 48 | 37–61 | wu-rs3023233 | −4.68 | L. kidney | − | − |
| 10 | 52.7 | 41–63 | wu-rs3023233 | 0 | R. kidney | − | − |
| 10 | 187 | 179–224 | gnf10.087.008 | 3.15 | L. kidney | +, bw | − |
| 11 | 24.7 | 17–29 | wu-rs3689494 | 0 | Ulna | − | − |
| 11 | 84 | 73–93 | wu-rs3707274 | −2.52 | L. kidney | − | − |
| 11 | 195.2 | 189–195.2 | wu-rs3714311 | 0 | L. kidney | − | − |
| 11 | 260 | 250–263 | wu-rs13481161 | −0.54 | L. kidney | +(bw) | − |
| 11 | 290.3 | 288–303 | wu-rs6180460 | 0 | L. kidney | +(bw) | − |
| 11 | 377.4 | 465-377.4 | CEL-11-118234030 | 0 | L. kidney | +(bw) | − |
| 11 | 377.4 | 370.8–377.4 | CEL-11-118234030 | 0 | Tail | − | − |
| 12 | 64.3 | 57–65 | wu-rs13481408 | 0 | L. kidney | − | − |
| 12 | 93.5 | 91–96 | wu-rs3662939 | 0 | L. kidney | − | − |
| 12 | 175.7 | 166–178 | wu-rs6288403 | 0 | Liver | − | − |
| 12 | 206 | 198–215 | wu-rs13481618 | 0.61 | Ulna | − | − |
| 12 | 210 | 195–253 | wu-rs13481618 | 4.61 | Humerus | − | − |
| 12 | 242.4 | 233–255.3 | CEL-12-104545022 | 0 | Tibia | − | − |
| 13 | 50 | 35–81 | wu-rs4229685 | −9.8 | Femur | − | − |
| 13 | 88 | 81–114 | wu-rs13481789 | -0.68 | Humerus | − | − |
| 13 | 173.1 | 169–185 | mCV24625340 | 0 | Tail | + | − |
| 13 | 227.7 | 213–231 | wu-rs3688959 | 0 | L. kidney | − | − |
| 13 | 227.7 | 217–235 | wu-rs3688959 | 0 | R. kidney | − | − |
| 14 | 127 | 112–160 | wu-rs3701623 | −23.78 | Liver | +(bw) | + |
| 15 | 102 | 95–106 | wu-rs13482589 | 0 | Humerus | − | − |
| 15 | 102 | 94–106 | wu-rs13482589 | 0 | Tibia | − | − |
| 15 | 124.2 | 120–135 | wu-rs3654559 | 0 | L. kidney | − | − |
| 15 | 173 | 167–181 | wu-rs3721372 | 1.53 | Tail | − | − |
| 15 | 243.6 | 230–248 | wu-rs13482729 | 0 | Tail | − | − |
| 16 | 91.4 | 87.9–96 | wu-rs4171440 | 0 | R. kidney | − | − |
| 16 | 112 | 105–116.2 | wu-rs4177203 | 0.64 | Spleen | − | − |
| 16 | 252.2 | 238–257 | wu-rs4219897 | 0 | Humerus | − | − |
| 16 | 259.7 | 279–260 | wu-rs4220529 | 0 | Liver | − | − |
| 17 | 39 | 33–65 | wu-rs3721884 | 0.59 | Humerus | + | + |
| 17 | 79.9 | 74–82 | wu-rs3690398 | 0 | Liver | − | + |
| 18 | 3.3 | 2–6 | wu-rs3689558 | 0 | L. kidney | − | − |
| 18 | 45.9 | 40–48 | wu-rs6385006 | 0 | Liver | − | − |
| 18 | 76.6 | 52–95.3 | wu-rs13483331 | 0 | Humerus | − | − |
| 18 | 120.2 | 114–123 | wu-rs13483382 | 0 | Femur | − | − |
| 18 | 120.2 | 116–122 | wu-rs13483382 | 0 | Humerus | − | − |
| 18 | 120.2 | 115–123 | wu-rs13483382 | 0 | Tibia | − | − |
| 18 | 120.2 | 112–123 | wu-rs13483382 | 0 | Ulna | − | − |
| 18 | 122 | 114–128 | wu-rs13483382 | 1.78 | L. kidney | − | − |
| 18 | 130 | 115–161 | wu-rs13483417 | 0 | R. kidney | − | − |
| 19 | 0 | 0–8 | wu-rs3713033 | 0 | R. kidney | +(bw) | − |
| 19 | 86.6 | 84–93 | wu-rs6291559 | 0 | R. kidney | − | − |
| 19 | 132 | 120–143.1 | mCV23121032 | −11.1 | Humerus | − | + |
| 19 | 135 | 127–143.1 | mCV23121032 | −8.1 | Tibia | − | + |
| 19 | 140 | 131–148 | mCV23121032 | −3.1 | Ulna | − | + |
| 19 | 143.5 | 123–166 | wu-rs4232174 | 0 | R. kidney | − | − |
bw: the locus is co-localized with direct effect locus that affects body weight. +: the locus is co-localized with direct-effect locus for the trait (second-to-last column), respectively the particular relationship (last column).
The scans for epistatic interactions of the rQTL with other genomic locations revealed a total of 772 interactions across all traits, with an average of 66 interactions per trait (range 18–175) and 3.5 interactions per rQTL (range 1–9).
The major question addressed here is whether epistatic interactions are different (or present-absent) for the two traits involved in the rQTL. We found that only on average 8.7% of the interactions are the same for both traits (range 2 –28% across traits, Table 4), the remainder involving differential epistasis for the paired traits. We repeated this analysis using only the top 25% most significant interactions for each trait to test whether the potential false positive effects included in the full collection of results may bias the result. The analysis revealed a similar pattern, with on average 10% of the interactions shared between traits (not shown separately). Most interactions with rQTL thus affect only one of the two traits.
Table 4.
Summary of the epistatic interactions with rQTL affecting each trait.
| Focal trait | Number of rQTL |
Number of interactions affecting focal trait |
Number of interactions affecting bw |
Overlap |
|---|---|---|---|---|
| Femur lt | 7 | 53 | 26 | 9 |
| Humerus lt | 13 | 68 | 34 | 8 |
| Tibia lt | 8 | 30 | 78 | 3 |
| Ulna lt | 5 | 18 | 47 | 2 |
| Tail lt | 7 | 31 | 65 | 2 |
| Kidney wt | 34 | 175 | 154 | 21 |
| Spleen wt | 2 | 35 | 10 | 10 |
| Liver wt | 12 | 118 | 77 | 8 |
bw: body weight
The Venn diagrams in Figure 3 show the distribution of interactions involving rQTL with respect to the traits affected. The shared interactions between the two traits are too few to detect any significant differences in pattern between the subsets of shared and trait-specific interactions. We therefore examined all (the shared and the trait-specific) interactions with rQTL together. The average modification (directionality) due to epistasis of the additive effects at the rQTLs is presented in Table 5. Complex epistasis patterns can result in a composite epsilon that is difficult to interpret (see Pavlicev et al., 2010), therefore we focused on the weighted epistatic factor. This measure represents the overall change in the effect of allelic substitutions due to change in the background and is calculated by dividing the sum of the predicted modified effects (i.e., including epistasis) by the sum of the additive effects at rQTL. We calculated the overall modification of additive variance for each trait at each rQTL. The distribution of weighed epistatic factors across single rQTL is shown in Figure 4A for each trait (Fig 4B shows comparable results for interactions involving non-rQTL loci). Plots of interaction-specific epistatic factor distributions across all interactions are presented in Figure 1S in the Supplementary Material. Overall, epistasis at rQTL exhibits a higher proportion of sign epistasis (f<0); on average 39% of the interactions involve sign change while only 12 % do so for epistasis involving non-rQTL. In other words, the background change often causes a sign change in the effect of an allele substitution at the rQTL. The percentages of interactions involving sign epistasis for each trait are listed in Table 6. We also list the percentage of interactions that reduce the absolute effect of an allele substitution (f<|1|) in Table 6.
Figure 3.
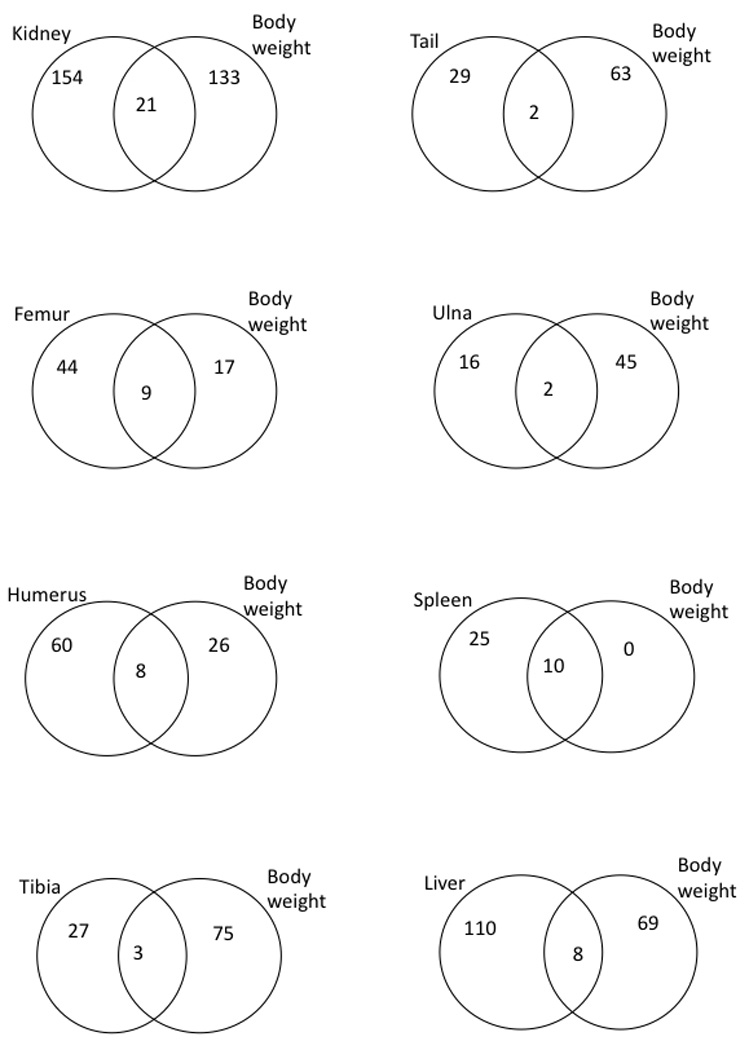
Venn diagrams illustrating the numbers of trait-specific and overlapping interactions, separately for each trait relationship. All presented interactions involve rQTL. Note that in all cases, the number of trait-specific interactions is higher than the number of overlapping ones.
Table 5.
Comparison of the epistatic factor (f) in epistatic interactions involving rQTL, with epistasis not limited to rQTL (early and advanced intercross generations F2F3 and F9F10).
| Weighed f in rQTL |
Weighed f in all F9F10 |
Weighed f in all F2F3 |
|
|---|---|---|---|
| Femur lt | 1.31 | 0.91 | 0.84 |
| Humerus lt | 0.40 | 1.21 | 1.04 |
| Tibia lt | 1.03 | 0.79 | 0.88 |
| Ulna lt | −1.25 | 1.01 | 1.00 |
| Tail lt | 1.38 | 1.15 | 1.02 |
| Kidney wt | 1.65 | 0.80 | 0.81 |
| Spleen wt | 2.58 | 0.39 | 0.53 |
| Liver wt | 0.48 | 1.14 | 0.98 |
| Body wt | 0.76 | 0.91 | 0.78 |
Figure 4.
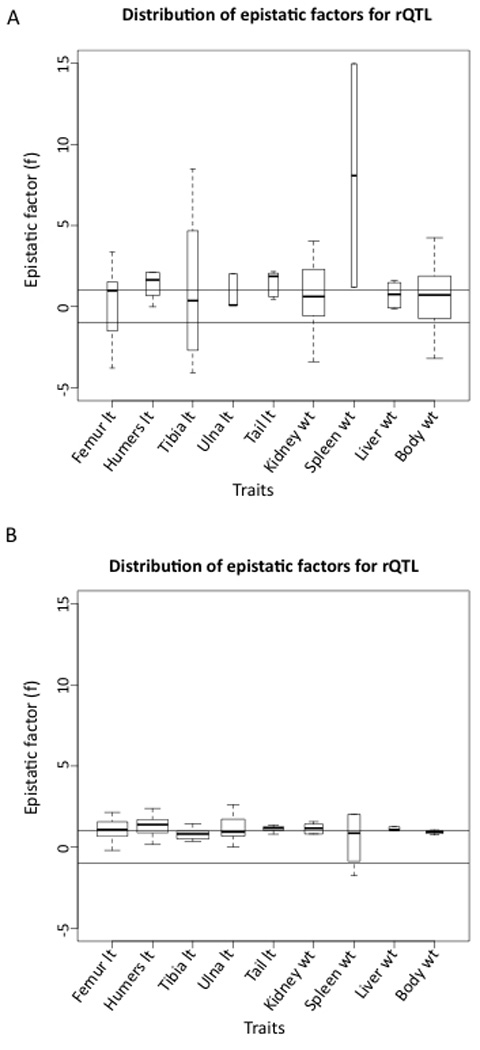
Distribution of average epistatic factors across loci for each trait. A) Each box in a box plot represents the distribution of average weighed epistatic factors, where weighed averages were calculated within the subset of interactions with single rQTL. Thus boxes show the distribution of average epistatic modifications of rQTL. B) Each box in a plot represents the distribution of average modifications due to epistasis across general interactions (not limited to rQTL). The widths of the boxes are proportional to the number of loci included. lt: length, wt: weight.
Table 6.
Comparison of general epistasis pattern with epistasis pattern at rQTL, with respect to canalization (in direction of increased size) and sign epistasis.
| % sign change(f<0) | % canalizing (f < |1|) | % reciprocal sign change rQTL(F9F10) |
|||||
|---|---|---|---|---|---|---|---|
| Trait | F9F10 | rQTL (F9F10) |
P (Δ) | F9F10 | rQTL (F9F10) |
P (Δ) | |
| Femur lt | 18.34 | 29.85 | <0.05 | 33.56 | 22.39 | <0.05 | 16.7 |
| Humerus lt | 21.91 | 43.33 | <0.1 | 44.27 | 15.00 | n. s. | 9.0 |
| Tibia lt | 8.33 | 27.14 | <0.05 | 25.00 | 40.00 | <0.05 | 20.0 |
| Ulna lt | 2.73 | 45.16 | <0.05 | 40.91 | 29.03 | n. s. | 22.2 |
| Tail lt | 22.94 | 50.00 | <0.1 | 34.12 | 5.56 | n. s. | 22.6 |
| Kidney wt | 19.29 | 33.33 | <0.1 | 38.02 | 12.04 | n. s. | 13.1 |
| Spleen wt | 8.33 | 33.43 | n. s. | 38.89 | 26.86 | n. s. | 8.6 |
| Liver wt | 0.00 | 47.46 | n. s. | 33.33 | 24.58 | n. s. | 26.3 |
| Body wt | 1.79 | 42.86 | n. s. | 60.71 | 21.63 | <0.05 | 20.0 |
We analyzed the interactions between loci that have been detected for the same traits in previous studies of this population (Fawcett et al., 2010; Norgard et al., 2009) to determine whether epistatic interactions at rQTL differ from other epistatic interactions. The overall epistatic factor, the proportion of interactions with sign epistasis and the proportion of canalizing interactions (reducing the effect of substitution relative to its additive effect) are listed in Table 6. We see that in comparison to the typical epistatic interaction, the interactions with rQTL have a significantly higher proportion of sign epistasis for most traits. We also found a lower proportion of variance-reducing interactions in some traits (i.e., less canalization). Further, we list the analogous results calculated for the less advanced generation (F2F3) of the same mouse intercross (Pavlicev et al., 2008, 2010). The rQTL interactions in the F2F3 population are too few for a conclusive analogous comparison between rQTL specific and overall interactions in the F2F3 population. Comparison of overall epistatic interactions between populations F2F3 and F9F10 (Table 7) shows that canalizing effects are significantly less frequent in the F9F10 than in the F2F3 population for all long bone traits. Interestingly, the corresponding directionality of epistasis is very similar in the F2F3 and F9F10 populations (Table 5).
Table 7.
Comparison of general epistasis pattern with respect to canalization (in direction of increased size) and sign epistasis between early and late generations of the advanced intercross line.
| % sign change(f<0) | % canalizing (f < |1|) | |||||
|---|---|---|---|---|---|---|
| Trait | F2F3 | F9F10 | P (Δ) | F2F3 | F9F10 | P (Δ) |
| Femur lt | 0.65 | 18.34 | n. s. | 50.65 | 33.56 | <0.05 |
| Humerus lt | 0.00 | 21.91 | n. s. | 59.89 | 44.27 | <0.05 |
| Tibia lt | 13.48 | 8.33 | n. s. | 47.19 | 25.00 | <0.05 |
| Ulna lt | 1.00 | 2.73 | n. s. | 55.00 | 40.91 | <0.05 |
| Tail lt | 0.65 | 22.94 | n. s. | 55.84 | 34.12 | <0.1 |
| Kidney wt | 2.42 | 19.29 | n. s. | 58.87 | 38.02 | n. s. |
| Spleen wt | 6.87 | 8.33 | n. s. | 50.38 | 38.89 | n. s. |
| Liver wt | 6.35 | 0.00 | n. s. | 53.97 | 33.33 | n. s. |
| Body wt | 10.08 | 1.79 | n. s. | 53.36 | 60.71 | n. s. |
P(Δ) : Significance of the difference between the proportions (z-statistic).
DISCUSSION
We found that epistatic interactions involving rQTL are typically different for different phenotypic traits. This finding is consistent across all examined trait-relationships. A similar prevalence of trait-specific genetic interactions with rQTL was implied in an earlier generation of the same intercross (Pavlicev et al., 2008: Table 4).
Another interesting finding concerns the character of the interactions with rQTL compared to gene interactions across all loci in this generation. rQTL have a higher proportion of interactions involving sign change than non-rQTL. Sign epistasis describes the situation in which the allelic effect changes directions across genetic backgrounds. The evolutionary importance of sign epistasis has been discussed primarily in the context of its effects on fitness (e.g., Weinreich et al., 2005). A previously deleterious mutation may become neutral or even advantageous in a specific background. Deleterious mutations are unlikely to be maintained in a population over a long period of time. However, secondary mutations that reduce the deleteriousness of a mutation at the target locus (commonly referred to as compensatory mutations) may have been resident in the population prior to the new deleterious mutation or appear rapidly after the deleterious mutation (Kondrashov et al. 2002; Kulathinal et al., 2004; Poon and Chao, 2005; Poon et al. 2005; Camps et al. 2007). Compensatory mutations do not necessarily change the sign of a deleterious mutation effect but may simply reduce its severity. This interaction is thought to shape the corridors of possible mutational paths on a multi-peak fitness landscape, an idea originally expressed by Sewall Wright (’31, ‘32). In particular, if the sign epistasis is reciprocal, i.e. both mutations are deleterious on their own but advantageous together, a rugged adaptive landscape with local optima strictly separated by maladaptive valleys is expected (Dawid et al. 2010). There is evidence for mammals and insects that about 10% of pathogenic mutations in proteins have been fixed in related species, and that this fraction doesn’t increase with the phylogenetic distance, hence the compensation must have happened fast (Kondrashov et al. 2002; Kulathinal et al. 2004). Sign epistasis is not a rare finding in studies of genetic architecture (Kroyman and Mitchell-Olds, 2005; Malmberg et al., 2005; Mitchell-Olds and Schmitt, 2006; Pavlicev et al., 2010), however interactions with rQTL seem to have particularly elevated levels.
Compensatory mutations have previously been associated with pleiotropic loci, suggesting that they can alleviate the deleterious pleiotropic (side-) effects of otherwise adaptive mutations (Johnson and Porter, 2007; Camps et al. 2007). In fact pleiotropic adaptive effect of deleterious mutations may be the reason for their persistence in a population. Hence it is perhaps not surprising to find these effects predominantly in trait-specific interactions producing variation in pleiotropy.
In this study, we explored the effects of loci in the direction of increased size, which may or may not be associated with fitness. The strains contributing to the cross were divergently selected for body size from separate base populations. Finding sign epistasis in this cross means simply that the introduction of an allele from the larger strain (LG/J) into the smaller strain (SM/J) background makes the trait smaller, whereas this same substitution into a LG/J background makes the trait larger, or vice versa. This indicates that the two strains have diverged at several interacting loci. In particular, in diallelic crosses between inbred derivatives of the selected lines, it is plausible that the interaction partners form co-adapted gene complexes within lines (Dobzhansky, 1948 ; Ohta, 1980; Matioli and Templeton ‘99), but find themselves on a different background as they start to segregate in the cross with the consequent change in effect. In the case of pleiotropic genes, the coadapted complex may correspond to a pleiotropic mutation and the corresponding compensating trait-specific mutations. Under this scenario therefore, the underlying developmental mechanism (i.e., interaction) diverged between the lines even though the phenotype is held relatively constant by compensation, a phenomenon called developmental drift (True and Haag, 2001). This scenario is also supported by the observation that a surprisingly high proportion of rQTL do not have a detectable additive genetic effect, indicating that the mutations are stabilizing one trait while the other is evolving. Hence the trait-specificity of the interactions that cause variation in pleiotropy suggests that segregating variation is revealing compensation for the deleterious effects of pleiotropic changes. Plausible scenarios for sign epistasis include the possibility that mutations underlying rQTL are responsible for an interaction between molecules (e.g., between proteins, or between DNA and a protein). In this case a single mutation may be deleterious, but when combined with a match in the corresponding binding partner, its effect is compensated. These mutations do not segregate within the strain (coadapted complexes), but when crossed, these complexes start segregating. Such compensatory effects have been documented for cis-trans elements at higher divergence levels (e.g., Landry et al., 2005; Kuo et al., 2010) where diverged interaction partners cause misexpression when combined in hybrids (reviewed in Landry et al 2007).
Translated at the population genetic level, trait-specific compensatory allelic substitution at the rQTL, in particular when changing the sign of the primary allelic substitution (i.e., sign epistasis), offers an exceptionally efficient way of changing genetic covariance between traits. The net genetic covariance between the traits is a sum of contributions to genetic covariance across all loci that simultaneously affect these traits. Given that two traits are under selection regimes that require independent variation, the existence of genetic covariance between these traits is disadvantageous because it causes a sub-optimal correlated response. In the presence of sign epistasis at the pleiotropic locus, the genetic covariance contribution of that pleiotropic locus can change sign, if the interaction is trait-specific. For example, a positive effect of allelic substitution on both traits generates positive covariance. If sign epistasis with respect to a single trait causes the pleiotropic locus to produce a negative effect on the trait in some other genetic background, the covariance generated at the pleiotropic locus becomes negative as well in that background. Given that the background generating the opposite effect is fixed, the locus’ contribution to net covariance becomes negative. Thus summed genetic covariance across loci can be radically changed without any change in the degree of pleiotropy (Pavlicev and Hansen, in prep.).
We also produced a general estimate of epistatic directionality, that is, an estimate of the curvature of the genotype-phenotype map. As mentioned above, epistatic directionality is a local estimate of the effect of epistasis on the amount of additive genetic variance. The evolutionary consequences of total genetic variance beyond one generation depend on the smoothness of the GP map. The interpretation of a composite measure of directionality within a generation, as well as its effect on the response to selection, is especially complex with sign epistasis. The smoothness of the map, i.e. the extent to which the local curvature changes through generations, is still an underexplored empirical question. QTL studies on multiple subsequent generations of the same cross offer the opportunity to trace the curvature of GP map as the intercross advances. In the present case, an estimate of epistatic directionality exists for an earlier generation of the same cross. We applied the average epistatic factor weighed by the effect size to compare the two generations. This measure equals the proportion of the additive effect compared to the total and thus reflects the overall modification of additive effects at observed loci. Values below one characterize the overall reduction of additive effects due to epistasis, predicting a smaller response to selection in that particular direction than expected in the absence of epistasis (i.e., canalization). Comparing the two available points, an early (F2F3) and a more advanced generation (F9F10) of an intercross between large (LG/J) and small (SM/J) mouse strains, reveals that the directionality of epistasis is remarkably similar for most traits, in spite of sign epistasis. We furthermore explored the pattern of epistasis in the two generations and found that the percentage of canalizing interactions decreased in the F9F10 relative to the F2F3 generation of the intercross particularly for long bone lengths. In other words, the effect of allele substitution on skeletal traits is enhanced by epistasis more in the F9F10 than in the F2F3, hence epistasis has on average a greater relative effect on additive genetic variance in the F9F10 than in the F2F3. Two likely factors causing the change in epistasis' effects over generations are increased recombination (the recombination is approximately five-fold higher in the F10 than in the F2) and the fixation of alleles as the cross advances. Both change the set of backgrounds in which substitutions occur, either by eliminating some (fixation), or by generating new backgrounds (recombination; see Weinreich et al., 2005 for a discussion of effects of recombination). Thus both phenomena also affect the results of averaging effects across substitutions and backgrounds. Detailed tracing of effects at sets of loci and their interactions through multiple generations of the cross can contribute to resolving these questions.
The particular trait relationships used in this study are classical cases of an allometric relationship between body size and the trait on a log-log scale. No doubt the power relationship between traits as well as its genetic basis and variation is particularly interesting, because it is rooted in the growth relationship (Huxley, ‘32). However the model presented here is not specific to the evolution of allometry. Any trait relationship that is based on genetic covariance and pleiotropy can be considered. In fact, changing the allometric slope on a log-log scale will in most cases affect the shape relationship on the natural scale as well. Even though the two lines were not produced from the identical stock, their stocks do represent a sample of house mouse genetic variation. Finding variation in allometry in the intercross of the two inbred selected lines suggests that selection on size in these two lines changed the allometry within the two strains.
Certainly, further plausible mechanisms can cause variation in pleiotropy other than the one specified here (Caspari, ‘52; Hadorn, ’56; Lande ’79; Lenski, ‘88a; Pyeritz, ’89; Hodgkin, ’98; Hansen, 2006; Wagner and Zhang, 2011). For the purposes of this discussion, variation in pleiotropy can be classified as allelic (alleles with different pleiotropy; e.g., Lenski, ‘88a, b; Flatt and Kawecki, 2004; Knight et al., 2006) or background-dependent (the same allele having different pleiotropy in different environmental or genetic backgrounds; e.g., Barret et al., 2009; Davies et al., 2004). Allelic variation can furthermore be of different kinds. The pleiotropy can vary owing to mutations occurring in different functional parts of the protein, affecting some of its functions, but not others. In this case the gene is pleiotropic, but mutation is not. Even if a mutation affects all functions, it may be more deleterious for one function rather than another. There are even more possibilities if the locus codes for multiple products due to alternative splicing, alternative reading frames, etc. In these situations, a mutation can affect one product without affecting the other(s). Nevertheless, the allelic variation in pleiotropy cannot be detected in a diallelic cross but requires at least three alleles to produce a reference genotype. We therefore focused on the context-dependent variation to explain the observed phenomenon. The fact that there are further ways to introduce variation in pleiotropy, however, implies further venues of research to pursue. Arguably, the different kinds of variation in pleiotropy can hold very different evolutionary potential. A more comprehensive account of possible mechanisms of variation and evolution of pleiotropy will be the subject of future study.
Finally, it is clear that QTL studies have limitations. The significance thresholds used to avoid false positives also define the degree to which small effects can be detected (Yang et al., 2010), the more so for the effects of genetic interaction. Stringent detection thresholds are particularly important in the studies that lead to detection of genes with large effects, and potentially to selection of the limited number of candidate genes to be further tested. Indeed, where the interest is in patterns of effects and interactions rather than the names and locations of genes, different approaches should be applied (Otto and Jones, 2000; Yang et al., 2010). Accumulating more true effects may outweigh the possibility that a small number of false positive effects are included in the set. The appropriate methods for the questions of this study are not yet developed, or are computationally very inconvenient. However in spite of further undetected effects, as well as possible false positives, it seems unlikely that the clear pattern of effects detected here is a sole consequence of mapping biases.
Conclusion
The goal of this study was to test a mechanistic model that enables variation in pleiotropy and the evolution of genotype-phenotype map. Our findings are consistent with the prediction that rQTL interactions are predominantly trait-specific with respect to the two traits in the relationship, supporting the heuristic model of pleiotropy based on the participation of individual genes in multiple pathways involved in the development of multiple traits. Further studies in the field of both statistical and molecular genetics will show whether and how useful this model is when thinking about the mechanisms contributing to the evolution of genotype-phenotype map structure and, in particular, the evolution of pleiotropy and genetic constraint. The model provides a link between developmental and quantitative genetics. Using this approach, the quantitative genetics may help narrowing the focus to the parts of genome that are involved in the population variation and hence evolvability of developmental mechanisms.
Supplementary Material
Figure S1: Distribution of epistatic factors in interactions with rQTL. Each plot represents interactions for one trait. Single boxes represent distribution of f across interactions with one focal rQTL. The horizontal lines are drawn at f=1 and f=−1, at which epistasis has no effect on the magnitude of additive genetic variance. Note that scale differs between the traits.
Acknowledgement
MP thanks Benedikt Hallgrímsson for the challenge and Gunter P. Wagner for numerous stimulating discussions. Jason Wolf helped with adjusting the SAS mapping script for the specificities of rQTL mapping. MP was supported by the Norwegian Research Council Grant #177857 (to T. F. Hansen). EAN was supported by a Monticello College Foundation Olin Fellowship for Women. The authors gratefully acknowledge the support of NIH grant #AR053224.
Literature cited
- Alvarez-Castro JM, Le Rouzic A, Carlborg O. How to perform meaningful estimates of genetic effects. PLoS Genet. 2008;4 doi: 10.1371/journal.pgen.1000062. e1000062. [DOI] [PMC free article] [PubMed] [Google Scholar]
- Barret RDH, Rogers SM, Schluter D. Environment specific pleiotropy facilitates divergence at the ectodysplasin locus in threespine stickleback. Evolution. 2009;63:2831–2837. doi: 10.1111/j.1558-5646.2009.00762.x. [DOI] [PubMed] [Google Scholar]
- Beldade P, French V, Brakefield PM. Developmental and genetic mechanisms for evolutionary diversification of serial repeats: eyespot size in Bicyclus anynana butterflies. J Exp Zool B (Nol Dev Evol) 2008;310B:191–201. doi: 10.1002/jez.b.21173. [DOI] [PubMed] [Google Scholar]
- Bridgham JT, Ortlund EA, Thornton JW. An epistatic ratchet constrains the direction of evolution of glucocorticoid receptor evolution. Nature. 2009;461:515–520. doi: 10.1038/nature08249. [DOI] [PMC free article] [PubMed] [Google Scholar]
- Camps M, Herman A, Loh E, Loeb LA. Genetic constraints on protein evolution. Critical Reviews in Biochemistry and Molecular Biology. 2007;42:313–326. doi: 10.1080/10409230701597642. [DOI] [PMC free article] [PubMed] [Google Scholar]
- Carter AJR, Hermisson J, Hansen TF. The role of epistatic gene interactions in the response to selection and the evolution of evolvability. Theor Popul Biol. 2005;68:179–196. doi: 10.1016/j.tpb.2005.05.002. [DOI] [PubMed] [Google Scholar]
- Caspari E. Pleiotropic gene action. Evolution. 1952;6:1–18. [Google Scholar]
- Cheverud JM, Vaughn TT, Pletscher LS, Peripato AC, Adams ES, Erickson C, King-Ellison K. Genetic architecture of adiposity in the cross of LG/J and SM/J inbred mice. Mamm Genome. 2001;12:3–12. doi: 10.1007/s003350010218. [DOI] [PubMed] [Google Scholar]
- Cheverud JM, Routman EJ, Duarte FA, van Swinderen B, Cothran K, Perel C. Quantitative trait loci for murine growth. Genetics. 1996;142:1305–1319. doi: 10.1093/genetics/142.4.1305. [DOI] [PMC free article] [PubMed] [Google Scholar]
- Cheverud JM, Ehrich TH, Vaughn TT, Koreishi SF, Linsey RB, Pletscher LS. Pleiotropic effects on mandibular morphology II: Differential epistasis and genetic variation in morphological integration. J Exp Zool (Mol Dev Evol) 2004;302B:424–435. doi: 10.1002/jez.b.21008. [DOI] [PubMed] [Google Scholar]
- Cheverud JM, Lawson HA, Fawcett GL, Wang B, Pletscher LS, Fox AR, Maxwell TJ, Ehrich TH, Kenney-Hunt JP, Wolf JB, Semenkovich CF. Diet-dependent genetic and genomic imprinting effects on obesity in mice. Obesity, in print. 2010 doi: 10.1038/oby.2010.141. [DOI] [PMC free article] [PubMed] [Google Scholar]
- Davidson EH, Erwin DH. Gene regulatory networks and the evolution of animal body plans. Science. 2006;311:796–800. doi: 10.1126/science.1113832. [DOI] [PubMed] [Google Scholar]
- Davidson EH, Erwin DH. Evolutionary innovation and stability in animal gene networks. J Exp Zool (Mol Dev Evol) 2010;314B:182–186. doi: 10.1002/jez.b.21329. [DOI] [PubMed] [Google Scholar]
- Davies AG, Bettinger JC, Thiele TR, Judy ME, McIntire SL. Natural variation in the npr-1 gene modifies ethanol responses of wild strains of C. elegans. Neuron. 2004;42:731–743. doi: 10.1016/j.neuron.2004.05.004. [DOI] [PubMed] [Google Scholar]
- Dawid A, Kiviet DJ, Kogenaru M, de Vos M, Tans SJ. Multiple peaks and reciprocal sign epistasis in an empirically determined genotype-phenotype landscape. Chaos. 2010;20:026105. doi: 10.1063/1.3453602. [DOI] [PubMed] [Google Scholar]
- Dreze M, Charloteaux B, Milstein S, Vidalain P-O, Yildirim MA, Zhong Q, Svrzikapa N, Romero V, Laloux G, Brasseur R, Vandenhaute J, Boxem M, Cusick ME, Hill DE, Vidal M. ‘Edgetic’ perturbation of a C. elegans BCL2 ortholog. Nature Methods. 2009;6:843–852. doi: 10.1038/nmeth.1394. [DOI] [PMC free article] [PubMed] [Google Scholar]
- Dobzhansky T. Genetics of natural populations. XVII. Experiments on chromosomes of Drosophila pseudoobscura from different geographical regions. Genetics. 1948;35:588–602. doi: 10.1093/genetics/33.6.588. [DOI] [PMC free article] [PubMed] [Google Scholar]
- Falconer DS, Mackay TFC. Introduction to quantitative genetics. New York: Ronald Press Co.; 1996. [Google Scholar]
- Fawcett GL, Jarvis JP, Roseman CC, Wang B, Wolf JB, Cheverud JM. Fine-mapping of obesity-related quantitative trait loci in an F9/10 advanced intercross line. Obesity. 2010;18:1383–1392. doi: 10.1038/oby.2009.411. [DOI] [PMC free article] [PubMed] [Google Scholar]
- Fay JC, McCullough HL, Sniegowski PD, Eisen MB. Population genetic variation in gene expression is associated with phenotypic variation in Saccharomyces cerevisiae. Genome Biol. 2004;5:R26. doi: 10.1186/gb-2004-5-4-r26. [DOI] [PMC free article] [PubMed] [Google Scholar]
- Flatt T, Kawecki TJ. Pleiotropic effects of methoprene-tolerant (Met), a gene involved in juvenile hormone metabolism, on life history traits in Drosophila melanogaster. Genetica. 2004;122:141–160. doi: 10.1023/b:gene.0000041000.22998.92. [DOI] [PubMed] [Google Scholar]
- Goodale H. A study of the inheritance of body weight in the albino mouse by selection. J Heredity. 1938;29:101–112. [Google Scholar]
- Hadorn E. Patterns of biochemical and developmental pleiotropy. Cold Spring Harb Symp Quant Biol. 1956;21:363–373. doi: 10.1101/sqb.1956.021.01.030. [DOI] [PubMed] [Google Scholar]
- Haley CS, Knott SA. A simple regression method for mapping quantitative trait loci in line crosses using flanking markers. Heredity. 1992;69:315–324. doi: 10.1038/hdy.1992.131. [DOI] [PubMed] [Google Scholar]
- Hansen TF. The evolution of genetic architecture. Annual Review of Ecology, Evolution, and Systematics. 2006;37:123–157. [Google Scholar]
- Hansen TF, Houle D. Measuring and comparing evolvability and constraint in multivariate characters. J Evol Biol. 2008;21:1201–1219. doi: 10.1111/j.1420-9101.2008.01573.x. [DOI] [PubMed] [Google Scholar]
- Hansen TF, Wagner GP. Modeling genetic architecture: a multilinear theory of gene interaction. Theor Popul Biol. 2001;59:61–86. doi: 10.1006/tpbi.2000.1508. [DOI] [PubMed] [Google Scholar]
- Hansen TF, Armbruster WS, Carlson ML, Pelabon C. Evolvability and genetic constraint in Dalechampia blossoms: genetic correlations and conditional evolvability. J Exp Zool B. 2003;296:23–39. doi: 10.1002/jez.b.14. [DOI] [PubMed] [Google Scholar]
- He X, Zhang J. Toward a molecular understanding of pleiotropy. Genetics. 2006;173:1885–1891. doi: 10.1534/genetics.106.060269. [DOI] [PMC free article] [PubMed] [Google Scholar]
- Hodgkin J. Seven types of pleiotropy. Int J Dev Biol. 1998;42:501–505. [PubMed] [Google Scholar]
- Houle D. Comparing evolvability and variability of quantitative traits. Genetics. 1992;130:195–204. doi: 10.1093/genetics/130.1.195. [DOI] [PMC free article] [PubMed] [Google Scholar]
- Huxley JS. Problems of relative growth. New York: Dial Press; 1932. [Google Scholar]
- Johnson NA, Porter AH. Evolution of branched regulatory genetic pathways: directional selection on pleiotropic loci accelerates developmental system drift. Genetica. 2007;129:57–70. doi: 10.1007/s10709-006-0033-2. [DOI] [PubMed] [Google Scholar]
- Jovelin R, Yan Y-L, He X, Catchen J, Amores A, Canestro C, Yokoi H, Postlethwait JH. Evolution of developmental regulation in the vertebrate FgfD subfamily. J Exp Zool (Mol Dev Evol) 2010;314B:33–56. doi: 10.1002/jez.b.21307. [DOI] [PMC free article] [PubMed] [Google Scholar]
- Kenney-Hunt JP, Wang B, Norgard EA, Fawcett G, Falk D, Pletscher LS, Jarvis JP, Roseman C, Wolf J, Cheverud JM. Pleiotropic patterns of quantitative trait loci for 70 murine skeletal traits. Genetics. 2008;178:2275–2288. doi: 10.1534/genetics.107.084434. [DOI] [PMC free article] [PubMed] [Google Scholar]
- Kim HS, Fay JC. Genetic variation in the cysteine biosynthesis pathway causes sensitivity to pharmacological compounds. PNAS. 2007;104:19387–19391. doi: 10.1073/pnas.0708194104. [DOI] [PMC free article] [PubMed] [Google Scholar]
- Kim HS, Huh J, Fay JC. Dissecting the pleiotropic consequences of a quantitative trait nucleotide. FEMS Yeast Res. 2009;9:713–722. doi: 10.1111/j.1567-1364.2009.00516.x. [DOI] [PMC free article] [PubMed] [Google Scholar]
- Knight CG, Zitzmann N, Prabhakar S, Antrobus R, Dwek R, Hebestreit H, Rainey PB. Unraveling adaptive evolution: how a single point mutation affects the protein coregulation network. Nature genetics. 2006;38:1015–1022. doi: 10.1038/ng1867. [DOI] [PubMed] [Google Scholar]
- Kondrashov AS, Sunyaev S, Kondrashov FA. Dobzhansky-Muller incompatibilities in protein evolution. PNAS. 2002;99:14878–14883. doi: 10.1073/pnas.232565499. [DOI] [PMC free article] [PubMed] [Google Scholar]
- Kramer M, Vaughn TT, Pletscher LS, et al. Genetic variation in body weight gain and composition in the intercross of Large (LG/J) and Small (SM/J) inbred strains of mice. Genet Mol Biol. 1998;21:211–218. [Google Scholar]
- Kroyman J, Mitchell-Olds T. Epistasis and balanced polymorphism influencing complex trait variation. Nature. 2005;435:95–98. doi: 10.1038/nature03480. [DOI] [PubMed] [Google Scholar]
- Kulathinal RJ, Bettencourt BR, Hartl DL. Compensated deleterious mutations in insect genomes. Science. 2004;306:1553–1554. doi: 10.1126/science.1100522. [DOI] [PubMed] [Google Scholar]
- Kuo D, Licon K, Bandyopadhyay S, Chuang R, Luo C, Catalana J, Ravasi T, Tan K, Ideker T. Coevolution within a transcriptional network by compensatory trans and cis mutations. Genome Research. 2010;20:1672–1678. doi: 10.1101/gr.111765.110. [DOI] [PMC free article] [PubMed] [Google Scholar]
- Lande R. Quantitative genetic analysis of multivariate evolution, applied to brain: body size allometry. Evolution. 1979;33:402–416. doi: 10.1111/j.1558-5646.1979.tb04694.x. [DOI] [PubMed] [Google Scholar]
- Lander ES, Botstein D. Mapping mendelian factors underlying quantitative traits using RFLP linkage maps. Genetics. 1989;121:185–199. doi: 10.1093/genetics/121.1.185. [DOI] [PMC free article] [PubMed] [Google Scholar]
- Landry CR, Wittkopp PJ, Taubes CH, Ranz JM, Clark AG, Hartl DL. Compensatory cis-trans evolution and the disregulation of gene expression in interspecific hybrids of Drosophila. Genetics. 2005;171:1813–1822. doi: 10.1534/genetics.105.047449. [DOI] [PMC free article] [PubMed] [Google Scholar]
- Landry CR, Hartl DL, Ranz JM. Genome clashes in hybrids: insights from gene. Heredity. 2007;99:483–493. doi: 10.1038/sj.hdy.6801045. [DOI] [PubMed] [Google Scholar]
- Le Rouzic A. noia: Implementation of the Natural and Orthogonal InterAction (NOIA) model. R package version 0.92. 2008 [Google Scholar]
- Le Rouzic A, Alvarez-Castro JM. Estimation of genetic effects and genotype-phenotype maps. Evol Bioinform Online. 2008;4:225–235. doi: 10.4137/ebo.s756. [DOI] [PMC free article] [PubMed] [Google Scholar]
- Leamy LJ, Pomp D, Lightfoot JT. Genetic variation in the pleiotropic association between physical activity and body weight in mice. Genet Sel Evol. 2009;41:41–53. doi: 10.1186/1297-9686-41-41. [DOI] [PMC free article] [PubMed] [Google Scholar]
- Lenski RE. Experimental studies of pleiotropy and epistasis in Escherichia coli I. Variation in competitive fitness among mutants resistant to virus T4. Evolution. 1988a;42:425–432. doi: 10.1111/j.1558-5646.1988.tb04149.x. [DOI] [PubMed] [Google Scholar]
- Lenski RE. Experimental studies of pleiotropy and epistasis in Escherichia coli. II. Compensation for maladaptive effects associated with resistance to virus T4. Evolution. 1988b;42:433–440. doi: 10.1111/j.1558-5646.1988.tb04150.x. [DOI] [PubMed] [Google Scholar]
- Li J, Ji L. Adjusting multiple testing in multilocus analyses using the eigenvalues of a correlation matrix. Heredity. 2005;95:221–227. doi: 10.1038/sj.hdy.6800717. [DOI] [PubMed] [Google Scholar]
- Macarthur JW. Selection for Small and Large Body Size in the House Mouse. Genetics. 1949;34:194–209. doi: 10.1093/genetics/34.2.194. [DOI] [PMC free article] [PubMed] [Google Scholar]
- Malmberg RL, Held S, Waits A, Mauricio R. Epistasis for fitness-related traits in Arabidopsis thaliana grown in the field and in the greenhouse. Genetics. 2005;171:2013–2027. doi: 10.1534/genetics.105.046078. [DOI] [PMC free article] [PubMed] [Google Scholar]
- Matioli SR, Templeton A. Coadapted gene complexes for morphological traits in Drosophila mercatorum. Two-loci interactions. Heredity. 1999;83:54–61. doi: 10.1038/sj.hdy.6885320. [DOI] [PubMed] [Google Scholar]
- Mitchell-Olds T, Schmitt J. Genetic mechanisms and evolutionary significance of natural variation in Arabidopsis. Nature. 2006;441:947–952. doi: 10.1038/nature04878. [DOI] [PubMed] [Google Scholar]
- Norgard EA, Roseman CC, Fawcett GL, Pavlicev M, Morgan CD, Pletscher LS, Wang B, Cheverud JM. Identification of quantitative trait loci affecting murine long bone length in a two-generation intercross of LG/J and SM/J Mice. J Bone Miner Res. 2008;23:887–895. doi: 10.1359/JBMR.080210. [DOI] [PMC free article] [PubMed] [Google Scholar]
- Norgard EA, Jarvis JP, Roseman CC, Maxwell TJ, Kenney-Hunt JP, Samocha KE, Pletscher LS, Wang B, Fawcett GL, Leatherwood CJ, Wolf JB, Cheverud JM. Replication of long bone length QTL in the F9–F10 LG, SM advanced intercross. Mamm Genome. 2009;20:224–235. doi: 10.1007/s00335-009-9174-9. [DOI] [PMC free article] [PubMed] [Google Scholar]
- Ohta AT. Coadaptive gene complexes in incipient species of Hawaiian Drosophila. The American Naturalist. 1980;115:121–132. [Google Scholar]
- Otto SP, Jones CD. Detecting the undetected: estimating the total number of loci underlying a quantitative trait. Genetics. 2000;156:2093–2107. doi: 10.1093/genetics/156.4.2093. [DOI] [PMC free article] [PubMed] [Google Scholar]
- Palmer AR. Symmetry breaking and the evolution of development. Science. 2004;306:828–833. doi: 10.1126/science.1103707. [DOI] [PubMed] [Google Scholar]
- Pavlicev M, Kenney-Hunt JP, Norgard EA, Roseman CC, Wolf JB, Cheverud JM. Genetic variation in pleiotropy: Differential epistasis as a source of variation in the allometric relationship between long bone lengths and body weight. Evolution. 2008;62:199–213. doi: 10.1111/j.1558-5646.2007.00255.x. [DOI] [PubMed] [Google Scholar]
- Pavlicev M, Le Rouzic A, Wagner GP, Cheverud JM, Hansen TF. Directionality of epistasis in a murine intercross population. Genetics. 2010;185:1489–1505. doi: 10.1534/genetics.110.118356. [DOI] [PMC free article] [PubMed] [Google Scholar]
- Pavlicev M, Cheverud JM, Wagner GP. Evolution of adaptive phenotypic variation patterns by direct selection for evolvability. Proc Roy Soc B. 2011 doi: 10.1098/rspb.2010.2113. (in press) [DOI] [PMC free article] [PubMed] [Google Scholar]
- Pavlicev, Hansen Genotype-phenotype map maximizing evolvability: modularity revisited. in prep. [Google Scholar]
- Poon A, Chao L. The rate of compensatory mutation in the DNA bacteriophage ϕX174. Genetics. 2005;170:989–999. doi: 10.1534/genetics.104.039438. [DOI] [PMC free article] [PubMed] [Google Scholar]
- Poon A, Davis BH, Chao L. The coupon collector and the suppressor mutation: estimating the number of compensatory mutation by maximum likelihood. Genetics. 2005;170:1323–1332. doi: 10.1534/genetics.104.037259. [DOI] [PMC free article] [PubMed] [Google Scholar]
- Pyeritz RE. Pleiotropy revisited: molecular explanations of a classic concept. Am J Med Gen. 1989;34:124–134. doi: 10.1002/ajmg.1320340120. [DOI] [PubMed] [Google Scholar]
- True JR, Haag ES. Developmental system drift and flexibility in evolutionary trajectories. Evolution & Development. 2001;3:109–119. doi: 10.1046/j.1525-142x.2001.003002109.x. [DOI] [PubMed] [Google Scholar]
- Tsong AE, Tuch BB, Li H, Johnson AD. Evolution of alternative transcriptional circuits with identical logic. Nature. 2006;443:415–420. doi: 10.1038/nature05099. [DOI] [PubMed] [Google Scholar]
- Vaughn TT, Pletscher LS, Peripato A, King-Ellison K, Adams E, Erickson C, Cheverud JM. Mapping quantitative trait loci for murine growth: a closer look at genetic. Genet Res. 1999;74:313–322. doi: 10.1017/s0016672399004103. [DOI] [PubMed] [Google Scholar]
- Wagner GP, Zhang J. The pleiotropic structure of the genotype-phenotype map: the evolvability of complex organisms. Nature Reviews Genetics. 2011;12:204–213. doi: 10.1038/nrg2949. [DOI] [PubMed] [Google Scholar]
- Weinreich DM, Watson RA, Chao L. Perspective: Sign epistasis and genetic constraint on evolutionary trajectories. Evolution. 2005;59:1165–1174. [PubMed] [Google Scholar]
- Wolf JB, Cheverud JM, Roseman C, Hager R. Genome-wide analysis reveals a complex pattern of genomic imprinting in mice. PLoS Genetics. 2008;6 doi: 10.1371/journal.pgen.1000091. e1000091. [DOI] [PMC free article] [PubMed] [Google Scholar]
- Wright S. Evolution in Mendelian populations. Genetics. 1931;16:97–159. doi: 10.1093/genetics/16.2.97. [DOI] [PMC free article] [PubMed] [Google Scholar]
- Wright S. The roles of mutation, inbreeding, crossbreeding and selection in evolution. Proc. 6th Int. Cong. Genet. 1932;1:356–366. [Google Scholar]
- Yang J, Benyamin B, McEvoy BP, Gordon S, Henders AK, Nyholt DR, Madden PA, Heath AC, Martin NG, Montgomery GW, Goddard ME, Visscher PM. Common SNPs explain a large proportion of the heritability for human height. Nature Genetics. 2010;42:565–571. doi: 10.1038/ng.608. [DOI] [PMC free article] [PubMed] [Google Scholar]
- Zhong Q, Simonis N, Li Q-R, Charloteaux B, Heuze F, Klitgord N, Tam S, Yu H, Venkatesan K, Mou D, Swearingen V, Yildrim MA, Yan H, Dricot A, Szeto D, Lin C, Hao T, Fan C, Milstein S, Dupuy D, Brasseur R, Hill DE, Cusick ME, Vidal M. Edgetic perturbation models of human inherited disorders. Mol Sys Biol. 2009;5:321–330. doi: 10.1038/msb.2009.80. [DOI] [PMC free article] [PubMed] [Google Scholar]
Associated Data
This section collects any data citations, data availability statements, or supplementary materials included in this article.
Supplementary Materials
Figure S1: Distribution of epistatic factors in interactions with rQTL. Each plot represents interactions for one trait. Single boxes represent distribution of f across interactions with one focal rQTL. The horizontal lines are drawn at f=1 and f=−1, at which epistasis has no effect on the magnitude of additive genetic variance. Note that scale differs between the traits.