

Abstract
Background
Reduced expression of prostate-derived Ets transcription factor (PDEF) leads to morphologic change as well as increased migration and invasiveness of prostate cancer cells. However, the clinical relevance of PDEF expression and its relationship to anti-apoptotic protein survivin is yet to be determined.
Methods
Tissue microarrays of 73 prostate carcinomas and their adjacent benign prostate tissue, as well as 50 benign prostates were evaluated for PDEF expression by immunohistochemistry. Results were confirmed in available tumor tissues using Western blot and RT-PCR. Expression of survivin in prostate carcinoma and benign tissues were determined using Western blot. Results and correlation with clinical data were statistically analyzed.
Results
Patients’ specimens with low Gleason scores (GS<5) expressed higher levels of PDEF protein and lower levels of survivin protein when compared with moderate to high Gleason scores tumors (GS >6). Patients with PDEF-positive tumor survived significantly longer (p<0.0001) than patients with PDEF-negative tumor, and the 8-year survival rate was 94% and 40%, respectively. PDEF expression was detected at the highest levels in benign tissues and was down-regulated or lost in 30 recently diagnosed prostate carcinomas. Re-expression of PDEF in prostate cancer cells inhibited survivin expression. Treatment of prostate cancer cells with methylseleninic acid resulted in restoration of PDEF expression, down-regulation of survivin and inhibition of tumor cell growth when compared with untreated controls (p< 0.05).
Conclusions
These studies demonstrated an inverse correlation between PDEF and survivin expression, and that up-regulation of PDEF was associated with a favorable prognosis in patients with clinically localized prostate cancer.
Keywords: PDEF, survivin, prostate cancer, selenium
Introduction
Expression of prostate-derived Ets transcription factor (PDEF) was identified originally in normal epithelial cells of prostate tissues [1–18]. PDEF has a critical role in human cancers of breast, ovary, colon, and prostate [1–2–3]. However, the precise role of PDEF in cancer progression remains controversial. Recent reports demonstrated that reduced expression of PDEF caused increased cell motility, invasion, and adhesion of prostate cancer cells [4]. PDEF is expressed in normal epithelial cells, while it is lost or reduced in invasive tumors of breast [6–7–8] ovary [9] and prostate [5]. One study showed that PDEF was expressed in normal prostate tissues and had a higher expression in 27% of benign prostate tumors and 40% of prostate cancers [10]. However, in prostate cancer tissues, the significance and clinical relevance of PDEF expression and its correlation with expression of the anti-apoptotic protein survivin have not been elucidated. In the present study, RT-PCR, Western blot and/or immunohistochemistry (IHC) analyses were used to evaluate expression of PDEF and survivin in prostate cancer cell and clinical samples. Long-term survival of 73 prostate cancer patients was assessed to determine whether expression of PDEF is associated with good prognosis. Furthermore, it has been reported that re-expression of PDEF in PC-3 tumor cells results in phenotypic reversal and decreased migration in three dimensional cultures [5]. In this study we determined the impact of re-expression of PDEF on survivin expression in PDEF-negative prostate tumor cell (PC-3). Finally, clinical application of methylseleninic acid (MSeA), a selenium compounds used as a chemopreventive of prostate cancers, was evaluated using prostate cancer cell lines to determine whether MSeA could induces apoptosis in tumors through up-regulation of PDEF and down-regulation of survivin expression.
In this study, we showed for the first time that up-regulation of PDEF and down-regulation of survivin were associated prolonged survival of patients with prostate cancer.
Materials and methods
Cell lines, tumor lesions and reagents
Human prostate cancer cell lines PC-3 and DU145 were grown in DMEM medium and LNCaP was grown in RPMI 1640 supplemented with 10% fetal bovine serum (FBS), 100 U/ml penicillin and 0.1 μg/ml streptomycin in a 5% CO2 incubator. Frozen and formalin-fixed, paraffin-embedded benign prostate tissues without prostate cancer/or normal prostate (n=10) and prostate cancers (n=30) were obtained from the Tissue Procurement Facility of Roswell Park Cancer Institute (RPCI) through an IRB approved protocol. Based on Gleason scores (GS), the invasive prostate cancers were categorized as low (GS 2–5), intermediate (GS 6) and High (GS 7–10) [11–12]. The tumor samples were not histologically/pathologically examined prior to RNA and protein preparation. To better understand the role of PDEF in tumor progression, we also performed a tissue microarray (TMA) containing 50 benign single spots (1.0 mm in diameter) of 50 patients and 73 single spots of prostate tumors (GS 6, n: 46; GS 7, n: 7; GS 8, n: 6; GS 10, n: 3) obtained, through the Department of Pathology, from 73 prostate cancer patients. These patients were treated at the RPCI between 1993 and 2001. Rabbit anti-human PDEF antibody was prepared in our lab [6] and used at 1:500 concentrations. Survivin antibody (FL-142) was purchased from Santa Cruz (Santa Cruz, CA, USA). Actin antibody and HRPO-conjugated goat anti rabbit antibodies were purchased from Sigma (Sigma-Aldrich St. Louis, MO, USA). MSeA was purchased from Wako Chemical USA, Inc.(Richmond, VA, USA).
Western blot analysis
Prostate cancer cell lines, 10 benign prostate samples from men without prostate cancer, frozen tumor sections from 30 recently diagnosed prostate carcinoma and their corresponding adjacent benign prostate were lysed in a lysis buffer (50 mM Tris-HCl pH 7.5, 100 mM NaCl, 2mM EDTA, 0.1% SDS, 1% NP40) containing 1% protease and phosphatase inhibitors (Sigma-Aldrich, St, Louis, MO). Samples were homogenized using a PowerGen 125 homogenizer with a 7 mm × 95 mm ST generator (Fisher) and then kept at 4°C for 30 min. Cell extracts were cleared by centrifugation at 12000 g for 30 min at 4°C and protein concentration was determined using a BCA kit (Pierce). Fifty μg total proteins from each sample were heated at 95°C for 5 min after mixing with equal volume of 2x SDS loading buffer. Samples were separated on 12% SDS–polyacrylamide gel electrophoresis (SDS–PAGE) gels and electro transferred to Immobilon-P membranes (Millipore, Bedford, MA, USA). The membrane was blocked in TBS-T buffer (20 mM Tris/HCl (pH 7.5), 0.137 M NaCl, and 0.05% Tween-20) contain 5% skim milk at room temperature for 2–3 hrs. The membranes were incubated with PDEF or survivin antibodies diluted (1:500) in TBS-T overnight at 4°C. After washing with TBS-T, the membrane was incubated in 5% skim milk in TBS-T buffer containing a secondary antibody (1:5000), for 45–60 min at room temperature with shaking. Proteins of interest were detected using a HRPL kit (National Diagnostics/LPS, Rochester, NY) or a Chemo-luminescent Reagent Plus kit (Perkin Elmer) and visualized by autoradiography after various exposure times (usually 20–120 seconds). For normalization of protein loading, the same membranes were stripped with stripping buffer (100 mM 2-mercaptoethanol, 2% sodium dodecyl sulphate, 62.5 mM Tris-HCl pH 6.7) and incubated with a monoclonal antibody against actin at 1: 1000 using the same procedure [6].
Immunohistochemistry (IHC)
Immunohistochemical analyses were performed on formalin-fixed paraffin-embedded sections of 30 recently diagnosed prostate carcinoma, their corresponding adjacent benign tissues, 10 benign prostate tissues from men without prostate cancer and sections from the TMA. Sections were de-waxed, re-hydrated, and endogenous peroxidase activity was blocked using 3% H2O2 for 10 min. Slides were microwaved in citrate buffer antigen retrieval solution(Vector Laboratories) and washed with PBS for 5 min. Slides were then blocked with 10% normal goat serum in PBS for 30 min and incubated overnight in the presence of anti-PDEF antibody (1:500). The slides were washed 3 times using PBS, incubated with biotinylated goat anti-rabbit antibody (1:100) for 30 min. The IHC staining was performed using avidin-biotin complex (ABC) method (ABC Kit, Vector Laboratories, Burlingame, CA). A positive reaction was detected using 3, diaminobezidine (DAB) (Vector Laboratories). Slides were counterstained with light green and evaluated semi-quantitatively based on the intensity and percentage of staining. The cells with nuclear PDEF staining were classified as strong (3+), moderate (2+), weak (1+) or negative (−) as compared with that of benign prostate tissue present in the same slide. The percentage of staining was divided into 3 categories: >10% positive cells, <10% positive cells and 0% positive cells. Finally, the cases were considered negative if there was no staining or <10% staining. On the other hand, cases were considered positive when >10% tumor cells stained positive. No staining was observed using isotype control IgG indicating stain specificity.
Isolation of RNA and RT-PCR analysis of PDEF expression
Total RNA was isolated from prostate cancer cell lines or frozen divided sections using Tri Reagent™ (MRC Inc., Cincinnati, OH), as previously described [6–13]. The quality of RNA was checked by electrophoresis on 1% agarose gel. Samples showing intact 28S and 18S rRNA bands were used for analysis. The mRNA expression of PDEF, survivin and glyceraldehyde-3-phosphate dehydrogenase (GAPDH) was determined using a one-step RT-PCR kit (Qiagen), as previously described [6]. The following primers were used: 5′-ATG GGC AGC GCC AGC CCG GGT C-3′ (forward) and 5′-TCA GAT GGG GTG CAC GAA CTG GT-3′ (reverse) for PDEF (1008 bp); 5′-GAG GCT GGC TTC ATC CAC TG-3′ (forward) and 5′-CAG CTG CTC GAT GGC ACG GC-3′ (reverse) for survivin (299 bp); and 5′-GCT TCC CGT TCT CAG CCT TGA C-3′ (forward) and 5′-ATG GGA AGG TGA AGG TCG GAG-3′ (reverse) for GAPDH (195 bp). PCR products were separated on a 1.8% agarose gel containing 0.01% ethidium bromide.
Re- expression of PDEF in tumor cells
To examine the PDEF-mediated growth suppression, prostate cancer cells (PC-3) were seeded (3 × 10⁵) in 6-well plates in 2 ml of DMEM medium without antibiotic one day prior to transfection. The cells were transfected with pcDNA3.1 PDEF vector constructed previously [6] or mock control pcDNA3.1 with different concentration (2 μg and 4 μg) using Lipofectamine 2000 Plus (Invitrogen) as previously described [6–9]. The level of PDEF and survivin expression was evaluated using one-step PCR and Western blot assay as described earlier.
MTT proliferation assay
Anchorage-dependent cell growth or proliferation was monitored using MTT (3-[4,5-dimethylthiazol-2-yl]-2,5-diphenyltetrazolium bromide) assay, as previously described [6–9].
Induction of apoptosis
DNA fragmentation assay was performed using a cell death detection ELISA assay kit (Roche, Indianapolis, IN). Equal numbers of PC-3 cells (3×10⁴) were seeded in a 48-well plate and transfected with Lipofectamin 2000 Plus (Invitrogen) as previously described [6–9].
Co-transfection of survivin promoter and Luciferase Reporter Assay constructs
In order to determine whether re-expression of PDEF represses promoter activity of survivin, PC-3 were seeded (5 × 10⁴ cells per well) in 24-well plates and were co-transfected with survivin promoter luciferase construct (pLuce-6270) [6–9], pRL-TK (TK promoter–Renilla luciferase construct as internal control) along with the PDEF expression vector pcDNA3.1-PDEF or control vector pcDNA3.1 using Lipofectamin™ 2000 Plus (Invitrogen) as previously described [6–9].
Treatment of PC-3 with methylseleninic acid (MSeA) and cell death/DNA fragmentation assay
Prostate cancer cell line (PC-3) was seeded at a density of 2×10⁵ cells/60-mm dish. Cells were allowed to attach to the plate overnight and then treated with two concentrations (1 μM or 4 μM) of MSeA, as previously described [14]. Cell growth/death was determined using MTT assay and trypan blue exclusion [6–9–27]. Cells were lysed, and the expression of PDEF and survivin were evaluated using western blots [6–9]. In order to evaluate the induction of apoptosis by MSeA, prostate cancer cells were seeded (3×10⁴) in a 48-well plate and treated with MSeA. Untreated cells were considered as negative control. The treated and untreated cells were lysed with 200 μl of lysis buffer/well (supplied in the cell death ELISA assay kit, Roche) for 30 min at room temperature, centrifuged and then 20 μl of supernatants were dispensed into streptavidin-coated 96-well microtiter plates in duplicate. The DNA-histon-complex was used for positive control. The reaction was followed by adding 80 μl of immuno-reagents. The immuno-reagent consisted of a mixture of anti-histone biotin and anti-DNA-HRP directed against histones H1, H2A, H2B, H3 and H4 and antibodies to nucleosome single-stranded and double-stranded DNA. The plate incubated at room temperature for 2 hrs while shaking gently. The unbound components were removed by washing 3 times with 250 μl incubation buffer. One hundred μl HRP substrate (2, 2′-azino-di-(3-ethylbenzthiazoline sulfonate) diammonium salt, ABTS) were added to each well and plates were placed on a shaker at 250 rpm for color development. Measurements were made at 405 nm against an ABTS solution as blank (reference wavelength 490 nm) using an Ultra Microplate reader (Bio-Tek Instruments).
Clinical characteristics
The records of 73 patients with prostate cancer who underwent radical prostatectomy at RPCI between 1993 and 2001 were reviewed. All pathology specimens were reviewed independently by three trained pathologists and tumors were classified according to the TNM criteria [24]. Study outcomes included overall and disease-specific survival and time to biochemical and clinical progression, each measured from the time of surgery.
Statistical analysis
A “t-test” was used to evaluate differences between samples, and significance was achieved if P value was 0.05 or less. Survival distributions were estimated using the Kaplan-Meier method [15–16] and the log-rank test was used to test for differences in survival between patients with PDEF-positive versus PDEF-negative tumors. An exact test based on the Spearman correlation was used to test for association between PDEF and Gleason score. Summarization of categorical variables (Disease status, Glyson grade, etc.) was done through computation of frequencies and relative frequencies. All analyses were done using SAS (version 9.1).
Results
Expression of PDEF mRNA and protein are inversely associated with surviving expression and cell malignancy
Evaluation of 30 recently diagnosed prostate cancers with different grades and 10 normal prostate tissues revealed that highest levels of PDEF mRNA and protein were detected in normal prostate tissues (Fig. 1A-B, Fig. 2A) which were consistent with previous reports [10–13–17–18]. Low and moderate GS cancers showed down-regulation of PDEF mRNA and protein expression (Fig. 1A-B, Fig. 2B-C), but high GS cancers showed total loss of PDEF expression (Fig. 1A-B, Fig. 2D). In contrast, expression of survivin was very low or undetectable in normal prostate tissues. However, survivin expression was markedly increased in all tumors with the highest level of expression in high GS in comparison to moderate GS or low GS tumors (Fig. 1A-B). IHC of the TMA section produced similar results showing the highest PDEF expression in benign prostates, PDEF down-regulation in low GS or moderate GS and complete loss in high GS (Fig. 3).
Figure 1. Expression of PDEF and survivin in normal and prostate lesions and cell lines.


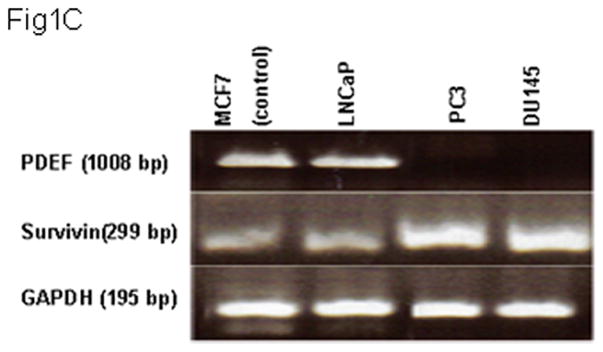
Total RNA and protein lysates were extracted from 10 normal, 30 prostate cancer tissues and cell lines. Samples were analyzed by one-step RT-PCR and western blot, respectively. Panels 1A and 1B are representative images of one-step RT-PCR and western blot, respectively. Samples of prostate tumor tissues were divided into low Gleason score (LGS; n=10), moderate Gleason score (MGS; n=10) and high Gleason score (HGS; n=10). Representative data are presented from triplicate experiment. GAPDH or actin expression was determined as internal controls. Panels 1C and 1D represent results of triplicate experiments of PDEF and survivin expression in multiple prostate cancer cells using one-step RT-PCR and western blot analyses, respectively.
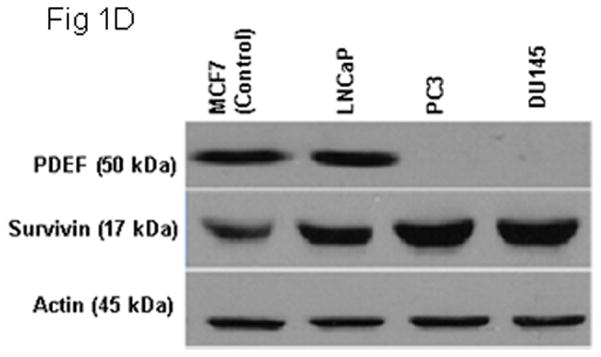
Figure 2. Down-regulation and loss of PDEF expression in prostate cancer lesions compared to normal prostate tissues.

Human prostate tissues were subjected to immunohistochemistry (IHC) analysis using rabbit anti-human PDEF antibody. The dark brown color represents positive PDEF staining. Slides were evaluated at 200X original magnifications. PDEF protein expression is reduced or negative in invasive prostate cancer compared with normal prostate tissue. Panel 2A shows a strong nuclear immunoreactivity of PDEF immunohistochemical staining in normal epithelial cells of prostate tissues. Panel 2B is an example of tumor with (LGS) that have high level of PDEF expression. Panel 2C is an example of tumor with (MGS), moderate differentiated infiltrating carcinomas. Panel 2D is an example of tumor with (HGS), poorly differentiated infiltrating carcinomas that show a complete loss of PDEF staining.
Figure 3. Loss of PDEF protein expression in TMA of prostate cancer lesions compared to normal prostate tissues.
Human prostate tissue arrays were subjected to IHC analysis. The dark brown color represents PDEF positive staining. Slides were evaluated at 200X original magnifications. PDEF protein expression is reduced or negative in invasive prostate cancer compared with benign prostate tissue. Panel 3A shows a strong nuclear immunoreactivity of PDEF immunohistochemical staining in normal epithelial cells of prostate tissues. Panel 3B is an example of tumor with (LGS) that have high level of PDEF expression. Panel 3C is an example of tumor with (MGS), moderate differentiated infiltrating carcinomas. Panel 3D is an example of tumor with (HGS), poorly differentiated infiltrating carcinomas that show a complete loss of PDEF staining.
Intensity and percent of PDEF expression was reduced during the transition from low grade to high grade prostate cancer
PDEF expression was evaluated by immunohistochemical examination in TMA slides containing 73 cores of prostate cancer and 50 cores of benign prostate tissue. As shown in Table 1, all of the benign prostate tissue expressed strong (3+) 60% and moderate (2+) 40% PDEF, respectively. In contrast, PDEF expression was completely lost in 22 % of tumors with GS6, 33% tumors with GS 7, 33% tumors with GS 8 and 67% tumors with GS 10. The rest of prostate tumors expressed variable levels of PDEF (mostly weak or moderate) as compared to benign prostate tissue on in the same slide. Only 7 % of tumors GS 6 and 6% of tumor GS 7 strongly expressed PDEF. Quantification of immuno-staining intensity (Table 1) and correlation with the pathological characteristics confirmed a significant inverse correlation between PDEF expression and Gleason scores (p <0.001).
Table 1.
Distribution of intensity of PDEF staining in Gleason Score.
| PDEF Intensity score | Benign (%) n =50 | Gleason Score (%) | ||||
|---|---|---|---|---|---|---|
| 2–5 |
6 |
7 |
8 |
10 |
||
| n=0 | n =46 | n = 18 | n = 6 | n = 3 | ||
| Negative (−) | 0 | 0 | 22 | 33 | 33 | 67 |
| Weak (1+) | 0 | 0 | 43 | 38 | 33 | 0 |
| Moderate (2+) | 40 | 0 | 28 | 22 | 33 | 33 |
| Strong (3+) | 60 | 0 | 7 | 6 | 0 | 0 |
To test whether prostate cancer cell lines may show similar patterns, PDEF and survivin expression were assessed in LNCaP, PC-3 and DU145 [21]. Breast cancer cell line (MCF-7) was used as a positive control for the expression of PDEF [6–8]. Similar levels of PDEF or survivin mRNA and proteins were detected in MCF-7 and LNCaP cell lines (Fig. 1C-D). PC-3 and DU145 showed down-regulation or loss of PDEF expression and up-regulation of survivin (Fig. 1C-D). These observations support the previous report [5–17–18] that PDEF expression is inversely correlated with GS. Low GS prostate tumors expressed higher levels of PDEF protein and lower levels of survivin in comparison to high GS tumors. In addition, PDEF expression was high in the non-invasive prostate cell line, while the invasive prostate cell lines completely lost PDEF expression.
Re-expression of PDEF inhibits cell growth and down-regulates endogenous survivin
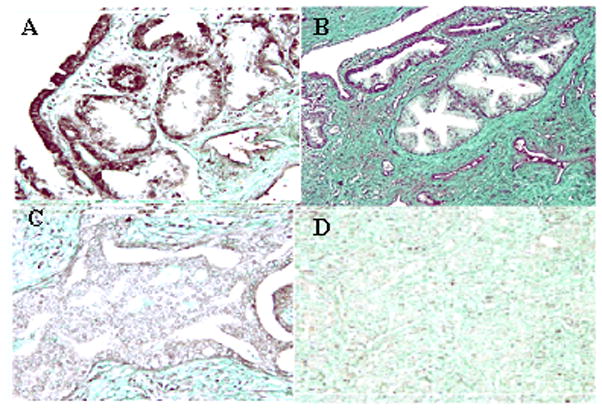
PDEF-negative prostate cell line (PC-3) was transfected with PDEF using pcDNA3.1 PDEF construct or mock control pcDNA3.1 vector (2 and 4 μg vectors). Proliferation of these tumor lines was then determined by MTT assay. As shown in (Fig. 4A) re-expression of PDEF, when using 4 μg vector for transient transfection, resulted in a significant inhibition of PC-3 cell proliferation after 48 hr when compared to mock PC-3 cells (p = 0.000033). Similar observation was made when MDA-MB231 [6] and P11 (2008) ovarian cancer cell line [9] were transfected with the PDEF construct. In addition, RT-PCR analysis revealed higher expression of PDEF and loss of survivin expression (Fig. 4B) leading to apoptosis of PDEF positive cells (Fig. 4C, p = 0.0094). Cotransfection of survivin promoter along with PDEF significantly decreased survivin promoter-driven luciferase activity (Fig. 4D, p = 0.000013).
Figure 4. Re-expression of PDEF inhibits cell growth, induces apoptosis, down-regulates survivin promoter activity and endogenous survivin expression in a highly invasive PC-3 prostate cancer cell line.
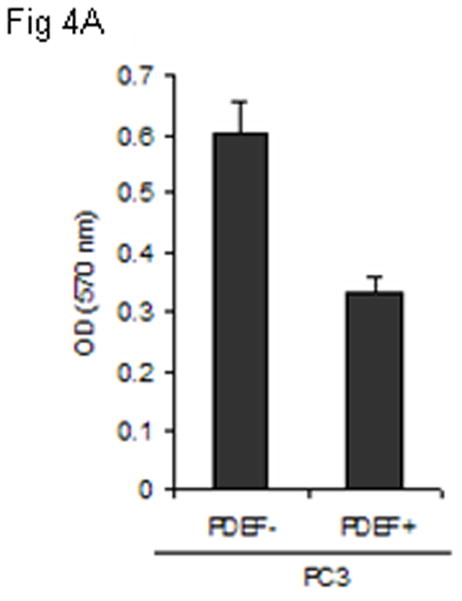


Panel 4A: MTT assay performed for the detection of proliferation pcDNA3.1 PDEF PC-3 cells (PDEF+) and mock pcDNA3.1 PC-3 cells (PDEF−). Cell proliferation of PC-3 significantly inhibited (p = 0.000033). Panel 4B: Re-expression of PDEF (using 4 μg pcDNA3.1 PDEF) efficiently inhibited endogenous survivin expression. The relative expression of PDEF and survivin after normalization to GAPDH are shown. Total mRNA extracts were collected 48 hr post-transfection and analyzed by one-step RT-PCR (Qiagen). Panel 4C: Demonstrate the detection of apoptosis in pcDNA3.1 PDEF P11 cells (PDEF+) and mock pcDNA3.1 PC-3 by cell death detection ELISA assay. High level of apoptosis was induced when 4 μg of pcDNA3.1 PDEF vector was used for transfection (p = 0.0094). Panel 4D: Luciferase assay showing that re-expression of PDEF in the PDEF-negative PC-3 prostate cancer cell line significantly decreased survivin promoter-driven luciferase activity. Means ± SD derived from 3 independent assays (p = 0.000013).
PDEF expression in prostate cancer is associated with prolonged survival
Of 73 prostate cancer patients, 20 patients showed loss of PDEF expression in their tumors (Table 2). The overall survival estimation of prostate cancer patients by PDEF expression is shown in Fig. 5. Eight year survival was 94% in patients with PDEF expression but it was 40% in patients with PDEF negative tumors (Table 2, pFig. 6). The survival difference was highly significant (< 0.0001).
Table 2.
PDEF expression in prostate tumors correlated with better prognosis for prostate cancer patients.
| Groups | Sample size | Median Survival (mo) | 2years survival | 3years survival | 8years survival |
|---|---|---|---|---|---|
| PDEF negative | 20 | 76.5% | 95% | 85% | 40% |
| PDEF positive | 53 | Not reached | 100% | 100% | 94% |
Figure 5. The overall survival of prostate cancer patients by PDEF expression.
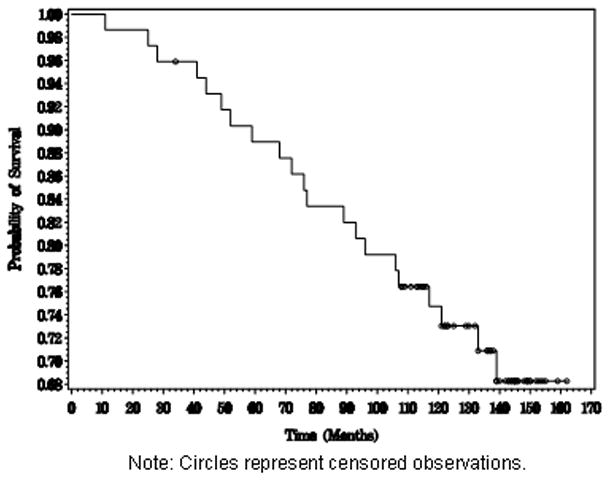
Estimation of the overall survival distribution and the survival distribution of each PDEF group was done using the Kaplan-Meier method.
Figure 6. PDEF expression is associated with longer survival of prostate cancer patients.

Kaplan-Meier survival curves for prostate cancer patients with PDEF-positive vs. PDEF-negative tumors are shown. The dotted line represents survival probability for the 53 patients with PDEF-positive tumors and the solid line shows the survival probability for the 20 patients with PDEF-negative tumors. The difference in the survival probability for the two patients groups is highly statistically significant with a P value less than 0.0001.
Re-activation of PDEF after treatment with MSeA
It has been shown that MSeA induces tumor cell apoptosis [14–19–20], increases PDEF expression and down-regulates survivin expression in ovarian cancer cells [9]. To determine whether MSeA treatments produces similar results in prostate cancer cells, human PDEF-negative prostate cancer cells (PC-3) were cultured in the presence or absence of MSeA for 72 hrs. MSeA treatment decreased cell proliferation (Fig. 7A; P=0.00018), changed cell morphology (Fig. 7B), induced expression of PDEF and down regulated expression of survivin (Fig. 7C and 7D p≤ 0.0019). Changes in cell morphology were evident by changes in cell projections and reduced cell-to-cell adhesion which was not associated with cell migration or invasiveness because presence of MSeA induced apoptosis in tumor cells, as determined by DNA fragmentation assay using cell death detection ELISA assay kit (Roche, Indianapolis, IN). These data suggest that MSeA causes apoptosis through up regulation of PDEF expression that reduces survivin expression.
Figure 7. The effect of MSeA treatment on PDEF and survivin levels in PC-3 cells.
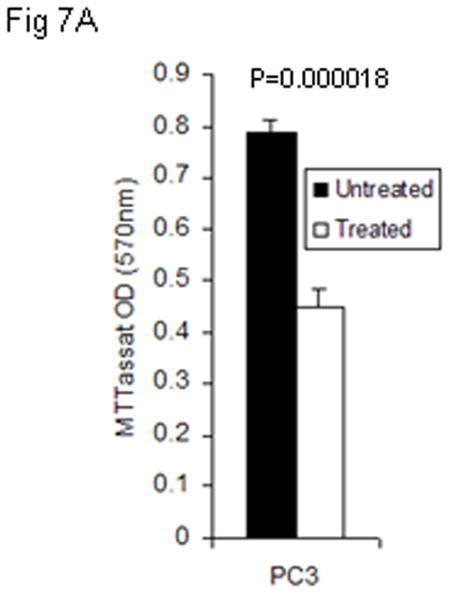

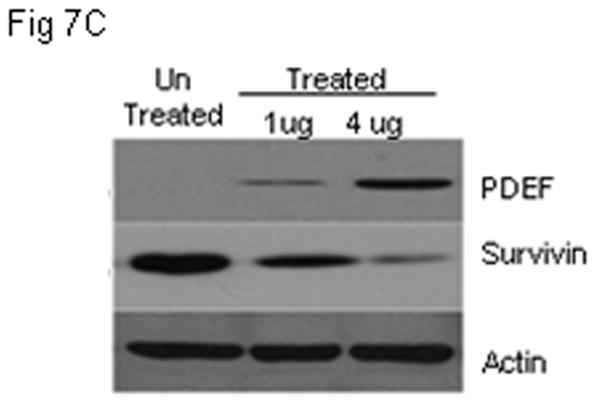

Panel 7A shows that re-expression of PDEF in PDEF-negative PC-3 prostate cancer cells after treatment with MSeA. Panel 7B, shows the morphology change of PC-3 cells following 48 hrs treatment with MSeA. Representative images from 3 independent experiments are shown at 200 X magnifications using light microscopy. Panel 7C, shows western blot analysis of re-expressed level of PDEF and down regulated level of survivin after treatment of prostate cancer cells PC-3 with 4μM MSeA. Panel 7D, shows induction of apoptotic cell death after treatments with MSeA. After MSeA treatment, the highest induction of apoptosis level was associated with up regulation of PDEF and down regulation of survivin.
Discussion
While expression of PDEF and survivin in human tumors has been studied for many years, the prognostic significance of their differential expression in prostate cancer progression has not yet been elucidated [4]. The Ets family transcription factors function as transcriptional activators or repressors by binding to the “GGAA/T” DNA motif of target genes which play important roles in development, angiogenesis, cell proliferation, differentiation, apoptosis, transformation and tumor invasion [26]. There is a general consensus in the literature on the critical role of PDEF in human carcinomas, however; controversy exists regarding the role of PDEF in tumorigenesis [4–10–25]. While one group reported positive expression of PDEF in 27% of benign prostate tumors and 40% of prostate adenocarcinoma [10], another group reported that PDEF was lost in high grade prostate cancers, and decreased PDEF expression was associated with increased MMP9 expression [5]. In addition, reduction in PDEF expression increased the expression of mesenchymal genes such as vimentin and N-cadherin, and enhanced invasiveness of prostate cancer cells [4]. These studies identified PDEF as a new transcription factor that directly regulates p21/CIP1 expression under non-stressed conditions. Our findings are consistent with the latter, showing that reduced expression of PDEF along with increased expression of survivin is correlated with tumorigenesis and poor prognosis [22–23]. The highest levels of PDEF mRNA and protein were detected in benign prostate tissues and LNCaP. However, PDEF mRNA and protein levels were down regulated in prostate tumors with low and moderate GS and completely lost in tumors with high GS lesions or in PC-3 and DU145 (Fig. 1 and Fig. 2). Decreases in % and intensity of PDEF expression were associated with increase in GS confirming aggressiveness of the disease.
Consistent with pervious report [5–6–9], we found that re-expression of PDEF in PC-3 inhibited cell growth and inhibited survivin expression. Although there is no Ets binding sites (EBS) in the core promoter region of survivin, inspection of the 2.8 kb DNA promoter region of survivin revealed 28 EBS with a perfect match to the core motif recognized by Ets transcription factors (unpublished observation). Thus, PDEF as a transcription factor may bind to these sites and inhibit survivin expression. This conclusion was supported further since MSeA-induced apoptosis of prostate tumors and this effect was mediated through the induction of PDEF expression and subsequent down-regulation of survivin. These findings suggest that PDEF and survivin expression are related to tumor cell survival and aggressiveness and are consistent with previous reports that showed a reverse correlation between PDEF and survivin expression in human breast cancer [6] and ovarian cancer [9]. Most importantly, disease outcome studies in 73 prostate cancer patients, who underwent radical prostatectomy for clinically localized disease and had variable levels of PDEF expression in their cancer specimens, revealed that expression of PDEF was associated with longer survival.
In summary, these results suggest that enhanced expression of PDEF and reduced expression of survivin in patients with prostate cancer may predict favorable prognosis.
Acknowledgments
We acknowledge RPCI Tissue Procurement Facility and Pathology for making this research possible.
This work was supported by the NIH CA109481, the Susan Komen Foundation BCTR63806 grants (F. Li) and IRG-02-197-06 American Cancer Society grants (R. G. Azrak).
References
- 1.Oettgen P, Finger E, Sun Z, Akbarali Y, Thamrongsak U, Boltax J, Grall F, Dube A, Weiss A, Brown L, Quinn G, Kas K, Endress G, Kunsch C, Libermann TA. PDEF, a novel prostate epithelium-specific transcription factor, interacts with the androgen receptor and activates prostate-specific antigen gene expression. J Biol Chem. 2000;275:1216–1225. doi: 10.1074/jbc.275.2.1216. [DOI] [PubMed] [Google Scholar]
- 2.Moussa O, Turner DP, Feldman RJ, Sementchenko VI, McCarragher BD, Desouki MM, Fraig M, Watson DK. PDEF is a negative regulator of colon cancer cell growth and migration. J Cell Biochem. 2009;108:1389–98. doi: 10.1002/jcb.22371. [DOI] [PMC free article] [PubMed] [Google Scholar]
- 3.Kas K, Finger E, Grall F, Gu X, Akbarali Y, Boltax J, Weiss A, Oettgen P, Kapeller R, Libermann TA. ESE-3, a novel member of an epithelium-specific ets transcription factor subfamily, demonstrates different target gene specificity from ESE-1. J Biol Chem. 2000;275:2986–98. doi: 10.1074/jbc.275.4.2986. [DOI] [PubMed] [Google Scholar]
- 4.Gu X, Zerbini LF, Otu HH, Bhasin M, Yang Q, Joseph MG, Grall F, Onatunde T, Correa RG, Libermann TA. Reduced PDEF expression increases invasion and expression of mesenchymal genes in prostate cancer cells. Cancer Res. 2007;67:4219–4226. doi: 10.1158/0008-5472.CAN-06-3689. [DOI] [PubMed] [Google Scholar]
- 5.Johnson TR, Koul S, Kumar B, Khandrika L, Venezia S, Maron PD, Meacham RB, Koul HK. Loss of PDEF, a prostate-derived Ets factor is associated with aggressive phenotype of prostate cancer: regulation of MMP 9 by PDEF. Mol Cancer. 2010;9:148. doi: 10.1186/1476-4598-9-148. [DOI] [PMC free article] [PubMed] [Google Scholar] [Retracted]
- 6.Ghadersohi A, Dalin P, Fayazi Z, Hicks DG, Winston JS, Li F. Prostate-derived Ets transcription factor (PDEF) downregulates survivin expression and inhibit breast cancer cell growth in vitro and xenograft tumor formation in vivo. Breast Cancer Res Treat. 2007;102:19–30. doi: 10.1007/s10549-006-9314-9. [DOI] [PMC free article] [PubMed] [Google Scholar]
- 7.Turner DP, Moussa O, Sauane M, Fisher PB, Watson DK. Prostate-derived Ets factor is a mediator of metastatic potential through the inhibition of migration and invasion in breast cancer. Cancer Res. 2007;67:1618–25. doi: 10.1158/0008-5472.CAN-06-2913. [DOI] [PubMed] [Google Scholar]
- 8.Feldman RJ, Sementchenko VI, Gayed M, Fraig MM, Watson DK. Pdef expression in human breast cancer is correlated with invasive potential and altered gene expression. Cancer Res. 2003;63:4626–31. [PubMed] [Google Scholar]
- 9.Ghadersohi A, Odunsi K, Zhang S, Azrak RG, Bundy BN, Manjili MH, Li F. Prostate-derived Ets transcription factor as a favorable prognostic marker in ovarian cancer patients. Int J Cancer. 2008;123:1376–1384. doi: 10.1002/ijc.23667. [DOI] [PMC free article] [PubMed] [Google Scholar]
- 10.Sood AK, Saxena R, Groth J, Desouki MM, Cheewakriangkrai C, Rodabaugh KJ, Kasyapa CS, Geradts J. Expression characteristics of prostate-derived Ets factor support a role in breast and prostate cancer progression. Hum Pathol. 2007:1628–1638. doi: 10.1016/j.humpath.2007.03.010. [DOI] [PMC free article] [PubMed] [Google Scholar]
- 11.Gleason DF, Mellinger GT. Prediction of Prognosis for prostatic adenocarcinoma by combined histological grading and clinical staging. J Urol. 1974;111:58–64. doi: 10.1016/s0022-5347(17)59889-4. [DOI] [PubMed] [Google Scholar]
- 12.Gleason DF. Histology grading of prostate cancer. A perspective. Human Path. 1992;23:273–279. doi: 10.1016/0046-8177(92)90108-f. [DOI] [PubMed] [Google Scholar]
- 13.Ghadersohi A, Sood AK. Prostate epithelium-derived Ets transcription factor mRNA is over expressed in human breast tumors and is a candidate breast tumor marker and a breast tumor antigen. Clin Cancer Res. 2001;7:2731–8. [PubMed] [Google Scholar]
- 14.Zhao H, Whitfield LM, Xu T, Botstein D, Brooks JD. Diverse Effects of Methylseleninic Acid on the Transcriptional Program of Human Prostate Cancer Cells. Mol Biol Cell. 2004;15:506–19. doi: 10.1091/mbc.E03-07-0501. [DOI] [PMC free article] [PubMed] [Google Scholar]
- 15.Kaplan EL, Meir P. Nonparametric estimation from incomplete observations. J Am Stat Assoc. 1958;53:457–86. [Google Scholar]
- 16.Peto R, Pike MC, Armitage P, Breslow NE, Cox DR, Howard SV, Mantel N, McPherson K, Peto J, Smith PG. Design and analysis of randomized clinical trails requiring prolonged observation of each patient. Br J Cancer. 1977;35:1–39. doi: 10.1038/bjc.1977.1. [DOI] [PMC free article] [PubMed] [Google Scholar]
- 17.Tsujimoto Y, Nonomura N, Takayama H, Yomogida K, Nozawa M, Nishimura K, Okayama A, Nozaki M, Aozasa K. Utility of immunohistochemical detection of prostate-specific Ets for the diagnosis of benign and malignant prostatic epithelial lesions. Int J Urol. 2002;9:167–72. doi: 10.1046/j.1442-2042.2002.00444.x. [DOI] [PubMed] [Google Scholar]
- 18.Nozawa M, Yomogida K, Kanno N, Nonomura N, Miki T, Okuyama A, Nishimune Y, Nozaki M. Prostate-specific transcription factor hPSE is translated only in normal prostate epithelial cells. Cancer Res. 2000;60:1348–52. [PubMed] [Google Scholar]
- 19.Clement Ip. Lessons from Basic Research in Selenium and Cancer Prevention. J Nutr. 1998;128:1845–4. doi: 10.1093/jn/128.11.1845. [DOI] [PubMed] [Google Scholar]
- 20.Azrak RG, Frank CL, Ling X, Slocum HK, Li F, Foster BA, Rustum YM. The mechanism of methylselenocysteine and docetaxel synergistic activity in prostate cancer cells. Mol Cancer Ther. 2006;5:2540–8. doi: 10.1158/1535-7163.MCT-05-0546. [DOI] [PMC free article] [PubMed] [Google Scholar]
- 21.Witkowski CM, Rabinovitz I, Nagle RB, Affinito KS, Cress AE. Characterization of integrin subunits, cellular adhesion and tumorgenicity of four human prostate cell lines. J Cancer Res Clin Oncol. 1993;119:635–696. doi: 10.1007/BF01215981. [DOI] [PMC free article] [PubMed] [Google Scholar]
- 22.Li F. Role of survivin and its splice variants in tumourigenesis. Br J Cancer. 2005;92:212–6. doi: 10.1038/sj.bjc.6602340. [DOI] [PMC free article] [PubMed] [Google Scholar]
- 23.Li F. Survivin Study: What is the next wave? J Cell Physiol. 2003;197:8–29. doi: 10.1002/jcp.10327. [DOI] [PubMed] [Google Scholar]
- 24.Mostofi FK, Sesterhenn I, Davis CJ, Sobin LH. Histological typing of prostate tumors, World Health Organization, International histological classification of tumors. 2. Springer; Berlin: 2002. [Google Scholar]
- 25.Gunawardane RN, Sgroi DC, Wrobel CN, Koh E, Daley GQ, Brugge JS. Novel role for PDEF in epithelial cell migration and invasion. Cancer Res. 2005;65:11572–80. doi: 10.1158/0008-5472.CAN-05-1196. [DOI] [PMC free article] [PubMed] [Google Scholar]
- 26.Seth A, Watson DK. ETS transcription factors and their emerging roles in human cancer. Eur J Cancer. 2005;41:2462–78. doi: 10.1016/j.ejca.2005.08.013. [DOI] [PubMed] [Google Scholar]
- 27.Azrak RG, Frank CL, Ghadersohi A, Rustum YM. Silencing survivin results in synergy between methylseleninic acid and paclitaxel against skov3 ovarian cancer cells. Cancer Biol Ther. 2008;7:1901–8. doi: 10.4161/cbt.7.12.6939. [DOI] [PubMed] [Google Scholar]