

Abstract
The functional avidity of a cytotoxic T lymphocyte (CTL) is known to be a critical determinant of the efficacy with which it clears pathogens. High avidity cells, which are by definition highly sensitive to peptide antigen, are superior for elimination of viruses and tumours. Our studies have established the ability of T cells to undergo avidity modulation as a result of antigen encounter. High and low avidity cells established in this manner exhibit significant differences in the amount of peptide required to elicit effector function. However, how signalling is regulated in these cells as it relates to the control of peptide sensitivity remains to be defined. To address this question, we compared T-cell receptor (TCR) signal transduction events in high and low avidity CTL generated from OT-Irag2− TCR transgenic mice. Our data suggest that divergent signalling is initiated at the TCR-associated CD3ζ, with low avidity CTL requiring higher amounts of pMHC to achieve threshold levels of phosphorylated CD3ζ compared with high avidity CTL. Further, this difference is transduced further downstream to mitogen-activated protein kinase and Ca2+ signalling pathways. These results suggest that regulated control of the initiation of TCR signalling in high versus low avidity cells determines the amount of peptide required for T-cell activation.
Keywords: CD8, CD8+ effector cell, differentiation, functional avidity, signalling
Introduction
Interaction between a T-cell receptor (TCR) and its cognate peptide results in a series of biochemical events inside the cell culminating in proliferation, cytokine production, and release of lytic granules. Engagement of TCR with its ligand leads initially to the activation of the Src-tyrosine kinases p56Lck and p59fyn, which is a critical step in the TCR signal transduction cascade.1,2 Signalling downstream of the engaged TCR is initiated when p56Lck phosphorylates immunoreceptor tyrosine-based activation motifs (ITAMs) within the TCR-associated CD3ζ complex.3,4 Phosphorylation of the ITAMs provides a docking site for ZAP-70, which is in turn phosphorylated by p56Lck5. Activated ZAP-70 then phosphorylates several downstream molecules, including the key adapter proteins linker for activation of T-cell (LAT) and SH2-domain-containing leukocyte protein of 76 kDa (SLP). The formation of the signalosome containing LAT and adaptor proteins such as Gads and SLP-76 augments Ca2+ mobilization as well as activating the mitogen-activated protein kinase (MAPK) signalling pathway.6,7 Phosphorylated forms of MAPK-extracellular signal-regulated kinase (ERK) (p44 and p42, known as ERK1 and ERK2, respectively), function in a protein kinase cascade that plays a critical role in the regulation of various cell activities including cytokine production.8 Efficient and sustained phosphorylation of ERK is responsible for the subsequent activation of various downstream transcription factors such as activator protein-1 leading to transactivation of genes for many cellular functions.9
Our recent studies have demonstrated that T cells can tune their peptide sensitivity in response to antigen stimulation.10–12 This tuning results in the generation of cells that differ significantly with respect to the amount of peptide required for both proliferation and elicitation of effector function. The sensitivity of a CD8+ effector cell for peptide antigen is a critical determinant of in vivo efficacy.13–18 As such, understanding how T cells regulate their sensitivity to peptide antigen is of significant importance. Our understanding of the molecular regulation of avidity at the individual cell level is limited. Previous reports support a role for TCR affinity in determining the T cell's requirement for peptide.15,19 However, this is clearly not the defining factor because TCR avidity measurements do not always correlate with the sensitivity to peptide antigen.20–28 In addition, cytotoxic T lymphocytes (CTL) of disparate avidity can be generated from populations of cells that bear an identical TCR.11,12,27,29 These results suggest that T cells may actively regulate the TCR signal transduction cascade as a mechanism to control their sensitivity to peptide. Hence, in the present study we addressed the TCR signal transduction events that control the peptide sensitivity in high and low avidity CTL. Given the complexity of this pathway, there are a number of possible steps at which modifications could occur. For example, in low avidity CTL a number of TCR engagement events may fail to initiate signalling, resulting in a low sensitivity to peptide antigen. Alternatively, dysregulation of feedback/amplification mechanisms may attenuate the signal resulting in differences in downstream kinases and activation of transcription factors.
To discriminate among these possibilities, we analysed TCR-mediated signalling in high versus low avidity lines that were generated from OT-Irag2− TCR transgenic mice. In this model, cells modulate sensitivity in response to the amount of pMHC used for activation. Our studies reveal that the increased amount of peptide required for activation by low versus high avidity CTL is the result of the necessity for increased amounts of peptide/MHC for initiation of signalling to occur. Potential mechanisms to explain this finding are discussed.
Materials and methods
Mice and peptides
C57BL/6 mice were obtained from the Frederick Cancer Research and Development Center (Frederick, MD). OT-1 TCR transgenic rag2− mice30 were purchased from Taconic (Germantown, NY). All experiments in this study comply with the institutional guidelines approved by the Wake Forest Animal Care and Usage Committee. EL4 cells are a C57BL/6-derived thymoma cell line. The ovalbumin 257–264 (Ova257–264) peptide (SIINFKEL) was synthesized at the Comprehensive Cancer Center Protein Analysis Core Laboratory at Wake Forest University School of Medicine.
Generation, maintenance of CTL lines and peptide dose–response curve
For generation of OT-I TCR transgenic CTL lines, 5 × 10⁵ OT-I TCR transgenic splenocytes were co-cultured with 5 × 10⁶ C57BL/6 splenocytes (2000 rad) previously pulsed with 10−5 m or 10−9 m Ova257–264 peptide. Cultures were maintained in 24-well plates containing RPMI-1640 medium supplemented with 2 mm l-glutamine, 0·1 mm sodium pyruvate, non-essential amino acids, 100 U/ml penicillin, 100 μg/ml streptomycin (BioWhittaker, Walkersville, MD), 2-mercaptoethanol (0·05 mm), 10% fetal bovine serum and 10% T-stim (BD Biosciences, San Jose, CA). The CTL cultures were re-stimulated weekly with peptide-pulsed antigen-presenting cells (APC) as described previously.11 Functional avidity of the established CTL lines was determined by intracellular cytokine staining for interferon-γ (IFN-γ) following stimulation in the presence of Golgi Plug (1 : 1000; BD Biosciences). Briefly, CTL were plated at 1 × 10⁵/well in a 96-well plate. EL4 cells, previously pulsed with titrated concentrations of Ova257–264 peptide and washed three times with PBS, were added at 5 × 10⁴ to 1 × 10⁵ cells/well. Plates were incubated for 5 hr at 37° in a 5% CO2 incubator. After incubation, cells were surface stained with anti-CD8α-peridinin chlorophyll protein Cy5.5 (BD Biosciences) followed by permeabilization with Cytofix/Cytoperm (BD Biosciences) and staining with anti-mouse IFN-γ allophycocyanin (BD Biosciences). The CTL in all the experiments were used on day 7 post-stimulation following removal of dead cells by passage over a Histopaque gradient (Sigma, St. Louis, MO). For TCR internalization studies, high and low avidity cells were cultured in the presence of EL4 cells pulsed with titrated concentrations of peptide for 5 hr. The TCR expression levels were quantified using antibody against Vβ5.1/5.2. All samples were acquired on a FACSCalibur (BD Biosciences).
Cell stimulation, lysis, immunoprecipitation and immunoblotting
The CTL were stimulated with EL4 cells pulsed with Ova257–264 peptide (10−6, 10−9 or 10−12 m). A total of 5 × 10⁵ EL4 cells were incubated with 5 × 10⁵ to 1 × 10⁶ high avidity (represented as −9MCTL) or low avidity (represented as −5MCTL) CTL at 37° for the indicated times. The CTL were lysed with 1× Cell Lysis Buffer containing protease inhibitors (Cell Signaling Technology, Danvers, MA). For CD3ζ immunoprecipitation, insoluble material was pelleted, and the supernatant was incubated with 5 μg anti-CD3ζ (clone 6B10.2; Santa Cruz Biotechnology, SantaCruz, CA) and 50 μl 50% protein G–Sepharose (Pharmacia, Uppsala, Sweden). Cell lysates or immunoprecipitates were solubilized in reducing Laemmli sample buffer (BioRad), resolved by 10% SDS–PAGE and blotted onto nitrocellulose membranes (BioRad, Benicia, CA). Blots were probed with anti-phosphotyrosine (4G10; Upstate Biotechnology, Lake Placid, NY) or anti-CD3ζ (6B10.2; Santa Cruz Biotechnology) and horseradish peroxidase-conjugated secondary antibody followed by detection with Super Signal Chemiluminescent Reagent (Pierce, Rockford, IL). For measurement of phosphorylation of p56Lck, stimulated cells were lysed and transferred to the nitrocellulose membrane before probing them with specific antibodies (PY 416; Cell Signaling) and blots were developed as described above. Quantification was performed using multi gauge V3.0 software.
Flow cytometric detection of signalling events
For intracellular analysis of phosphorylation events in stimulated CTL,31 cells were fixed with 4% paraformaldehyde (PFA) for 10 min at 37° after stimulation and permeabilized with 90% ice-cold methanol. For staining of total protein, resting cells were permeabilized with ice-cold methanol. Permeabilized cells were washed extensively with PBS and stained with anti-CD8 antibody and one of the following: anti-p56Lck-phycoerythrin conjugate (BD phosflow, SanJose, CA), anti-LAT (Cell Signaling), anti-pLAT (PY 191; Cell Signaling), or anti-ppERK AF647 conjugate (p44/42 MAPK; Cell Signaling). For detecting unconjugated antibodies, anti-rabbit IgG-allophycocyanin secondary antibody (1 : 1000; Molecular Probes, Carlsbad, CA) was used.
Ca2+ flux
Measurement of intracellular free Ca2+ was carried out using the calcium-sensitive dye Fluo-3 acetoxymethyl ester (Fluo-3 AM). Resting high or low avidity CD8+ T cells were loaded with 5 μm Fluo3 AM (Invitrogen Life Technologies, Carlsbad, CA) in sterile and degassed FACS buffer (1 × PBS with 5% FCS) at 37° for 1 hr before. After washing, cells were incubated in the same medium at 37° for the indicated times. Samples were acquired on a FACSCalibur cytometer (Becton Dickinson, San Jose, CA). Basal Fluo3 fluorescence levels were measured for 60 seconds following which EL4 cells or EL4 cells loaded with Ova257–264 peptide (10−6, 10−9 and 10−12 M) were added. Calcium measurements were acquired for 60 seconds, followed by addition of CaCl2 (1 mm) to measure extracellular uptake. Data were analysed with flo jo software (Treestar, Ashland, OR).
Results
Peptide dose-dependent avidity of OT-Irag2− CTL lines
Our previous studies employing splenocytes from a TCR-transgenic mouse have shown that, at the population level, CTL of high or low avidity could be generated by stimulation with APC bearing low versus high amounts of antigen.11,12,29 To dissect the control of TCR signalling in these CTL, we employed high and low avidity lines generated from rag2-deficient OT-I TCR transgenic mice, which bear a TCR that recognizes the Ova257–264 peptide.32 High and low avidity lines were established by stimulation with APC pulsed with either a low (10−9 m) or a high (10−5 m) concentration of Ova257–264 peptide, respectively. Avidity was confirmed by assessing IFN-γ production following stimulation with a range of peptide concentrations. As expected, the line generated by stimulation with a high amount of peptide (−5MCTL) required more peptide (approximately four logs, 10−9 versus 10−13 m) to achieve half maximal IFN-γ production compared with the line generated by stimulation with the low amount of peptide (-9MCTL) (Fig. 1a). Primary data are shown in Figure S1, see supplementary material.
Figure 1.
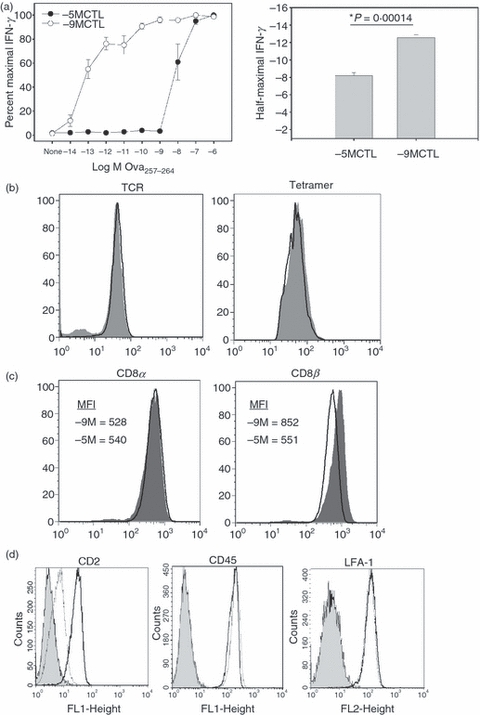
High and low avidity cells exhibit differences in the amount of peptide required for effector function and T-cell receptor (TCR) internalization. (a) Splenocytes from TCR transgenic OT-I Rag2− were generated by stimulation with antigen-presenting cells (APC) pulsed with a high (10−5 m) or low (10−9 m) concentration of Ova257–264 peptide. On day 7 after stimulation, the function of the cytotoxic T lymphocytes (CTL) was assessed by co-culturing for 5 hr with EL4 cells previously pulsed with the indicated peptide concentrations. Interferon-γ (IFN-γ) production was determined by intracellular cytokine staining (ICCS). The right panel shows averaged data (± SEM) from five experiments for the concentration at which cells displayed half maximal IFN-γ. *P = 0·000014, Student's t-test. (b) TCR expression and tetramer staining of high and low avidity lines. High avidity (shaded histogram), low avidity (open histogram). (c) CD8α and CD8β expression on high and low avidity lines. High avidity (shaded histogram), low avidity (open histogram). (d) Analysis of CD2, CD45 and lymphocyte function-associated antigen 1 (LFA-1). High avidity (bold), low avidity (thin), isotype control (shaded).
High and low avidity OT-Irag2− CTL express similar levels of TCR but differ in the expression of CD8β
We next determined whether differences in TCR levels were associated with peptide sensitivity. Staining with a Vβ5.1/5.2 specific antibody (which recognizes the transgenic TCR) demonstrated similar levels of TCR (Fig. 1b, left panel). Hence, the differences in avidity were not associated with differences in the amount of TCR available for pMHC engagement. As a surrogate for the ability to bind to pMHC, we compared binding of the Ova257–264/Kb tetramer in the high and low avidity lines. This analysis demonstrated similar binding of tetramer between the two lines (Fig. 1b, right panel). In our previous studies of high and low avidity cells generated from P14 TCR transgenic mice we found that high avidity was most often associated with increased expression of CD8β in the face of constant levels of CD8α compared with low avidity cells.10–12,29,33 To determine whether this was the case in high and low avidity OT-I lines studied here, we assessed the expression of CD8α and β on resting cells (i.e. day 7 post-stimulation). High and low avidity cells exhibited similar levels of CD8α at the cell surface (Fig. 1c). However, analysis of β chain expression revealed increased levels of this molecule in high compared with low avidity cells (Fig. 1c). Hence, selective regulation of CD8β expression on CTL of high versus low avidity appears to be a shared property of the two TCR transgenic models assessed to date.
We extended this analysis to include CD2, CD45 and lymphocyte function-associated antigen-1 (LFA-1), other cell surface molecules that may be involved in adhesion/activation (Fig. 1d). We found that CD45 and lymphocyte function-associated antigen-1 expression was similar between high and low avidity cells. In contrast, we noted increased expression of CD2 on high avidity cells. Although potentially a contributor to T-cell activation, blocking studies did not support a role for this molecule in the increased sensitivity of the high avidity cells (data not shown).
High and low avidity CTL exhibit differences in peptide-dependent TCR internalization and sensitivity to antibody-mediated activation
We next determined whether the differences in peptide sensitivity were associated with differences in TCR engagement-dependent TCR internalization. High and low avidity cells were stimulated for 5 hr in the presence of titrated amounts of peptide antigen. The TCR levels were assessed by staining with a Vβ5.1/5.2-specific antibody. We found that the amount of peptide required for detectable TCR internalization was reduced in the high (−9MCTL) compared with the low (−5MCTL) avidity cells (Fig. 2a). This result suggested the possibility that TCR signalling differed in the high versus low avidity cells at a given level of pMHC.
Figure 2.
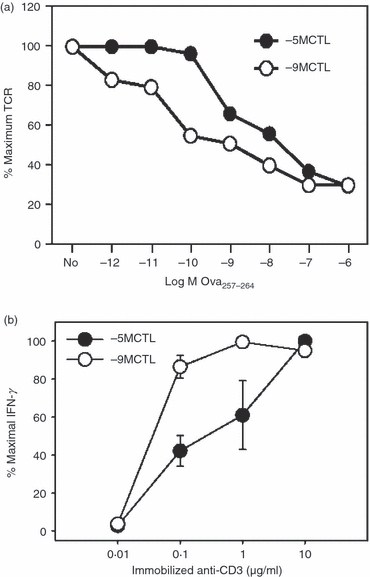
High and low avidity cells differ in both peptide-induced T-cell receptor (TCR) internalization and the sensitivity to anti-CD3 stimulation. (a) The amount of peptide required for TCR internalization is higher in low avidity cells. On day 7 after routine stimulation, high or low avidity cytotoxic T lymphocytes (CTL) were co-cultured for 5 hr with EL4 cells previously pulsed with titrated concentrations of Ova257–264 peptide. TCR levels were assessed by staining with anti-Vβ5.1/5.2 antibody. (b) High and low avidity cells differ in their response to anti-CD3 stimulation. Cells were stimulated for 5 hr with titrated concentrations of immobilized anti-CD3 (2C11) antibody. Following the stimulation period, interferon-γ (IFN-γ) production was determined by intracellular cytokine staining (ICCS). High avidity cells were activated by lower concentrations of anti-CD3 antibody compared with their low avidity counterpart. These data are derived from four independent experiments.
To further address the response of the lines to TCR engagement we analysed the production of IFN-γ following stimulation with immobilized anti-CD3 antibody (Fig. 2b). We found that the high and low avidity lines exhibited significant differences in the amount of anti-CD3 required to produce IFN-γ. Hence, high and low avidity cells differ in their requirement for pMHC and in their sensitivity to activation by anti-CD3 antibody. These data suggest that the sensitivity to peptide antigen may be the result of differences in the signalling that results from TCR engagement.
The amount of peptide required for increased cytoplasmic calcium levels as well as phosphorylation of ERK1/2 is greater in low versus high CTL
Following initiation of TCR signalling, the cascade bifurcates, with distinct pathways leading to increases in cytoplasmic calcium levels and phosphorylation of ERK.34,35 Both of these signals have been shown to be critical for TCR activation.35,36 We first determined whether high versus low avidity cells differed in their ability to signal for calcium uptake when cells were stimulated with titrated amounts of peptide antigen. The CTL were loaded with the calcium-sensitive dye Fluo3 AM and basal readings were obtained for 60 seconds. Antigen-presenting cells pulsed with 10−6, 10−9, or 10−12 m peptide were then added. Calcium levels were measured for an additional 240 seconds to allow CTL–APC interaction, followed by addition of extracellular Ca2+ to assess uptake from the extracellular environment. As shown in Fig. 3, high avidity CTL had detectable increases in Fluo3 at all the peptide concentrations assessed, with the levels increasing in a dose-dependent fashion. In contrast, low-avidity CTL exhibited only a minimal increase in Fluo3 fluorescence at 10−9 m. Stimulation with APC bearing 10−6 m peptide was required to achieve calcium levels similar to those observed when high avidity cells were activated with 10−12 m peptide. EL4 cells alone failed to induce any calcium response (data not shown). However, of note, when the optimal activating peptide concentration for each line was used (as defined by the lowest concentration that resulted in maximum IFN-γ levels) the two lines exhibited similar levels of calcium flux.
Figure 3.
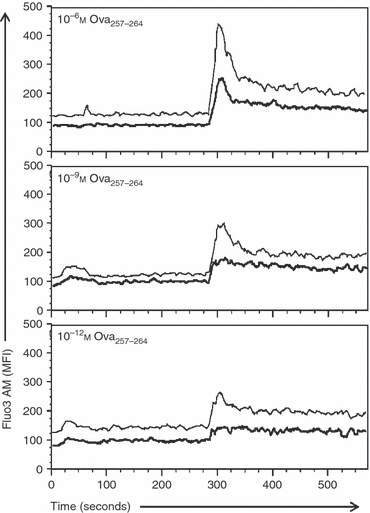
The threshold concentration of peptide required for calcium mobilization reflects that necessary for effector function. High or low avidity cytotoxic T lymphocytes (CTL) were incubated with Fluo3 AM and stimulated with Ova257–264 peptide pulsed EL4 cells followed by addition of CaCl2 as described in the Materials and methods. Fluo3 AM fluorescence in high (thin line) and low (bold line) avidity CTL stimulated with EL4 cells pulsed with 10−6, 10−9 or 10−12 m Ova257–264 peptide is shown. Peptide indicated in the upper left is the concentration used for stimulating the CTL. Data are representative of three independent experiments.
We next assessed the kinetics and magnitude of MAPK-ERK1/2 phosphorylation over time following stimulation with a range of peptide concentrations. At the early time-point of 10 min, increases in phospho-ERK1/2 were apparent only in high avidity CTL (Fig. 4). Phosphorylation in this population was detectable at this time with all peptide concentrations, although there was a clear dose-dependent increase. Low avidity CTL exhibited a detectable increase in phospho-ERK1/2 at 30 min (Fig. 4). At 60 min, phospho-ERK1/2 signal was at its highest in both the high and low avidity cells. However, the level was reduced in the low avidity cells. Averaged data are shown in Fig. 4(b). The total phospho-ERK1/2 level in unstimulated cells was similar between the lines.
Figure 4.
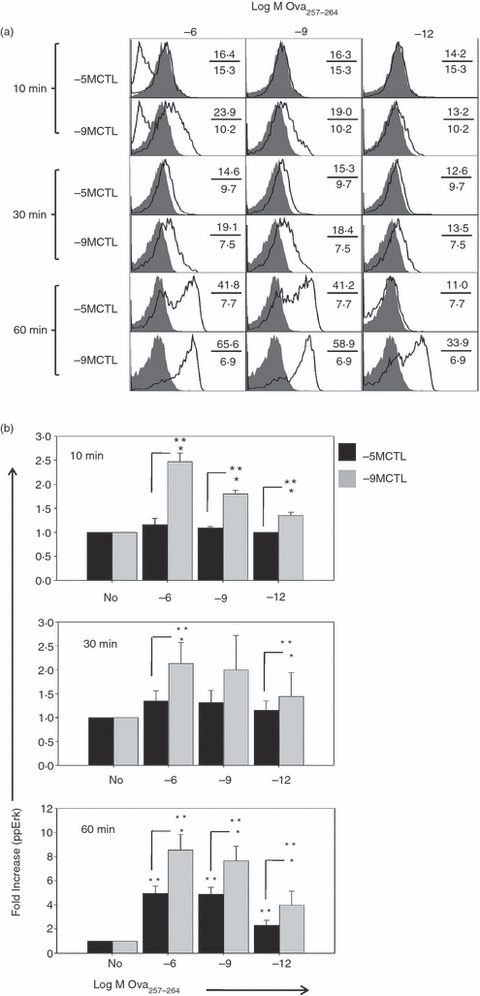
Peptide concentration-dependent differences in mitogen-activated protein-extracellular signal-regulated kinase (MAP-ERK) 1/2 phosphorylation reflect the differences for effector function. High and low avidity cytotoxic T lymphocyte (CTL) lines were activated for 10, 30 or 60 min with titrated concentrations of Ova257–264 peptide. Cells were immediately fixed with 4% paraformaldehyde, permeabilized with ice-cold 90% methanol and extensively washed before staining with antibodies to CD8 and phospho-ERK1/2 or an isotype control antibody. (a) The shaded histograms represent phospho-ERK1/2 levels in unstimulated cells; the open histograms post-stimulation with the indicated amounts of peptide. The lowest histogram in the first 10 min panels represent isotype control staining for each CTL line. Numbers indicate mean fluorescence intensities (MFIs) of unstimulated (lower) or stimulated (upper) cells. (b) The bar graphs show average fold increases (± SEM) in MFI calculated over unstimulated cells from three independent experiments. *P < 0·05 in high versus low avidity. **P < 0·05 versus control.
The kinetics of ERK phosphorylation in high and low avidity CTL suggested that high avidity CTL undergo more rapid phosphorylation of ERK1/2 compared with low avidity CTL. However, at 60 min, the amount of phospho-ERK present in high and low avidity cells was similar when evaluated under conditions where the threshold stimulatory peptide concentration was used (10−6 m for low avidity cells and 10−12 m for high avidity cells). By 6 hr post-stimulation, the phospho-ERK1/2 signal had returned to baseline in both cell types (data not shown).
Differences in phospho-ERK1/2 and Ca2+ flux are correlated with phosphorylation of upstream signalling molecules
The marked peptide concentration-dependent differences in ERK1/2 phosphorylation and calcium flux between the lines suggested that differences in the peptide sensitivity of high versus low avidity cells was controlled at a more membrane proximal step in the TCR signal transduction cascade. The transmembrane adaptor protein LAT provides a central signalling nexus for activation through initiation of signalosome formation. This complex controls recruitment and activation of phospholipase C-γ1, phophoinositide 3 kinase, and Ras.6,7 We first determined whether total protein levels of LAT in high and low avidity CTL differed and found that this protein was present at equal levels in both CTL lines (Fig. 5a). To evaluate LAT activation, the high and low avidity CTL were stimulated with titrated concentrations of peptide. Phosphorylation of LAT at tyrosine 191 was quantified by intracellular staining. This analysis revealed a pattern similar to that for other molecules analysed in that high avidity CTL were able to induce phosphorylation at all concentrations of peptide used, whereas low avidity CTL exhibited statistically significant increases in LAT phosphorylation compared with stimulation with APC in the absence of peptide only following exposure to APC pulsed with the highest amount of peptide (Fig. 5b,c, for clarification, the significance (*) shown on figure is comparing −5M and −9MCTL). These data suggested that differences in ERK1/2 signalling in high versus low avidity cells arose at a more membrane proximal step in TCR signalling.
Figure 5.
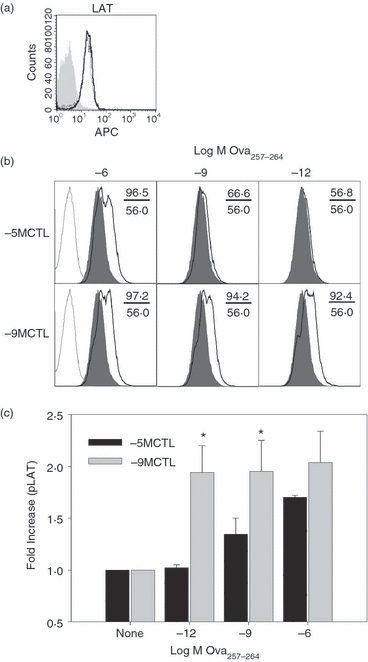
The concentration of peptide required for LAT phosphorylation differs in high versus low avidity cytotoxic T lymphocytes (CTL). (a) Total LAT expression in resting high and low avidity cells was determined by intracellular staining. (b) 1 × 10⁶ high or low avidity cells were stimulated for 10 min with antigen-presenting cells pulsed with titrated amounts of Ova257–264 peptide (10−6, 10−9 or 10−12 m). Following stimulation, cells were fixed with 4% paraformaldehyde and permeabilized with ice-cold 90% methanol as described in the Materials and methods. Levels of phospho-LAT (pY191) were assessed by intracellular staining. Shaded histograms show unstimulated controls, whereas open lines represent staining following activation. Numbers indicate mean fluorescence intensities (MFIs) of unstimulated (lower) or stimulated (upper) cells. Isotype controls are shown as dotted line histograms. (c) Average fold increase (± SEM) in pLAT (pY191) at 10 min after stimulation from more than three independent experiments. *P < 0·05 in high versus low avidity CTL.
High, but not low avidity CTL exhibit CD3ζ phosphorylation at limiting peptide concentrations
Tyrosine phosphorylation of ITAMs on the TCR-associated CD3 chains is one of the initial biochemical events detectable in T cells after TCR ligation.3 Phosphorylation at these sites allows ZAP-70 binding and activation, which then becomes competent for phosphorylation of LAT.37,38 To assess CD3ζ phosphorylation in high or low avidity CTL, cells were stimulated with APC bearing titrated concentrations of Ova257–264 peptide and CD3ζ immunoprecipitated at 10 or 60 min post-stimulation. The immunoprecipitates were subjected to SDS–PAGE and immunoblotted with anti-phosphotyrosine antibody. As evident from Fig. 6, CD3ζ was efficiently phosphorylated in high avidity CTL at all peptide concentrations assessed as early as 10 min following stimulation. In contrast, in low avidity CTL, at this early time-point TCR engagement led to CD3ζ phosphorylation only at the higher peptide concentrations (10−6 and 10−9 m peptide). Of note, not surprisingly, the amount of phosphorylation observed was reduced following stimulation with 10−9 versus 10−6 m peptide. At 60 min post-stimulation, phosphorylated CD3ζ was still present in high avidity cells with all of the stimulatory conditions, whereas low avidity cells demonstrated CD3 phosphorylation only at the highest concentration of peptide (Fig. 6).
Figure 6.
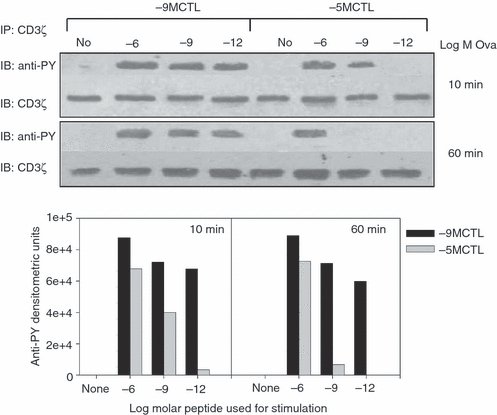
The amount of peptide required for CD3ζ phosphorylation is lower for high avidity cytotoxic T lymphocytes (CTL). 1 × 10⁶ high or low avidity CTL were stimulated with antigen-presenting cells (APCs) pulsed with 10−6, 10−9 or 10−12 m Ova257–264 peptide for 10 or 60 min. Cells were lysed and CD3ζ was immunoprecipitated using anti-CD3ζ antibodies. Proteins were separated by SDS–PAGE and phosphorylated CD3ζ levels were measured by anti-phosphotyrosine immunoblotting. The membrane was stripped and re-probed with anti-CD3ζ antibodies to assess total protein. Quantification of the anti-phosphotyrosine blot is shown in the lower panel. Data are representative of three independent experiments.
To ensure that differences in phosphorylation were not related to the level of CD3ζ present in the cells, the blots were stripped and probed with anti-CD3ζ monoclonal antibody (Fig. 6). This analysis demonstrated that equivalent amounts of protein were immunoprecipitated. These data show that high avidity cells underwent phosphorylation of CD3ζ at peptide levels lower than low avidity cells and that phosphorylation was prolonged in high avidity cells.
Increased CD3ζ phosphorylation in high avidity cells is associated with increased p56Lck phosphorylation
As TCR/CD3 phosphorylation is primarily regulated by Src-family kinase p56Lck,38,39 we next determined the level of p56Lck in high and low avidity CTL in their resting state. Levels of P56Lck were found to be similar in both high and low avidity CTL (Fig. 7a), ruling out the possibility that an increased amount of this protein was responsible for the observed differential phosphorylation of CD3ζ chains. Similar results were obtained using Western blot analysis (data not shown).
Figure 7.
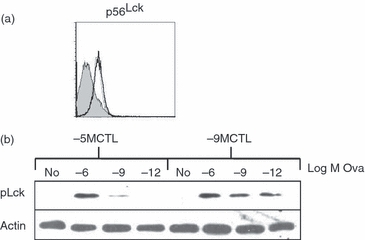
The amount of peptide required for p56Lck phosphorylation reflects that required for effector function. (a) The level of Src-family kinase p56Lck was similar in high and low avidity cytotoxic T lymphocytes (CTL). Cells were intracellularly stained with p56Lck specific antibodies. Thin and bold lines represent low and high avidity CTL respectively, whereas shaded histograms represent isotype control staining. (b) CTL lines were stimulated for 10 min with antigen-presenting cells pulsed with different concentrations of peptides. Cell lysates were run on 10% SDS–PAGE and blotted to nitrocellulose membrane. Membranes were exposed to anti-phospho Lck antibody (pY416) followed by horseradish peroxidase-conjugated anti-rabbit secondary antibodies. Blots were developed and quantified by densitometry. Data are representative of three independent experiments.
We then analysed the phosphorylation status of p56Lck following activation. Phosphorylation of p56Lck at tyrosine 394 is responsible for the activation of kinase activity.40 High or low avidity CTL were stimulated with peptide-pulsed APC and lysates were prepared and analysed for the presence of activated p56Lck as revealed by a p56Lck p394Tyr-specific antibody. Phospho-394 p56Lck was detected in high avidity cells following stimulation with all concentrations of peptide, although there was a dose-dependent increase (Fig. 7b). The presence of activated p56Lck was detected at high levels in low avidity CTL only following stimulation with the highest concentration of peptide with a minimal level detected when 10−9 m peptide was used for stimulation, suggesting that the differential requirement for peptide is manifest at the most membrane-proximal step of p56Lck activation.
Discussion
The presence of CD8+ effector cells that exhibit significant differences in the amount of peptide antigen required for activation is well established. Recently we have demonstrated that T cells are capable of tuning their antigen sensitivity in direct response to the stimulation conditions encountered.10–12,29 Specifically, our studies showed that approximately 65% of naive cells possess the capacity to differentiate into both high and low avidity cells.11 Hence an individual cell has the capacity to tune avidity in response to peptide encounter. These analyses were carried out using cells from a TCR transgenic model and as such, the divergence in peptide sensitivity among cells was not the result of differences in TCR affinity. Given a constant TCR affinity, the molecular basis for the significant difference in peptide requirement between high and low avidity cells generated in this model is intriguing.
In the present, study we used a high and low avidity cell line generated from OT-I TCR transgenic mice to probe TCR signalling following avidity tuning. In addition to sharing a common TCR, the two lines used here bind similar amounts of tetramer. Although not directly demonstrated, these results are consistent with a similar capacity to engage pMHC. At the initiation of these studies we proposed two general hypotheses that could account for the increased peptide requirement by low avidity cells: (i) low avidity cells require a greater magnitude of TCR-generated signal to activate effector functions, i.e. cytokine production and lytic granule release, or (ii) high and low avidity cells require a similar level of signalling to elicit effector function, but a greater amount of pMHC is required to achieve this threshold.
Here we show that the requirement for increased peptide in low avidity cells is not the result of a difference in the quantity of downstream signal necessary for activation (as measured by erk phosphorylation and intracellular calcium levels). In fact, we also observed similar patterns of activation in the upstream molecules in the pathway, i.e. LAT and CD3ζ, in high and low avidity cells under threshold conditions for effector function. The requirement for similar levels of signalling appears to generally be the case, as comparable findings for erk activation were obtained in two independently generated pairs of lines (data not shown). Instead, our results are consistent with a requirement for increased TCR engagement to achieve initiation of the requisite level of signalling. This model is supported by the finding that the low avidity cells require a greater amount of anti-CD3 to promote IFN-γ production compared with the high avidity cells.
We have previously reported that high and low avidity lines generated in the TCR transgenic model exhibit differences in CD8 expression at the cell surface.10,12 Changes in CD8 can manifest as differences in the absolute level of CD8, with lower avidity cells exhibiting reduced levels of both CD8α and -β or, more often in our hands, in the relative expression of CD8α versus -β, with low avidity cells having a lower β : α ratio.11,12 A decreased β : α ratio in low avidity cells is consistent with a greater proportion of CD8 expressed as αα homodimers. The high and low avidity lines used in this study represent the latter regulation, exhibiting differences in CD8β expression in the face of similar CD8α levels, thereby resulting in a reduced β : α ratio in the low avidity cells. Assuming that all CD8 molecules on high avidity cells are in the αβ heterodimeric form (which we realize may not be the case), evaluation of the ratios of β : α across multiple lines that we have generated reveals representation of CD8αα molecules on low avidity cells in the range of 19–29% of the total CD8. [This was calculated with the assumption that the mean fluorescence intensity (MFI) values for α and β on high avidity cells reflect a one-to-one pairing of all α and β chains. Based on this relationship, the expected MFI value for CD8α in low avidity lines when each β chain was paired with an α chain was calculated. The remaining MFI units then reflected the non-β paired α chains. This value was divided by 2 to account for αα homodimeric pairing. That value, which represented the contribution of αα homodimer MFI, was divided by the total α chain MFI value to calculate the percentage of α chain in homodimers versus heterodimers.] The analysis of signal transduction in the lines presented here is consistent with the model that a change in CD8 isoform contributes to the increased peptide requirement by low avidity cells as CD8-mediated recruitment of p56Lck to the TCR/CD3 complex is a critical step in the initiation of TCR signalling. CD8αα would fail to efficiently facilitate this event because of its exclusion from lipid rafts.41
That said, we note that the low avidity cells do express significant levels of CD8αβ. Although CD8αα has been thought to perform a role that is similar to CD8αβ, just with less efficiency, recently CD8αα has been proposed to serve as an active negative regulator of TCR signalling (for review see ref. 42). For example, recently CD8αα has been postulated to interact with inhibitory molecules, e.g. LAT2.42 This would explain the significant impact on signalling even when a minority of CD8 molecules is expressed in the αα homodimeric form. In addition, it would provide a rationale for the expression of CD8αα on effector cells that give rise to the memory pool, perhaps functioning to spare those cells from high levels of signalling that may promote terminal differentiation into effector cells. Determination of whether CD8αα in low avidity cells functions as a negative regulator or simply acts as an inefficient activator awaits further study.
Although a difference in the expression of CD8 is an attractive hypothesis, given the large differences in peptide sensitivity in these cells, we cannot rule out the possibility that other factors play a role. For example, in addition to phosphorylation events which activate p56Lck, the activity of this molecule is also controlled by the regulated phosphorylation of inhibitory sites.43 Phosphorylation at the inhibitory site (Y505) is mediated by the action of csk.2 This is counteracted by the phosphatase CD45, which allows the p56Lck to exist in a basally active conformation. Whereas csk activity has not been tested, we did assess CD45 expression in the high and low avidity cells, finding that it did not differ in the two cell lines. An additional candidate regulator of TCR signalling is SHP-1. SHP-1 impedes signalling through dephosphorylation of activating sites on p56Lck as well as other downstream signalling molecules or exchange factors (e.g. ZAP-70, Vav, Grb2 and SLP-76).44–48 Our analysis of SHP-1 in these lines showed that it was more highly expressed in low avidity cells, a finding consistent with sustained activation of CD3ζ in the high versus low avidity cells. However, we do not generally find differential expression of SHP-1 in high versus low avidity cell lines so its role in controlling avidity is questionable.
It is becoming increasingly clear that T cells are capable of significant modulation as a result of the conditions present during/following activation. Here we have investigated the signalling that occurs in high versus low avidity cells generated as a result of avidity modulation following encounter with a discrete amount of peptide/MHC. We find that the increased peptide needed by low avidity cells is not the result of a requirement for an increased magnitude of signalling, but instead reflects the need for increased levels of pMHC to achieve signalling that results in effector function. Hence, the molecular regulation of avidity during ‘tuning’ of peptide sensitivity occurs at the initiation of signalling, with downstream regulation of the signal transduction cascade left seemingly unscathed. These data provide new insights into the regulatory pathways used by effector cells to control their sensitivity to peptide antigen.
Acknowledgments
This work was supported by National Institutes of Health grants R01AI043591 and R01HL071985 (both to M.A.A.-M.). We appreciate the helpful comments of Drs Jason Grayson and John Johnson regarding this manuscript. We are grateful to Dr Banabihari Giri for assistance with Western blots quantification.
Disclosures
None.
Supporting Information
Additional Supporting Information may be found in the online version of this article:
Figure S1. Histograms showing the production of interferon-γ (INFγ) by the high and low avidity cytotoxic T lymphocytes (CTL) following stimulation with titrated amounts of peptide antigen. The numbers in the upper right show the percentage of cells producing INFγ.
Please note: Wiley-Blackwell are not responsible for the content or functionality of any supporting materials supplied by the authors. Any queries (other than missing material) should be directed to the corresponding author for the article.
References
- 1.Palacios EH, Weiss A. Function of the Src-family kinases, Lck and Fyn, in T-cell development and activation. Oncogene. 2004;23:7990–8000. doi: 10.1038/sj.onc.1208074. [DOI] [PubMed] [Google Scholar]
- 2.Mustelin T, Williams S, Tailor P, et al. Regulation of the p70zap tyrosine protein kinase in T cells by the CD45 phosphotyrosine phosphatase. Eur J Immunol. 1995;25:942–6. doi: 10.1002/eji.1830250413. [DOI] [PubMed] [Google Scholar]
- 3.Latour S, Veillette A. Proximal protein tyrosine kinases in immunoreceptor signaling. Curr Opin Immunol. 2001;13:299–306. doi: 10.1016/s0952-7915(00)00219-3. [DOI] [PubMed] [Google Scholar]
- 4.Weiss A, Littman DR. Signal transduction by lymphocyte antigen receptors. Cell. 1994;76:263–74. doi: 10.1016/0092-8674(94)90334-4. [DOI] [PubMed] [Google Scholar]
- 5.Acuto O, Di BV, Micheli F. Tailoring T-cell receptor signals by proximal negative feedback mechanisms. Nat Rev Immunol. 2008;8:699–712. doi: 10.1038/nri2397. [DOI] [PubMed] [Google Scholar]
- 6.Luik RM, Lewis RS. New insights into the molecular mechanisms of store-operated Ca2+ signaling in T cells. Trends Mol Med. 2007;13:103–7. doi: 10.1016/j.molmed.2007.01.004. [DOI] [PubMed] [Google Scholar]
- 7.Daniels MA, Teixeiro E, Gill J, et al. Thymic selection threshold defined by compartmentalization of Ras/MAPK signalling. Nature. 2006;444:724–9. doi: 10.1038/nature05269. [DOI] [PubMed] [Google Scholar]
- 8.Dong C, Davis RJ, Flavell RA. MAP kinases in the immune response. Annu Rev Immunol. 2002;20:55–72. doi: 10.1146/annurev.immunol.20.091301.131133. [DOI] [PubMed] [Google Scholar]
- 9.Verdeil G, Chaix J, Schmitt-Verhulst AM, Auphan-Anezin N. Temporal cross-talk between TCR and STAT signals for CD8 T cell effector differentiation. Eur J Immunol. 2006;36:3090–100. doi: 10.1002/eji.200636347. [DOI] [PubMed] [Google Scholar]
- 10.Kroger CJ, Alexander-Miller MA. Dose-dependent modulation of CD8 and functional avidity as a result of peptide encounter. Immunology. 2007;122:167–78. doi: 10.1111/j.1365-2567.2007.02622.x. [DOI] [PMC free article] [PubMed] [Google Scholar]
- 11.Kroger CJ, Alexander-Miller MA. Cutting edge: CD8+ T cell clones possess the potential to differentiate into both high- and low-avidity effector cells. J Immunol. 2007;179:748–51. doi: 10.4049/jimmunol.179.2.748. [DOI] [PubMed] [Google Scholar]
- 12.Cawthon AG, Lu H, Alexander-Miller MA. Peptide requirement for CTL activation reflects the sensitivity to CD3 engagement: correlation with CD8αβ versus CD8αα expression. J Immunol. 2001;167:2577–84. doi: 10.4049/jimmunol.167.5.2577. [DOI] [PubMed] [Google Scholar]
- 13.Alexander-Miller MA, Leggatt GR, Berzofsky JA. Selective expansion of high- or low-avidity cytotoxic T lymphocytes and efficacy for adoptive immunotherapy. Proc Natl Acad Sci U S A. 1996;93:4102–7. doi: 10.1073/pnas.93.9.4102. [DOI] [PMC free article] [PubMed] [Google Scholar]
- 14.Gallimore A, Dumrese T, Hengartner H, Zinkernagel RM, Rammensee HG. Protective immunity does not correlate with the hierarchy of virus-specific cytotoxic T cell responses to naturally processed peptides. J Exp Med. 1998;187:1647–57. doi: 10.1084/jem.187.10.1647. [DOI] [PMC free article] [PubMed] [Google Scholar]
- 15.Yee C, Savage PA, Lee PP, Davis MM, Greenberg PD. Isolation of high avidity melanoma-reactive CTL from heterogeneous populations using peptide-MHC tetramers. J Immunol. 1999;162:2227–34. [PubMed] [Google Scholar]
- 16.Sedlik C, Dadaglio G, Saron MF, et al. In vivo induction of a high-avidity, high-frequency cytotoxic T-lymphocyte response is associated with antiviral protective immunity. J Virol. 2000;74:5769–75. doi: 10.1128/jvi.74.13.5769-5775.2000. [DOI] [PMC free article] [PubMed] [Google Scholar]
- 17.Zeh HJ, III, Perry-Lalley D, Dudley ME, Rosenberg SA, Yang JC. High avidity CTLs for two self-antigens demonstrate superior in vitro and in vivo antitumor efficacy. J Immunol. 1999;162:989–94. [PubMed] [Google Scholar]
- 18.Neveu B, Debeaupuis E, Echasserieau K, et al. Selection of high-avidity CD8 T cells correlates with control of hepatitis C virus infection. Hepatology. 2008;48:713–22. doi: 10.1002/hep.22379. [DOI] [PubMed] [Google Scholar]
- 19.Sherman LA, Morgan DJ, Nugent CT, et al. Self-tolerance and the composition of T cell repertoire. Immunol Res. 2000;21:305–13. doi: 10.1385/IR:21:2-3:305. [DOI] [PubMed] [Google Scholar]
- 20.Fahmy TM, Bieler JG, Edidin M, Schneck JP. Increased TCR avidity after T cell activation: a mechanism for sensing low-density antigen. Immunity. 2001;14:135–43. [PubMed] [Google Scholar]
- 21.al Ramadi BK, Jelonek MT, Boyd LF, Margulies DH, Bothwell AL. Lack of strict correlation of functional sensitization with the apparent affinity of MHC/peptide complexes for the TCR. J Immunol. 1995;155:662–73. [PubMed] [Google Scholar]
- 22.Echchakir H, Dorothee G, Vergnon I, Menez J, Chouaib S, Mami-Chouaib F. Cytotoxic T lymphocytes directed against a tumor-specific mutated antigen display similar HLA tetramer binding but distinct functional avidity and tissue distribution. Proc Natl Acad Sci USA. 2002;99:9358–63. doi: 10.1073/pnas.142308199. [DOI] [PMC free article] [PubMed] [Google Scholar]
- 23.Reignat S, Webster GJM, Brown D, et al. Escaping high viral load exhaustion: CD8 Cells with altered tetramer binding in chronic hepatitis B virus infection. J Exp Med. 2002;195:1089–101. doi: 10.1084/jem.20011723. [DOI] [PMC free article] [PubMed] [Google Scholar]
- 24.Bullock TNJ, Mullins DW, Colella TA, Engelhard VH. Manipulation of avidity to improve effectiveness of adoptively transferred CD8+ T cells for melanoma immunotherapy in human MHC class I-transgenic mice. J Immunol. 2001;167:5824–31. doi: 10.4049/jimmunol.167.10.5824. [DOI] [PubMed] [Google Scholar]
- 25.Lawson TM, Man S, Wang ECY, et al. Functional differences between influenza A-specific cytotoxic T lymphocyte clones expressing dominant and subdominant TCR. Int Immunol. 2001;13:1383–90. doi: 10.1093/intimm/13.11.1383. [DOI] [PubMed] [Google Scholar]
- 26.Palermo B, Campanelli R, Mantovani S, et al. Diverse expansion potential and heterogeneous avidity in tumor-associated antigen-specific T lymphocytes from primary melanoma patients. Eur J Immunol. 2001;31:412–20. doi: 10.1002/1521-4141(200102)31:2<412::aid-immu412>3.0.co;2-4. [DOI] [PubMed] [Google Scholar]
- 27.Slifka MK, Whitton JL. Functional avidity maturation of CD8+ T cells without selection of higher affinity TCR. Nat Immunol. 2001;2:711–7. doi: 10.1038/90650. [DOI] [PubMed] [Google Scholar]
- 28.Derby MA, Wang J, Margulies DH, Berzofsky JA. Two intermediate-avidity cytotoxic T lymphocyte clones with a disparity between functional avidity and MHC tetramer staining. Int Immunol. 2001;13:817–24. doi: 10.1093/intimm/13.6.817. [DOI] [PubMed] [Google Scholar]
- 29.Cawthon AG, Alexander-Miller MA. Optimal colocalization of TCR and CD8 as a novel mechanism for the control of functional avidity. J Immunol. 2002;169:3492–8. doi: 10.4049/jimmunol.169.7.3492. [DOI] [PubMed] [Google Scholar]
- 30.Li M, Davey GM, Sutherland RM, et al. Cell-associated ovalbumin is cross-presented much more efficiently than soluble ovalbumin in vivo. J Immunol. 2001;166:6099–103. doi: 10.4049/jimmunol.166.10.6099. [DOI] [PubMed] [Google Scholar]
- 31.Haas A, Weckbecker G, Welzenbach K. Intracellular phospho-flow cytometry reveals novel insights into TCR proximal signaling events. A comparison with Western blot. Cytometry A. 2008;73:799–807. doi: 10.1002/cyto.a.20598. [DOI] [PubMed] [Google Scholar]
- 32.Hogquist KA, Jameson SC, Heath WR, Howard JL, Bevan MJ, Carbone FR. T cell receptor antagonist peptides induce positive selection. Cell. 1994;76:17–27. doi: 10.1016/0092-8674(94)90169-4. [DOI] [PubMed] [Google Scholar]
- 33.Kroger CJ, Amoah S, Alexander-Miller MA. Cutting edge: dendritic cells prime a high avidity CTL response independent of the level of presented antigen. J Immunol. 2008;180:5784–8. doi: 10.4049/jimmunol.180.9.5784. [DOI] [PMC free article] [PubMed] [Google Scholar]
- 34.Lewis RS. Calcium signaling mechanisms in T lymphocytes. Annu Rev Immunol. 2001;19:497–521. doi: 10.1146/annurev.immunol.19.1.497. [DOI] [PubMed] [Google Scholar]
- 35.Winslow MM, Neilson JR, Crabtree GR. Calcium signalling in lymphocytes. Curr Opin Immunol. 2003;15:299–307. doi: 10.1016/s0952-7915(03)00050-5. [DOI] [PubMed] [Google Scholar]
- 36.Miller RA, Garcia G, Kirk CJ, Witkowski JM. Early activation defects in T lymphocytes from aged mice. Immunol Rev. 1997;160:79–90. doi: 10.1111/j.1600-065x.1997.tb01029.x. [DOI] [PubMed] [Google Scholar]
- 37.Chan AC, Irving BA, Fraser JD, Weiss A. The zeta chain is associated with a tyrosine kinase and upon T-cell antigen receptor stimulation associates with ZAP-70, a 70-kDa tyrosine phosphoprotein. Proc Natl Acad Sci U S A. 1991;88:9166–70. doi: 10.1073/pnas.88.20.9166. [DOI] [PMC free article] [PubMed] [Google Scholar]
- 38.Zhang W, Sloan-Lancaster J, Kitchen J, Trible RP, Samelson LE. LAT: the ZAP-70 tyrosine kinase substrate that links T cell receptor to cellular activation. Cell. 1998;92:83–92. doi: 10.1016/s0092-8674(00)80901-0. [DOI] [PubMed] [Google Scholar]
- 39.Lovatt M, Filby A, Parravicini V, Werlen G, Palmer E, Zamoyska R. Lck regulates the threshold of activation in primary T cells, while both Lck and Fyn contribute to the magnitude of the extracellular signal-related kinase response. Mol Cell Biol. 2006;26:8655–65. doi: 10.1128/MCB.00168-06. [DOI] [PMC free article] [PubMed] [Google Scholar]
- 40.D'Oro U, Ashwell JD. Cutting edge: the CD45 tyrosine phosphatase is an inhibitor of Lck activity in thymocytes. J Immunol. 1999;162:1879–83. [PubMed] [Google Scholar]
- 41.Arcaro A, Gregoire C, Boucheron N, et al. Essential role of CD8 palmitoylation in CD8 coreceptor function. J Immunol. 2000;165:2068–76. doi: 10.4049/jimmunol.165.4.2068. [DOI] [PubMed] [Google Scholar]
- 42.Cheroutre H, Lambolez F. Doubting the TCR coreceptor function of CD8alphaalpha. Immunity. 2008;28:149–59. doi: 10.1016/j.immuni.2008.01.005. [DOI] [PubMed] [Google Scholar]
- 43.McNeill L, Salmond RJ, Cooper JC, et al. The differential regulation of Lck kinase phosphorylation sites by CD45 is critical for T cell receptor signaling responses. Immunity. 2007;27:425–37. doi: 10.1016/j.immuni.2007.07.015. [DOI] [PubMed] [Google Scholar]
- 44.Plas DR, Johnson R, Pingel JT, et al. Direct regulation of ZAP-70 by SHP-1 in T cell antigen receptor signaling. Science. 1996;272:1173–6. doi: 10.1126/science.272.5265.1173. [DOI] [PubMed] [Google Scholar]
- 45.Brockdorff J, Williams S, Couture C, Mustelin T. Dephosphorylation of ZAP-70 and inhibition of T cell activation by activated SHP1. Eur J Immunol. 1999;29:2539–50. doi: 10.1002/(SICI)1521-4141(199908)29:08<2539::AID-IMMU2539>3.0.CO;2-M. [DOI] [PubMed] [Google Scholar]
- 46.Kon-Kozlowski M, Pani G, Pawson T, Siminovitch KA. The tyrosine phosphatase PTP1C associates with Vav, Grb2, and mSos1 in hematopoietic cells. J Biol Chem. 1996;271:3856–62. doi: 10.1074/jbc.271.7.3856. [DOI] [PubMed] [Google Scholar]
- 47.Pani G, Fischer KD, Mlinaric-Rascan I, Siminovitch KA. Signaling capacity of the T cell antigen receptor is negatively regulated by the PTP1C tyrosine phosphatase. J Exp Med. 1996;184:839–52. doi: 10.1084/jem.184.3.839. [DOI] [PMC free article] [PubMed] [Google Scholar]
- 48.Clements JL, Yang B, Ross-Barta SE, et al. Requirement for the leukocyte-specific adapter protein SLP-76 for normal T cell development. Science. 1998;281:416–9. doi: 10.1126/science.281.5375.416. [DOI] [PubMed] [Google Scholar]
Associated Data
This section collects any data citations, data availability statements, or supplementary materials included in this article.