

Non-technical summary
Ci-VSP is a protein that consists of a voltage sensor domain (VSD) and a cytoplasmic phosphatase region. The phosphatase activity is regulated by the VSD. Detailed mechanisms of how the VSD regulates the phosphatase activity are elusive. The voltage range where the phosphatase activity is coupled with the VSD provides important clues to the coupling mechanisms. This paper examined the voltage sensitivity of the phosphatase activity over a wide range of voltage by electrophysiological methods, imaging analysis and mathematical modelling. The results demonstrate that the voltage dependency of the phosphatase activity correlates with that of the VSD. Thus, the phosphatase activity of Ci-VSP is coupled to the VSD over the entire range of voltages that elicit movement of the VSD.
Abstract
Abstract
The voltage sensing phosphatase Ci-VSP is composed of a voltage sensor domain (VSD) and a cytoplasmic phosphatase domain. Upon membrane depolarization, movement of the VSD triggers the enzyme's phosphatase activity. To gain further insight into its operating mechanism, we studied the PI(4,5)P2 phosphatase activity of Ci-VSP expressed in Xenopus oocytes over the entire range of VSD motion by assessing the activity of coexpressed Kir2.1 channels or the fluorescence signal from a pleckstrin homology domain fused with green fluorescent protein (GFP) (PHPLC-GFP). Both assays showed greater phosphatase activity at 125 mV than at 75 mV, which corresponds to ‘sensing’ charges that were 90% and 75% of maximum, respectively. On the other hand, the activity at 160 mV (corresponding to 98% of the maximum ‘sensing’ charge) was indistinguishable from that at 125 mV. Modelling the kinetics of the PHPLC-GFP fluorescence revealed that its time course was dependent on both the level of Ci-VSP expression and the diffusion of PHPLC-GFP beneath the plasma membrane. Enzyme activity was calculated by fitting the time course of PHPLC-GFP fluorescence into the model. The voltage dependence of the enzyme activity was superimposable on the Q–V curve, which is consistent with the idea that the enzyme activity is tightly coupled to VSD movement over the entire range of membrane potentials that elicit VSD movement.
Introduction
Electrical signals are involved in a variety of physiological phenomena, including neural activity, muscle contraction and exocytosis (Hille, 2001). Key mediators of such signalling are voltage-gated ion channels, generally consisting of four homologous units. Each unit contains two domains: a voltage sensor domain (VSD) and a pore domain. The VSD senses the membrane potential and regulates gating of the ion channel pore (Hille, 2001). Concerted transition of all four VSDs to the final activated state is required to open the channel pore upon a voltage change, and this cooperativity makes the voltage dependence of the ionic conductance steeper than that of the VSD movement (Bezanilla, 2000). The VSD had long been believed to be a unique motif restricted to voltage-gated ion channels. However, that notion was changed by the recent identification of the voltage sensing phosphatase Ci-VSP (Murata et al. 2005).
Ci-VSP is composed of a VSD and a cytoplasmic enzyme domain (Murata et al. 2005; Okamura et al. 2009; Okamura & Dixon, 2011). Its cytoplasmic region of the protein shows a high degree of homology with the phosphatase and tensin homologue deleted on chromosome 10 (PTEN), which is a phosphoinositide phosphatase that dephosphorylates PI(3,4,5)P3 to PI(4,5)P2 (Maehama et al. 2001). Ci-VSP dephosphorylates both PI(3,4,5)P3 and PI(4,5)P2 (Iwasaki et al. 2008), and not only does movement of the VSD regulate the phosphatase activity of Ci-VSP (Murata et al. 2005), but the activity of the enzyme domain can retrogradely affect the movement of the VSD (Hossain et al. 2008; Kohout et al. 2010). The activities of the two domains thus appear to be tightly coupled to one another.
A short linker between the VSD and the enzyme domain is critical for their functional coupling (Murata et al. 2005). It was recently shown, for example, that mutation of basic residues in the phosphoinositide binding motif (PBM) within the short linker reduces or eliminates the functional coupling between the VSD and enzyme domain (Villalba-Galea et al. 2009; Kohout et al. 2010). The precise mechanism by which the VSD tunes the phosphatase activity remains unclear, however. To gain insight into that mechanism, it will be important to quantitatively compare the voltage dependencies of the voltage sensor and the phosphatase activity over the entire range of voltages eliciting VSD movement.
In previous reports, we investigated the voltage-dependent phosphatase activity of Ci-VSP using K+ channels (Kir2.1, Kir3.2 and KCNQ2/3) as well as a GFP-fused pleckstrin homology (PH) domain derived from phospholipase C δ (PHPLC-GFP), which served as PI(4,5)P2 sensors (Murata et al. 2005; Murata & Okamura, 2007). Measurements made with Kir3.2 showed that the phosphatase activity increased as the membrane depolarized to around 0 mV. In experiments using Kir2.1, which showed greater affinity for PI(4,5)P2 than did Kir3.2, the phosphatase activity increased up to a membrane potential of 60 mV (Murata & Okamura, 2007). In addition, the kinetics of the decay of KCNQ2/3 currents accelerated as the membrane potential was increased from 30 mV to 120 mV, suggesting that phosphatase activity continuously increased in this voltage range and was correlated with the increasing movement of the VSD. Consistent with that idea, mutation of Ci-VSP within the VSD shifted the voltage dependences of both the VSD movement and the phosphatase activity (Murata & Okamura, 2007). However, we still do not know the voltage at which Ci-VSP's phosphatase activity saturates as the movement of the VSD becomes maximal. We also cannot exclude the possibility that in our earlier study (Murata & Okamura, 2007) the decay kinetics of KCNQ2/3 currents do not faithfully reflect the kinetics of the enzyme activity, since it was reported that PI(4,5)P2 modifies the gating of voltage-gated K+ channels (Oliver et al. 2004). The aim of the present study was to estimate the phosphatase activity at high membrane potentials and to clarify how phosphatase activity is quantitatively related to the movement of the VSD.
Toward this aim, we first used the Kir2.1 channel as the sensor for PI(4,5)P2. Kir2.1 is a more suitable detector for low levels of PI(4,5)P2 than Kir3.2 because it has greater affinity for PI(4,5)P2 (Huang et al. 1998). Second, we utilized PHPLC-GFP as a fluorescent detector of PI(4,5)P2. The voltage dependency of the phosphatase activity was then analysed by fitting it with a mathematical model. Taken together with the results of our earlier studies (Murata et al. 2005; Murata & Okamura, 2007), our present findings indicate that the voltage dependency of the phosphatase activity of Ci-VSP is coupled to VSD movement over the entire range of voltages that elicit movement of the voltage sensor.
Methods
cDNAs and molecular biology
The Ci-VSP cDNA used in this study was identical to that described in our earlier study (Murata et al. 2005). Kir2.1 cDNA cloned into pBluescript plasmid (Agilent Technologies Inc, Santa Clara, CA, USA) was kindly provided by Dr Yoshihiro Kubo (NIPS, Okazaki, Japan). PHPLC-GFP plasmid was a gift from Drs M. Takano and N. Uozumi (Zhang et al. 2004). cDNA encoding a modified HcRed (TAKARA, Kyoto, Japan) containing at its N-terminus a membrane targeting signal peptide derived from the tyrosine kinase Lyn (Halaszovich et al. 2009) was a gift from Dr Hidekazu Tsutsui (Osaka University).
Preparation of oocytes and in vitro synthesis of cRNA
Xenopus oocytes were collected from frogs anaesthetized in water containing 0.2% ethyl 3-aminobenzoate methanesulfonate salt (Sigma-Aldrich, St. Louis, MD, USA). Experiments were performed according to the guidelines of the Animal Research Committees of the Graduate School of Medicine of Osaka University. They also comply with the policies and regulations of The Journal of Physiology (Drummond, 2009). The oocytes were isolated and defolliculated by treatment with type I collagenase (1.0 mg ml−1, Sigma-Aldrich), and then injected with approximately 50 nl of cRNA. cRNAs were synthesized from linearized plasmid DNA using a mMESSAGE mMACHINE transcription kit (Applied Biosystems, Carlsbad, CA, USA). Injected oocytes were incubated for 2–3 days at 18°C in ND96 solution (5 mm Hepes, 96 mm NaCl, 2 mm KCl, 1.8 mm CaCl2, 1 mm MgCl2, pH 7.5, supplemented with gentamycin and pyruvate) (Goldin, 1992).
Electrophysiology
Macroscopic currents were recorded under two-electrode voltage clamp (TEVC) using a ‘bath-clamp’ amplifier (OC-725C, Haroard Apparatus Ltd., Edenbridge, Kent, UK). Stimulation and data acquisition and analysis were done using Pulse or Patchmaster software (HEKA Elektronik, Lambrecht/Pfalz, Germany) running on Macintosh and Mac mini computers equipped with an ITC-16 and LIH 8 + 8 AD/DA converter, respectively. Intracellular glass microelectrodes were filled with 3 m KCl (pH 7.2), after which their resistance ranged from 0.1 to 1.0 MΩ. The bath solution contained 10 mm Hepes, 20 mm KCl, 80 mmN-methyl-d-glucamine (NMDG) and 1 mm CaCl2; the pH was adjusted to 7.3 using HCl. For on-cell patch clamp recording, the vitelline membrane was peeled off by bathing the oocytes for 3–5 min in a hyperosmotic solution containing 10 mm Hepes, 10 mm EGTA, 2 mm MgCl2 and 220 mm aspartic acid, pH 7.1 (Stühmer, 1992). Microelectrodes with 1.0–1.9 MΩ resistances were fabricated from Drummond 100 μl calibrated pipettes using a P-97 horizontal puller (Sutter Instrument Co., Novato, CA, USA) and a fire polisher (Narishige, Tokyo, Japan). Recordings were made using an EPC 9 patch clamp amplifier (HEKA Electronik). The output signal was filtered at 2–4 kHz using a 4-pole Bessel filter, and the sampling frequency was 2–10 kHz. The bath and pipette solutions contained 20 mm Hepes, 100 mm KOH and 3 mm MgCl2; the pH was adjusted to 7.2 using methanesulfonic acid.
Measurements of Ci-VSP ‘sensing’ currents (asymmetrical capacitative currents derived from the motion of the VSD) in oocytes coexpressing Kir2.1 were made in bath solution containing 10 mm Hepes, 80 mmN-methyl-d-glucamine (NMDG) and 1 mm CaCl2 (pH 7.3). Thereafter, 20 μl of 2 m KCl was added to 2 ml of the bath solution (final concentration K+ is 20 mm) in order to measure Kir currents. When measuring ‘sensing’ currents in oocytes coexpressing PHPLC-GFP, ND96 solution was utilized as the bath solution. The holding potential was set to −60 mV. Leak currents and the current for charging the cell capacitance were cancelled using the P/–8 or P/–5 protocol, in which a step pulse for subtraction was applied from the holding potential. Charge movement (Qoff) was calculated from the OFF–‘sensing’ current after components due to cell capacitance were subtracted using Clampfit software version 10.2 (Molecular Device, Sunnyvale, CA, USA) or Patchmaster software (HEKA Electronik). The maximum ‘sensing’ charge was defined as an average of the ‘sensing’ charges measured at 130 mV, 140 mV and 150 mV.
The number of the elementary charge across the membrane upon depolarization has been estimated to be 1.09 (z value) in a single Ci-VSP molecule (Murata et al. 2005). The density of Ci-VSP was calculated from the following formula:
 |
where Qmax is the maximum ‘sensing’ charge, and the radius of oocytes is assumed to be 500 μm.
Imaging of PI(4,5)P2 in Xenopus oocytes
For confocal imaging, PHPLC-GFP was coexpressed with Ci-VSP. The oocytes were imaged using an FV300 confocal microscope (Olympus, Tokyo, Japan) equipped with a 20×/0.5 NA water-immersion objective under TEVC. The fluorescence intensity in each image was calculated using Fluoview software (Olympus).
For epifluorescence imaging, PHPLC-GFP and Lyn-HcRed were coexpressed with Ci-VSP in oocytes. After incubation for 2–3 days at 18°C in ND96 solution, fluorescence was monitored using a IX71 (Olympus) 20×/0.75 NA objective under TEVC carried out using an OC-725C-HV bath clamp amplifier (Warner Instruments) in ND96. FF01-470/22 and FF01-556/20 bandpass filters (Semrock Inc., Rochester, NY, USA) were used for the excitation of GFP and HcRed, respectively. Filters were changed every 0.25 s with a wheel assembly (MAC5000 controller system and filter wheel 99A042; Ludl Electronic Products Ltd, Hawthorne, NY, USA), and exposure times for individual images were 0.2–0.4 s. A FF493/574-Di01–25 × 36 edge filter (Semrock) was employed as a multi-edge dichroic beam splitter, and the fluorescence was directed onto a FF01-512/630-25 bandpass filter. Images were acquired using an ORCA-R2 digital CCD camera (Hamamatsu Photonics K. K., Hanamatsu, Japan).
Modelling
Kinetic models of voltage-dependent changes in PHPLC-GFP fluorescence and Kir activity were formulated as a compartmental model within the Virtual Cell framework (Schaff et al. 2000) (http://www.nrcam.uchc.edu/index.html). The rate of the reaction catalysed by Ci-VSP was defined by the Michaelis–Menten equation:
 |
where R is a coefficient representing relative enzymatic activity.
When calculating diffusion of PHPLC-GFP, the outputs of the Virtual Cell were processed further using a one-dimensional diffusion equation built into a macro written in Visual Basic and executed in Microsoft Excel 2007:
where C(i) is the density of the PHPLC-GFP molecules and D is the diffusion coefficient. The calculation frequencies were 20 s−1 for both the Virtual Cell and the diffusion.
When modelling the Kir current, we assume the number of PI(4,5)P2 molecules needed to open a single Kir2.1 channel as well as the Kd for the binding of PI(4,5)P2 to Kir2.1 channel because the actual values are unknown. Modelling was performed after assigning the Kd a value of 2,000 and the number of PI(4,5)P2 molecules needed to open the Kir2.1 channel a value of 4. We tested the effect of assigning other values to these two parameters, but the calculated kinetics of the Kir current upon Ci-VSP activity deviated markedly from the experimental data in those cases. The value of 4 for PI(4,5)P2 molecules needed to open the Kir2.1 channel is consistent with recent findings that an individual subunit needs to bind PI(4,5)P2 for full channel activities of Kir channels (Jin et al. 2008; Xie et al. 2008), but is not consistent with findings that Kir channels with one, two and three PI(4,5)P2 are active to some extent (Jin et al. 2008; Xie et al. 2008).
Initial conditions and rate constants are shown in the Tables. The calculations were started after the system reached equilibrium.
Results
Kir2.1 reports the phosphatase activity of Ci-VSP at high membrane potentials: a TEVC study
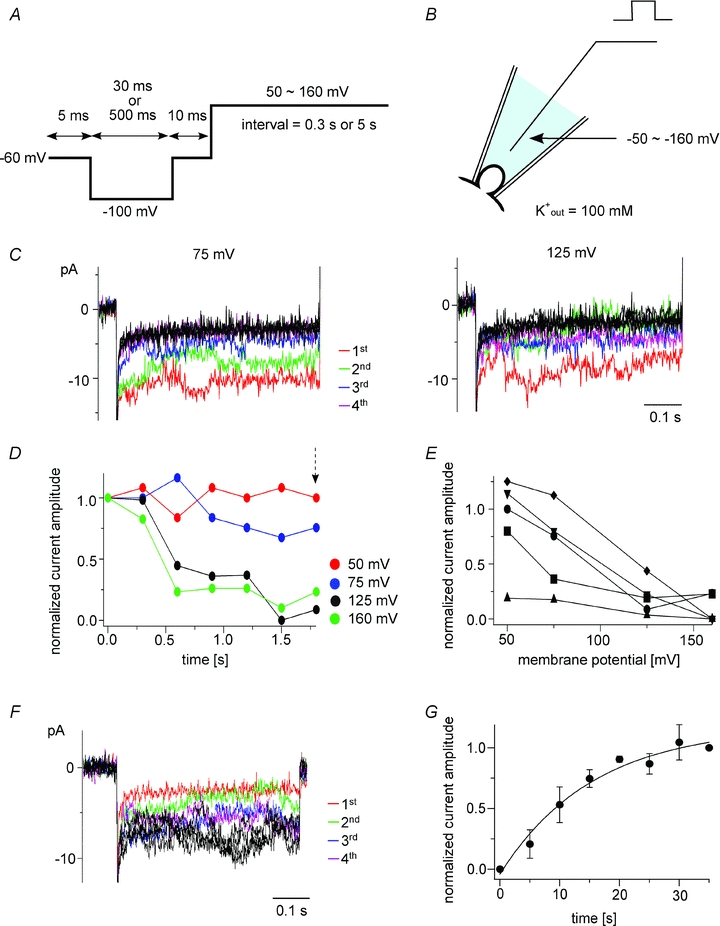
Ci-VSP and Kir2.1 were coexpressed in Xenopus oocytes (Fig. 1B), and the depolarization-dependent phosphatase activity of Ci-VSP was monitored by measuring Kir channel activity using TEVC. Kir channel currents were measured using step pulses to −120 mV (Fig. 1C) with an interval voltage that was set to 50 mV, 75 mV, 125 mV or 160 mV (Fig. 1D and E). Based on our earlier work (Murata et al. 2005), in which we fitted the ‘sensing’ charge of Ci-VSP with the Boltzmann equation, we set the values of V1/2 and z to 69.8 mV and 1.09, respectively. Under these conditions, the relative amplitudes of the ‘sensing’ charges were estimated to be 0.30, 0.55, 0.91 and 0.98, respectively, at the aforementioned interval voltages (Fig. 1A). With repeated stimulation, Kir currents declined more rapidly as the interval voltage was increased from 50 mV to 125 mV (Fig. 1D and E). However, the sharpness of the decay at 125 mV and 160 mV did not significantly differ (Fig. 1D–F), which suggests that Ci-VSP activity increased in the voltage range extending from 50 mV to 125 mV, but saturated at around 125 mV and did not increase at 160 mV. As shown in Fig. 1F, the amplitude of the decrease in the currents differed among oocytes. This could be due to a difference in the level of Ci-VSP expression, since oocytes that strongly expressed Ci-VSP would be expected to deplete PI(4,5)P2 faster. To determine the relation between the level of Ci-VSP expression and the sharpness of the decay, we recorded Ci-VSP ‘sensing’ currents from the same oocytes in which the voltage-dependent decay in the Kir currents was measured (Fig. 2D) (see Methods for details). The decay of the Kir currents was sharper in oocytes that expressed higher levels of Ci-VSP (Fig. 2A and B). This is clear from pooled data in which the difference in Kir current amplitude between 125 mV and 75 mV was plotted against the maximum ‘sensing’ charge (Fig. 2C).
Figure 1. Changes in Kir2.1 channel activity report the enzymatic activity of Ci-VSP at high membrane potentials.
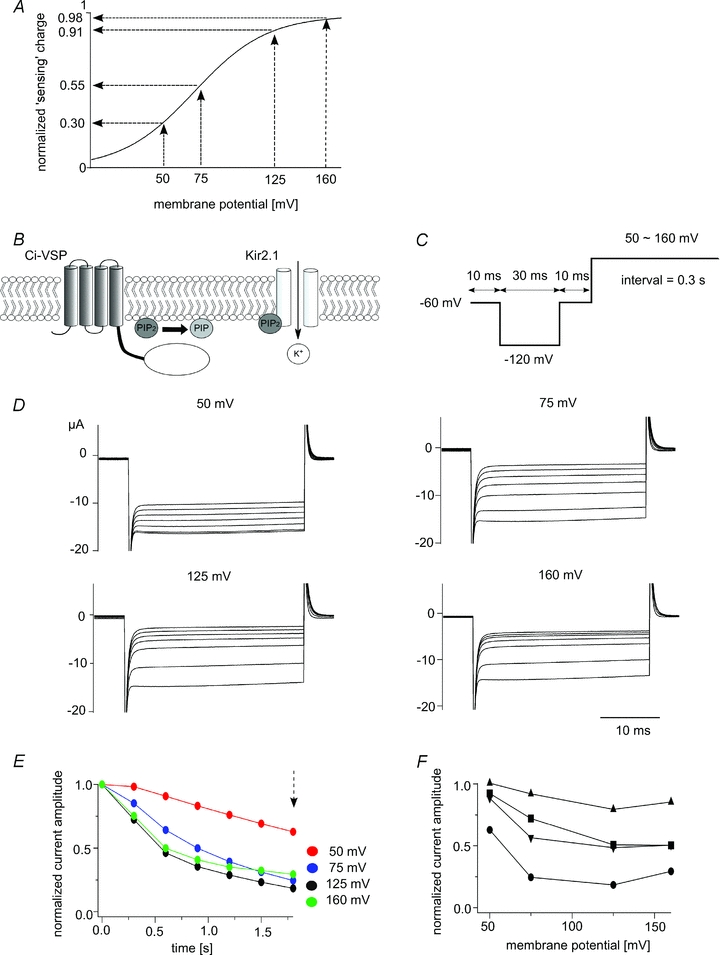
A, relative amplitude of the ‘sensing’ charge at four membrane potentials. The Q–V curve follows the Boltzmann equation: Q = 1/(1 + exp(zF(V1/2–V)/RT)), z = 1.09, V1/2 = 69.8 (Murata & Okamura, 2007). B, scheme for the measurement of the voltage-dependent phosphatase activity of Ci-VSP using Kir2.1 K+ channels. PI(4,5)P2 is depleted when Ci-VSP is activated, which leads to a decline in Kir2.1 channels activity. C, pulse protocol used under TEVC. D, families of the Kir2.1 currents elicited when the interval voltages were set to 50, 75, 125 or 160 mV. Kir2.1 currents elicited during repetitive test pulses to −120 mV applied every 0.35 s are superimposed. Data sets for interval voltages of 50 to 160 mV were collected from the same oocytes. E, plots of the normalized current amplitudes derived from the data sets shown in D. The amplitude of the inward Kir2.1 current at each repetition was normalized to the magnitude at the first episode. Current amplitude was measured as the average of the last 10 ms of the test pulse stepped to −120 mV. F, voltage dependency of the reduction in Kir2.1 current amplitude in four oocytes. Normalized current amplitudes measured 1.8 s after the onset of the pulse protocol (dotted arrow in E) are plotted. Different symbols show data from different oocytes.
Figure 2. Relation between the level of Ci-VSP expression and the sharpness of the decay of the Kir current.
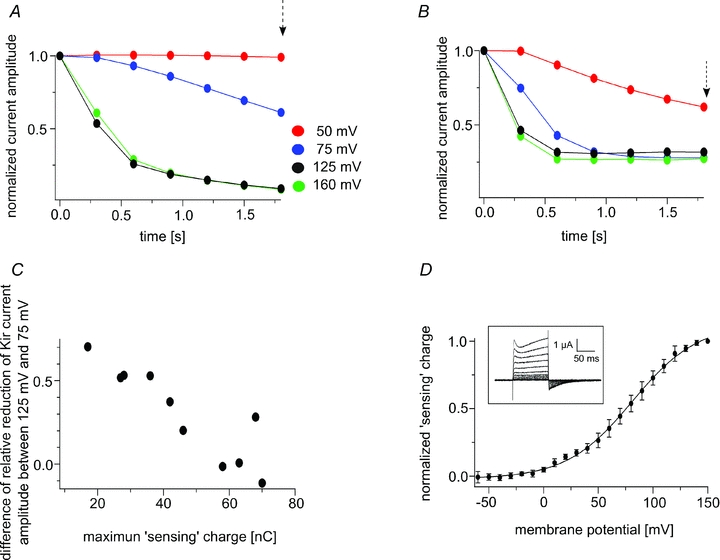
A and B, Kir current decay in oocytes whose maximum ‘sensing’ charges were 36.4 nC and 63.2 nC, respectively. The pulse protocol was identical to that used in Fig. 1. C, voltage dependence of the decay apparently depends on the level of Ci-VSP expression. Differences of the normalized current amplitude of the Kir current between 125 mV and 75 mV 1.8 s after the onset of the pulse protocol (arrow in A and B) were plotted against the maximum ‘sensing’ charge. D, measurements of the ‘sensing’ current. Symbols in the Q–V plots are means ± SD (n = 5). The inset shows representative traces of the ‘sensing’ current. The continuous line represents the curve fitted with the Boltzmann equation: Q = 1 / (1+exp (zF(V1/2–V)/RT)). V1/2 and z were estimated to be 81.1 and 1.2, respectively. The holding potential was −60 mV, and step pulses were applied from −60 mV to 150 mV. Traces are shown only from −60 mV to 140 mV with 20 mV increments.
Following their depolarization-induced decay, Kir channel currents gradually recovered when the membrane potential was held at –60 mV (Fig. 3A). This was probably dependent on the activity of endogenous PI5-kinase, which restores the levels of PI(4,5)P2 on the plasma membrane (Falkenburger et al. 2010). The recovery occurred in two phases: rapid recovery for 50 s and slower recovery later (Fig. 3B). The recovery after depolarizing to 75 mV was fitted by the double exponential formula, and the average time constants of the fast and slow components were estimated to be 1.6 s and 44.5 s, respectively (n = 3) (Fig. 3B). We often noted an initial delay in the recovery phase. The pulse frequency in our pulse protocol was not sufficient to resolve this delay, and we did not pursue this phenomenon further in this study.
Figure 3. Recovery of Kir2.1 activity following the depletion of PI(4,5)P2.
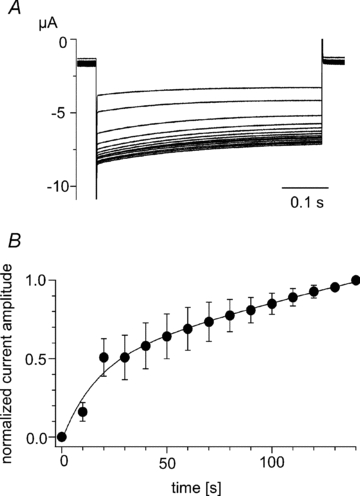
A, superimposed current traces recorded during recovery of Kir2.1 activity after depolarization to 75 mV using the protocol shown in Fig. 1C. Currents elicited by repetitive test pulses to −120 mV every 10 s are superimposed. The interval voltage was −60 mV. B, plots of the increase in Kir current amplitude shown in A; symbols are means ± SD (n = 3). The line is the curve fitted with a double exponential formula. The average time constants and coefficients were respectively 1.6 s and −0.477 for the fast component and 44.5 s and −2.0 for the slow component.
Phosphatase activity at high membrane potentials recorded in the on-cell patch configuration
The phosphatase activity of Ci-VSP during strong depolarization of small regions of oocyte membrane was also examined using the on-cell patch configuration (Fig. 4B). The bath solution contained a high concentration of K+ (100 mm K+) to clamp the membrane potential close to 0 mV, and the Kir activity was measured at the four interval voltages: 50 mV, 75 mV, 125 mV and 160 mV (Fig. 4A). In this configuration, Ci-VSP distributing out of the patch membrane was mildly activated because the membrane was depolarized at around 0 mV ([K+]o = 100 mm). As in the TEVC configuration, the speed of the depolarization-induced reduction in Kir current amplitude increased as the membrane voltage was increased from 50 mV to 125 mV (Fig. 4C and D), while the decay speeds at 125 mV and 160 mV did not significantly differ (Fig. 4D). In four of five patches, Kir current amplitudes, measured 1.8 s after the onset of the pulse protocol, were similar at 125 mV and 160 mV (Fig. 4E). The Kir activity recovered following PI(4,5)P2 depletion when the membrane potential was held at −60 mV (Fig. 4F and G). The pattern of recovery was faster than that measured using TEVC (Fig. 3) and, unlike with TEVC, the time course of the recovery was monophasic. The average time constant of the recovery after depolarizing to 75 mV in the single exponential fitting was 15.6 s (n = 3) (Fig. 4G).
Figure 4. Voltage-dependent reductions in Kir2.1 currents recorded in the on-cell patch configuration.
A, pulse protocol for measuring Kir2.1 currents dependent on Ci-VSP phosphatase activity. B, scheme of the on-cell patch configuration. The bath solution contained 100 mm K+ in order to clamp the cell membrane close to 0 mV. C, families of Kir2.1 currents recorded when the interval voltage was set to 75 or 125 mV. Current traces elicited during repetitive test pulses to −100 mV applied every 5.5 s are superimposed. D, time course of the normalized current amplitudes for the indicated pulses. All data were collected from the same patch. Each current amplitude was calculated by subtracting the current evoked by the final test pulse, when the interval voltage was set to 160 mV. E, voltage dependence of the reduction in Kir2.1 current amplitude in five patches. Normalized current amplitudes measured 1.8 s after the onset of the pulse protocol (arrow in D) are plotted. The same symbols show the data from single oocytes. F, recovery of Kir2.1 currents following stimulation using the protocol shown in A. Current traces evoked during repetitive test pulses to −120 mV applied every 5 s are superimposed. The holding potential was −60 mV. G, plots showing the recovery of Kir2.1 activity after depolarization to 75 mV. The symbols are means ± SD (n = 3). The line is the curve fitted with a single exponential formula. The average time constant was 15.6 s.
Changes in PHPLC-GFP fluorescence at highly positive membrane potentials
We next assessed Ci-VSP activity at highly positive membrane potentials using PHPLC-GFP as previously described (Murata & Okamura, 2007) (Fig. 5A). To verify that the observed reductions in PHPLC-GFP fluorescence were due to loss of PI(4,5)P2 and not deformation or movement of the plasma membrane, another fluorescent protein, Lyn-HcRed, which contains a membrane anchoring sequence at its N-terminus, was expressed, and the change in the fluorescence intensity of HcRed was monitored along with that of PHPLC-GFP in the same oocytes (Fig. 5B and C). Whereas PHPLC-GFP fluorescence decayed upon depolarization, HcRed fluorescence did not change significantly, confirming that the decay in the PHPLC-GFP fluorescence resulted from a reduction in the density of PI(4,5)P2 at the cell contour (Fig. 5B and C). Therefore, only the PHPLC-GFP signal was measured in the following studies.
Figure 5. GFP fluorescence decay does not reflect deformation of the plasma membrane.
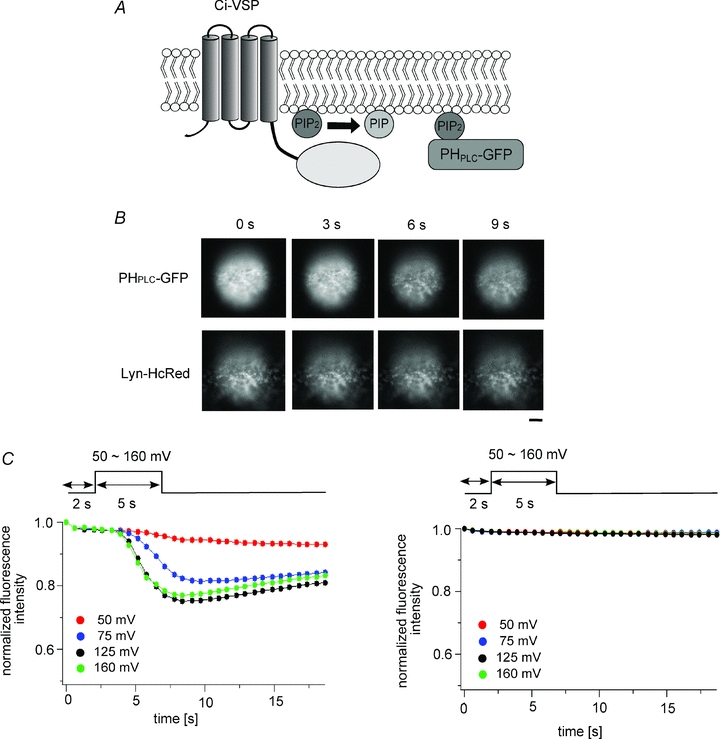
A, scheme for GFP-based measurement of Ci-VSP activity using PI(4,5)P2 depletion. Fluorescence of PHPLC-GFP on the plasma membrane declines upon depletion of PI(4,5)P2. B, epifluorescence images of an oocyte coexpressing Ci-VSP, PHPLC-GFP and Lyn-HcRed. Shots taken every 3 s from the onset of the protocol are shown. Bar, 10 μm. C, the intensity of the PHPLC-GFP fluorescence changed in a voltage-dependent manner (left panel), but the HcRed fluorescence did not (right panel).
To resolve the depolarization-evoked changes of PHPLC-GFP fluorescence on a subsecond time scale, a confocal microscope was used in the XT-mode (Fig. 6A and B), which enabled us to detect two distinct patterns of voltage-dependent reduction in PHPLC-GFP fluorescence (Fig. 6C and D). In one pattern, the decay of the PHPLC-GFP fluorescence became sharper as the membrane potential was increased from 50 mV to 125 mV, but the decay at 160 mV was no sharper than at 125 mV (Fig. 6C). A plot of the fluorescence change expressed as the relative magnitude 7 s after the onset of the depolarizing pulse indicates that Ci-VSP activity increased as the membrane voltage became more positive and saturated at around 125 mV (Fig. 6E) (n = 4). In other oocytes, however, the decay at 50 mV was as sharp as at 125 or 160 mV (Fig. 6D), and the relative change in the fluorescence signal did not increase remarkably from 50 mV to 160 mV (Fig. 6F) (n = 5). Oocytes that showed a clear change in Ci-VSP activity between 75 mV and 125 mV were defined as type I oocytes (Fig. 6C and E), while those that did not show a significant difference between the two membrane potentials were defined as type II oocytes (Fig. 6D and F).
Figure 6. Voltage-dependent Ci-VSP phosphatase activity measured by monitoring PI(4,5)P2-dependent membrane trapping of PHPLC-GFP.
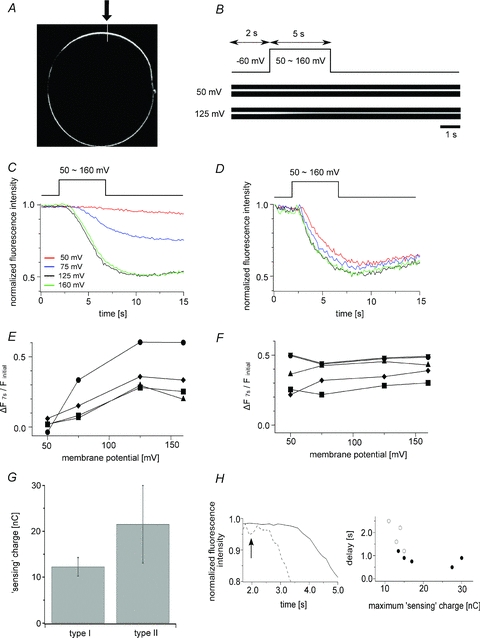
A, confocal image of an oocyte expressing PHPLC-GFP (XY mode). PHPLC-GFP was localized at the cell contour. B, representative confocal images of the oocyte at 50 mV and 125 mV (XT mode). The region indicated by the white line in A (arrow) was imaged in XT mode. The oocytes were depolarized 2 s after the measurements were started. The holding potential was −60 mV. C and D, voltage-dependent changes in fluorescence intensity. C, representative data in which the decay at 125 mV is significantly sharper than that at 50 mV (type I oocytes). D, representative data in which the decay at 50 mV is as sharp as at 125 mV (type II oocytes). The data sets were collected from the same oocytes. E, voltage-dependent change in PHPLC-GFP fluorescence intensity in four type I oocytes. ΔF7s is defined as: 1 – (fluorescence intensity at 7 s)/(initial fluorescence intensity). F, voltage-dependent changes in PHPLC-GFP fluorescence intensity in five type II oocytes. G, comparison of the magnitudes of the maximum ‘sensing’ charge in type I and II oocytes. The maximum ‘sensing’ charge in type I oocytes was significantly larger than in type II oocytes (21.5 ± 8.5 nC vs. 12.3 ± 2.0, mean ± SD; n = 4 for type I and n = 5 for type II; P < 0.05). H, relationship between the latency of PHPLC-GFP fluorescence changes following membrane depolarization and the level of Ci-VSP expression. Left panel is high magnification of the initial point of the decay. Continuous and dashed lines indicate the representative data for the fluorescence change in type I and II oocytes at 125 mV, respectively. The arrow indicates the start of depolarization. Right panel shows the relation between the delay time and the level of Ci-VSP expression. The delay time was defined as the time at which the fluorescence intensity at two successive data points became smaller than 98% of the fluorescence intensity at 2 s. Open and filled circles denote type I (n = 4) and II (n = 5) oocytes, respectively.
This observed difference between the type I and II oocytes could be due to a difference in the level of Ci-VSP expression as suggested in the case with Kir2.1 (Fig. 2). Measurement of the Ci-VSP ‘sensing’ charge in each oocyte demonstrated that oocytes classified as type II exhibited larger ‘sensing’ charges than those classified as type I (Fig. 6G), which suggests that the apparent voltage dependence of the fluorescence kinetics was dependent on the level of Ci-VSP expression.
We also found that the onset of the decay in fluorescence was delayed relative to the timing of the depolarization (Fig. 6H). The delay time (see the legend for its detailed definition) in type I oocytes at 125 mV was 1.8 ± 0.6 s (mean ± SD, n = 4), which was significantly larger than in type II oocytes (0.9 ± 0.3 s, mean ± SD, n = 5). By plotting the delay time against the membrane potential, we could see that oocytes exhibiting a larger ‘sensing’ charge tended to have a shorter delay (Fig. 6H), which suggests the distinct patterns seen in type I and type II oocytes reflect a difference in the robustness of the enzymatic activities.
Modelling analysis of the voltage-dependent changes in PHPLC-GFP fluorescence intensity
To more accurately estimate phosphatase activities at different membrane potentials from changes in PHPLC-GFP fluorescence, we applied a mathematical model using the Virtual Cell (Schaff et al. 2000) as a framework (Fig. 7). In this model, PI(4)P and PI(4,5)P2 were included as the only phosphoinositides whose densities were assumed to be controlled by the activity of PI-5 kinase and PI-5 phosphatase (Fig. 7A). Such modelling was used previously with FRET-based detection of PI(4,5)P2 to study the quantitative relationship between KCNQ2/3 channel activity and PI(4,5)P2 levels (Falkenburger et al. 2010). We assumed that the phosphatase activity of Ci-VSP follows Michaelis–Menten kinetics. Values of the KM and Vmax for PI(3,4,5)P3 obtained experimentally in our earlier study (Murata et al. 2005) were adopted as the KM and Vmax for PI(4,5)P2, because detailed results of in vitro measurements of enzymatic activities toward PI(4,5)P2 are not yet available.
Figure 7. Modelling analyses of PHPLC-GFP fluorescence intensity induced by stimulation of Ci-VSP phosphatase activity.
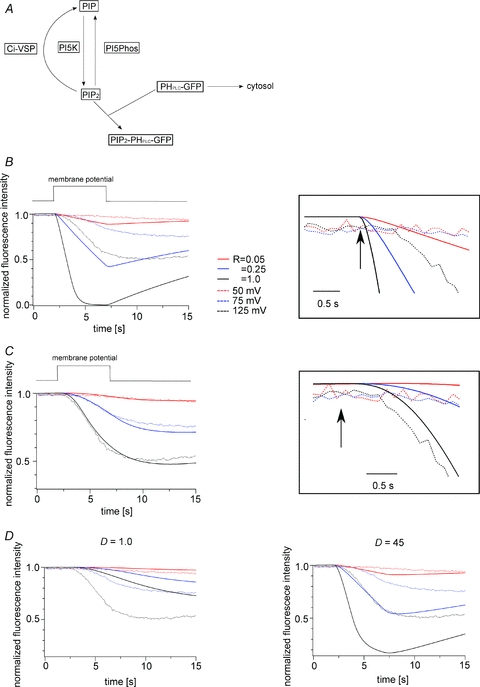
A, scheme of the modelling. B, result obtained in the model when diffusion of PHPLC-GFP was not taken into account. Dotted and continuous lines indicate the experimental data and the modelling results, respectively. The right panel is a magnified view of the decay after the onset of depolarization (arrow). C, result obtained in the model when diffusion of PHPLC-GFP was taken into account. The experimental data and Ci-VSP density are the same as in B. [Ci-VSP] = 21,894 μm−1, D = 4.5 μm2 s−1. Right panel is a magnified view. D, fitting of the PHPLC-GFP fluorescence data while changing the value of diffusion coefficient (D). The diffusion coefficients were set to 1.0 μm2 s−1 for the left panel and 45 μm2 s−1 for the right panel. Dotted and continuous lines indicate the experimental data shown in B and the results estimated from the model, respectively. The colour code is the same as in B.
In our measurements, the fluorescence signals within the focal plane are derived from both the membrane-docked PHPLC-GFP and unbound PHPLC-GFP, and it takes time for unbound PHPLC-GFP to leave the focal plane after depletion of PI(4,5)P2. We therefore added the process of PHPLC-GFP diffusion to the model. It is assumed that PHPLC-GFP molecules within approximately 5 μm from the plasma membrane are detected as a fluorescence signal because the thickness of the bright layer on the plasma membrane, estimated by counting the numbers of the pixels in our confocal images, was 5.2 ± 1.5 μm (mean ± SD, n = 9). The voltage-dependent activity of Ci-VSP (defined as R) was expressed relative to the maximum reaction rate (Vmax). The R value was introduced based on the idea that the voltage sensor tunes the phosphatase activity by altering the Vmax of the enzyme. R = 1 means that Ci-VSP works with the Vmax value that was previously measured in vitro with the purified cytoplasmic region of Ci-VSP (Murata et al. 2005). Initial conditions, rate constants and equations for each reaction are listed in Tables 1 and 2. The Ci-VSP density was estimated by measuring the maximum magnitude of the ‘sensing’ charge in individual oocytes. If the process of PHPLC-GFP diffusion was not taken into account, the reconstituted curves greatly deviated from the measured time course of the PHPLC-GFP signal at each membrane potential (Fig. 7B). By contrast, when diffusion was taken into account, the time course of the depolarization-induced change in PHPLC-GFP fluorescence was well fit by the model at the voltages tested (Fig. 7C). Because the diffusion coefficient for PHPLC-GFP beneath the cell membrane of Xenopus oocytes is not known, it was set as a variable for fitting the experimental data (Fig. 7C and D) and estimated to be 4–10 μm2 s−1 (n = 4).
Table 1.
Initial conditions and rate constants for the modelling
| Parameter | Value | Units | Rationale |
|---|---|---|---|
| PHPLC-GFP_cytosol | 2 | μm | Xu et al. (2003) |
| PHPLC-GFP_membrane | 3,000 | μm−2 | Falkenburger et al. (2010) |
| PI(4,5)P2 | 4,000 | μm−2 | Xu et al. (2003) |
| PI(4)P | 3,125 | μm−2 | Willars et al. (1998); ratio to PI(4,5)P2 |
| Kd between PHPLC-GFP and PI(4,5)P2 | 2 | μm | Lemmon et al. (1995); Hirose et al. (1999); Xu et al. (2003) |
| KM for Ci-VSP | 36 | μm | Murata et al. (2005) |
| Vmax for Ci-VSP | 0.185 | s−1 molecule−1 | Murata et al. (2005) |
| PI-5 kinase | 0.04 | s−1 | Fit to the decay and the recovery of the fluorescence |
| PI-5 phosphatase Kd between Kir 2.1 and PI(4,5)P2 | 0.02 2,000 | s−1μm−2 | Fit to the decay and the recovery of the fluorescence Fit to the decay of the Kir current |
Table 2.
Equations for the modelling
| Reaction | Rate equation |
|---|---|
| Dephosphorylation of PI(4,5)P2 by PI-5 phosphatase | kPI5Phos×[PI(4,5)P2] |
| Phosphorylation of PI(4)P by PI-5 kinase | kPI5K×[PI(4)P] |
| Binding of PI(4,5)P2 to PHPLC-GFP | kf,PHD×[PI(4,5)P2]× PHD_GFP_cyto−kr,PHD× PHD_GFP_PI(4,5)P2 |
| Ci-VSP activity | Vmax×[PI(4,5)P2]/ (KM+[PI(4,5)P2]) |
| Reaction rate between no and nc | kf,Kir×nc×[PI(4,5)P2]–kr,Kir×no |
kPI5Phos: rate constant of the reaction to dephosphorylate PI(4,5)P2; [PI(4,5)P2]: density of PI(4,5)P2 on plasma membrane; [PI(4)P]: density of PI(4)P on plasma membrane; kPI5K: rate constant of the reaction to phosphorylate PI(4)P; kf,PHD: rate constant of the reaction that PI(4,5)P2 binds to PHPLC-GFP; kr,PHD: rate constant of the reaction that PI(4,5)P2 dissociates from the complex of PHPLC-GFP and PI(4,5)P2; PHD_GFP_cyto: concentration of PHPLC-GFP in cytosol; PHD_GFP-PI(4,5)P2: density of PHPLC-GFP bound to PI(4,5)P2 on plasma membrane; kf,Kir and kr,Kir: rate constant of the reaction that Kir2.1 channel binds to and dissociates from the PI(4,5)P2, respectively; nc and no: densities of closed and open Kir channel, respectively.
The two patterns of voltage-dependent decay of PHPLC-GFP fluorescence described above (Fig. 6C and D) correlated with the magnitude of the ‘sensing’ charge, raising the possibility that the difference reflects the level of Ci-VSP expression. We therefore tested whether modelling using a different level of Ci-VSP expression could reconstitute the different patterns of voltage-dependent decay. We chose as an example the oocyte shown in Fig. 7C, and simulated the kinetics of the GFP fluorescence by changing the density of Ci-VSP while holding the other parameters constant. Based on the charges carried during the motion of the VSD upon repolarization (Qoff), the density of Ci-VSP was estimated at 21,894 μm−2 in this oocyte. When the density of Ci-VSP was changed to 5,000 μm−2, the decay kinetics were slower, and the fluorescence intensity did not sharply decay at R = 0.05 (Fig. 8A, left panel). When the Ci-VSP density was changed to 100,000 μm−2, the decays were similar between at R = 1 and at R = 0.25 (Fig. 8A, right panel). These findings suggest that the sharpness of the fluorescence decay depends on the level of Ci-VSP expression, and that the decay kinetics become similar irrespective of the R value when the level of Ci-VSP expression is high.
Figure 8. The level of Ci-VSP expression influences the sharpness and the timing of the fluorescence decay.
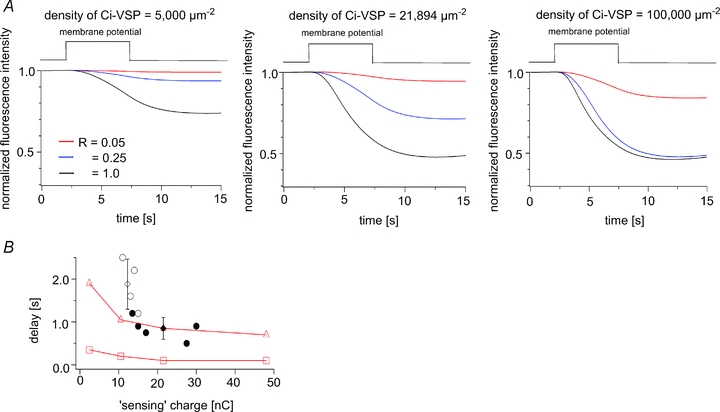
A, simulation of PHPLC-GFP fluorescence showing the changes occurring at the three indicated Ci-VSP densities. D = 4.5 μm2 s−1. Note that the sharpness of the decay depends on the level of Ci-VSP expression. B, relationship between the delay and the maximum ‘sensing’ charge. The definition of the delay time is described in the legend of Fig. 6H. Red triangles and squares indicate the decay estimated from the model with and without diffusion, respectively. Open and filled circles indicate the data from type I and type II oocytes, respectively. The delay times in type I oocytes were significantly longer than in type II oocytes (1.8 ± 0.6 s (open diamonds) vs. 0.9 ± 0.3 s (filled diamond), mean ± SD; P < 0.01).
A time lag between the onset of depolarization and the onset of fluorescence decay noted in the measurements of PHPLC-GFP (Fig. 6H) was also seen in the reconstituted curves when diffusion was incorporated into the model (right panels in Fig. 7B and C). Notably, the delay in the reconstituted kinetics of the fluorescence signal became shorter as the maximum ‘sensing’ charge increased, mimicking the experimental results (Fig. 8B). These findings are consistent with the idea that the delays reflect both the diffusion of PHPLC-GFP and the level of Ci-VSP expression (Fig. 8B).
The data were fitted using a model for an individual oocyte (Fig. 9A). The R values at four voltages were estimated from four oocytes and compared with the Q–V curve for Ci-VSP in Fig. 9B. The results show that the enzymatic activity increases as the magnitude of the VSD motion increases, and that it saturates as the voltage VSD movement becomes maximal.
Figure 9. Voltage dependence of Ci-VSP phosphatase activity calculated from the PHPLC-GFP fluorescence studies.
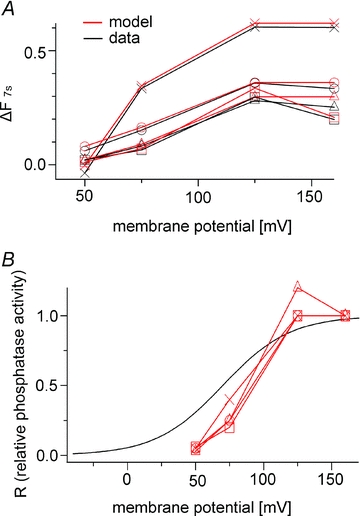
A, each set of experimental data was fitted with the model. The enzyme activity at 160 mV was defined such that R = 1, and the data obtained at 50 mV, 75 mV and 125 mV were fitted by changing the R value in individual oocytes. B, R values estimated in A are plotted against the membrane potential together with the Ci-VSP ‘sensing’ charges (black line). The Q–V curve was derived from the Boltzmann equation: Q = 1/(1 + exp(zF(V1/2–V)/RT)), z = 1.09, V1/2 = 69.8 (Murata et al. 2005). Red lines indicate R. In A and B, data from four oocytes are shown as different symbols.
Modelling analysis of the voltage-dependent changes in Kir2.1 channel activity
A mathematical model was also applied for the measurement of Kir2.1 channel activity upon Ci-VSP activation (Fig. 10). In the scheme of the model (Fig. 10A), instead of the components for PHPLC-GFP, two states (activated and inactivated states) of the Kir2.1 channel were introduced (Fig. 10A). Individual subunit of Kir2.1 has been believed to bind at least one PI(4,5)P2. Although relationship between stoichiometry of PI(4,5)P2 and Kir2.1 channel activities is still elusive, recent studies with tandem subunits with mutation of altered PI(4,5)P2 sensitivity have shown that Kir channel can be active to some extent even when less than four subunits bind PI(4,5)P2, but Kir channel activities are much more robust when each of four subunits binds PI(4,5)P2 (Jin et al. 2008; Xie et al. 2008). In our model analysis, we chose a simple scheme that binding of PI(4,5)P2 to individual subunit of Kir2.1 channel is required for Kir2.1 channel to be active. The Ci-VSP density on the oocyte membrane was estimated by measuring the maximum ‘sensing’ charge as in Fig. 2. The Kir2.1 channel density was estimated from macroscopic Kir currents measured using both TEVC and single-channel current amplitudes, and the open probability was determined using on-cell patch recording (Supplementary Fig. 1). In our modelling, the Kd was set at 2,000 (see Methods for details). At the initial stage of this analysis, as in the case of PHPLC-GFP, the current decay was modelled with an R value of 1. However, the simulated decays at 125 mV were sharper than the experimental data (Fig. 10B, green line). We found that when the R value was set to 0.3–0.4, the model reconstituted well the decay time course of Kir currents at 125 mV (n = 4) (Fig. 10B), and was able to fit the time course of Kir current decay at other membrane potentials when R was set to smaller values (Fig. 10C). We then tested whether depletion of PHPLC-GFP upon depolarization to 125 mV could be reconstituted in the model by setting the R value to 0.3–0.4. With this R value, the reconstituted curve mimicked the time course of the depletion of PHPLC-GFP when the diffusion coefficient of PHPLC-GFP was changed from 4.5 μm2 s−1 to 6.0 μm2 s−1 (Fig. 10D).
Figure 10. Modelling analysis of Kir2.1 activity elicited by stimulation of Ci-VSP.
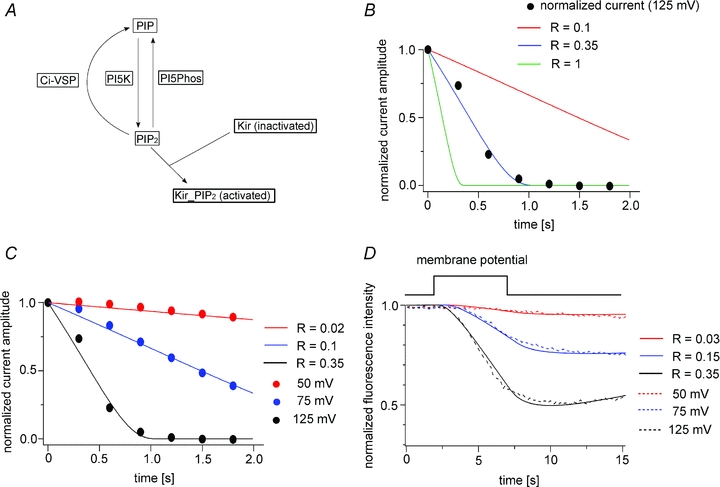
A, scheme of the modelling of Kir2.1 activity. B, model of the decay of Kir2.1 currents at 125 mV with various R values. C, example in which the data obtained at three membrane potentials are fitted with the model. Residual leak currents after the decrease in the currents upon activation of Ci-VSP were subtracted. D, PHPLC-GFP data are fitted with the model under the conditions in which R does not exceed 0.35. Data at 125 mV were fitted using an R value of 0.35, after which data obtained at different voltages were fitted by changing only the value of R. D = 6.0 μm2 s−1.
The time course of Kir current recovery following PI(4,5)P2 depletion (Figs 3 and 4G) was also compared with the curve reconstituted by the model (Fig. 11). In the TEVC configuration, the reconstituted curve showed a similar time course to the recovery of Kir currents during the early phase, up to 20–30 s from the onset, but not at later times (Fig. 11A). In the on-cell patch configuration, the reconstituted curve was slightly slower than the experimental data (Fig. 11B).
Figure 11. Model prediction of the recovery of Kir2.1 currents.
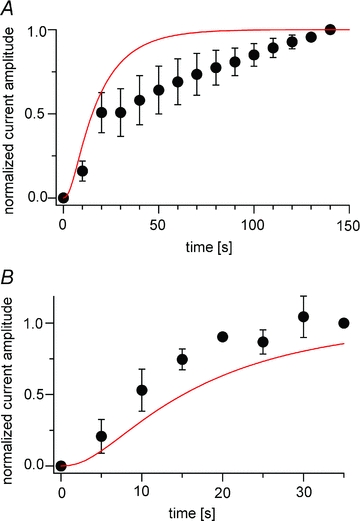
A and B, the predicted recoveries of PI(4,5)P2 and the Kir current are superimposed on the experimental data obtained in the TEVC (A) and on-cell patch (B) configurations. Red lines represent the Kir current recovery predicted by the simulation. The experimental data shown here are the same as those shown in Figs 3B and 4G, respectively.
R values were obtained at four membrane potentials from individual oocytes by fitting the voltage-dependent decay of the Kir2.1 current (Fig. 12A). Relative R values were plotted against the membrane potential together with the ‘sensing’ charges of Ci-VSP (n = 4) (Fig. 12B). As in the analysis of PHPLC-GFP (Fig. 9), the results suggest that Ci-VSP phosphatase activity increases at high membrane potentials and saturates as the movement of the VSD becomes maximal.
Figure 12. Voltage dependence of Ci-VSP phosphatase activity calculated from the Kir current.
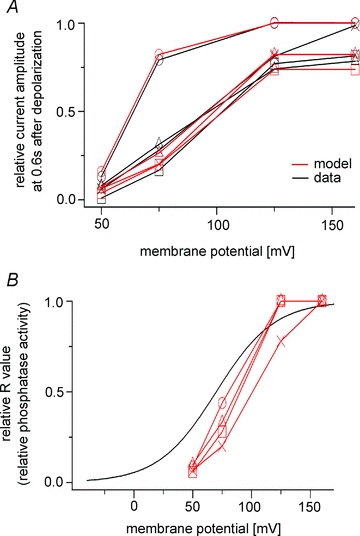
A, each set of experimental data is fitted with the model. Plotted are changes in the relative current amplitudes 0.6 s after the onset of the pulse protocol. Black and red symbols indicate the experimental data and model, respectively. The same symbols represent data sets from identical oocytes. B, relative R values estimated in A are plotted on the Q–V curve for Ci-VSP. Each R value was normalized to that for 160 mV. The black line indicates the Q–V curve for Ci-VSP, which is the same as in Fig. 9B. Data from four oocytes are shown as different symbols.
Discussion
In this study, the phosphatase activity of Ci-VSP was assessed at four membrane potentials representing the entire voltage range over which the movement of the VSD varied; changes of K+ channel activity and PHPLC-GFP fluorescence served as two independent indexes of Ci-VSP activity at high membrane potentials. Measurement of Kir2.1 currents in both TEVC and on-cell patch configurations showed that the phosphatase activity increased as membrane potential became more positive (Figs 1 and 4). Similarly, phosphatase activity estimated from measurements of PHPLC-GFP fluorescence using a mathematical model revealed that Ci-VSP activity increased in the voltage range extending from 50 mV to 125 mV (Figs 9 and 12). Taken together with our earlier findings on phosphatase activity at lower membrane potentials (Murata & Okamura, 2007), the present study indicates that Ci-VSP phosphatase activity is coupled to the movement of the VSD over the entire range of its voltage sensitivity.
Validation of modelling of the PHPLC-GFP fluorescence and Kir2.1 currents
In our modelling of PHPLC-GFP levels, the effect of its diffusion away from the plasma membrane after PI(4,5)P2 depletion was incorporated into the Virtual Cell framework to calculate the density of phosphoinositides and PHPLC-GFP on the plasma membrane. By taking diffusion of PHPLC-GFP into account, a time course similar to that of the fluorescence signal was reconstituted by the model. In our model, the diffusion coefficient for PHPLC-GFP was estimated to be 4–12 μm2 s−1 (Figs 7 and 10D). The kinetics of the fluorescence signal simulated with a value of 45 μm2 s−1 (the right panel of Fig. 7D) did not match well with the experimental data of PHPLC-GFP. The diffusion coefficient of the PH domain fused to GFP in the cytoplasm has been studied in Dictyostelium using fluorescence correlation spectroscopy and it was estimated to be 11–27 μm2 s−1 (Ruchira et al. 2004), a range close to that applied in our analysis.
Besides diffusion of PHPLC-GFP polypeptide, the level of Ci-VSP expression influenced the apparent voltage dependence of the phosphatase activity (Fig. 2). When Ci-VSP was expressed at a higher level, voltage-induced changes in PHPLC-GFP fluorescence saturated at a voltage lower than the voltage at which there was no further increase in charge movement in the Q–V curve (Figs 6G and 8A). Incorporating the diffusion of PHPLC-GFP underneath the plasma membrane and the surface density of Ci-VSP into the model, calculated enzymatic activities showed similar profiles of voltage dependence based on the analyses of different oocytes with distinct expression level of Ci-VSP.
In contrast with the model of PHPLC-GFP fluorescence, a maximum R value of 0.3–0.4 was necessary to be used to represent the extent of the enzymatic activity (Fig. 10B), where the Vmax of Ci-VSP in oocytes is assumed to be 0.3 to 0.4 times that estimated using an in vitro phosphatase assay (Murata et al. 2005). Modelling with larger R values did not provide a good fit to the experimental results (data not shown). In modelling Kir current results, we chose a scheme where four PI(4,5)P2s are needed to bind Kir channel for the channel to be available. Modelling with one for this number of PI(4,5)P2 did not provide good fits of experimental results (data not shown), consistent with reports with tandem subunits with mutation of altered PI(4,5)P2 sensitivity where four PI(4,5)P2 are needed for full availability of Kir channels (Jin et al. 2008; Xie et al. 2008). On the other hand, recent reports (Jin et al. 2008; Xie et al. 2008) suggested that Kir channels with less than four PI(4,5)P2 are active to some extent, whereas in our modelling analysis these Kir channels were assumed to be silent. Despite such possible inaccuracy in our assumption of relationship between PI(4,5)P2 and Kir2.1 channel, setting the maximum R value to 0.3–0.4 still gave a good fit to the experimental data of PHPLC-GFP fluorescence, when the diffusion coefficient was changed to 6–12 μm2 s−1 (n = 4) (Fig. 10D). In addition, in the analysis of the data summarized in Figs 8 and 9, the reconstituted kinetics were not significantly altered by such modification of the parameters (Supplementary Fig. 2).
In the TEVC recording of Kir2.1 channel, recoveries of PI(4,5)P2 level after its depletion due to Ci-VSP's activities occurred in two phases, which differs from previous observations in mammalian cells (Falkenburger et al. 2010). The early recovery phase was similar to that predicted by the model, but the later phase deviated from the predicted time course. This may indicate that our model misses factors that contribute to the slow recovery in Xenopus oocytes. For example, PI-5 kinase activity may depend on the PI(4,5)P2 level or may be down-regulated upon persistent depletion of PI(4,5)P2.
Interestingly, Kir current recovery followed different time courses in the TEVC and on-cell patch configurations. In the on-cell patch configuration, the Kir current could recover through both kinase-dependent production of PI(4,5)P2 and lateral diffusion of PI(4,5)P2 from areas of the membrane beyond the patch membrane, since depletion of PI(4,5)P2 occurs in a local area in this configuration. When the recovery of the Kir current was reconstituted based on the model with lateral diffusion of PI(4,5)P2 and a diffusion coefficient of 0.1 μm2 s−1, the kinetics were similar to the experimental results shown in Fig. 4G (data not shown). However, rapid recovery through lateral diffusion may not be expected in our experimental set-up. This is because the global level of PI(4,5)P2 could be reduced when the entire oocyte membrane, except the area under patch pipette, is held to about 0 mV, a voltage at which Ci-VSP is partially active. Further, the lateral diffusion coefficient for PI(4,5)P2 in Xenopus oocytes is unknown, but the coefficient reportedly ranges widely, from 0.8 μm2 s−1 in HEK cells (Golebiewska et al. 2008) to 0.00039 μm2 s−1 in atrial myocytes (Cho et al. 2005). In addition, Cho et al.(2006) showed that the speed of lateral diffusion is different in CHO cells than in HEK cells.
It is also known that PI(4,5)P2 is sequestered in specific membrane domains, such as lipid rafts (Martin, 2001; Johnson et al. 2008). Improved on-cell patch recordings of Kir currents in the presence of Ci-VSP or an orthologue may enable establishment of a useful model with which to study local PI(4,5)P2 dynamics that are involved in many physiological events.
Insights into operating mechanism and physiological roles of Ci-VSP
The voltage range over which Ci-VSP exhibits its phosphatase activity is similar to the range over which the VSD exhibits charge movement (Figs 9B and 12B). VSDs in voltage-gated ion channels regulate the activity of the pore domain, though it has been established that the voltage dependency of the VSD is less steep than that of the ion conductance (Bezanilla, 2000). Because voltage-gated K+ channels generally form tetramers and exhibit cooperativity among the four subunits (Bezanilla, 2000), the voltage dependency of the ion permeation is sharper than that of VSD movement. Our finding that phosphatase activity is coupled to VSD movement over the entire voltage range suggests that, unlike voltage-gated K+ channels, Ci-VSP is not subject to cooperativity among VSDs, which is consistent with the recent finding that Ci-VSP exists as a monomer in Xenopus oocytes (Kohout et al. 2008).
What are the mechanisms underlying the coupling between the VSD and the phosphatase domain at the single protein level? One possibility is that the Ci-VSP enzyme domain has only two states: active and inactive. In that case, maximum and constant phosphatase activity is attained only when the VSD is in a fully activated state, and the number of Ci-VSP molecules in the active state increases as the membrane potential becomes more positive. The other possibility is that the enzymatic activity of single Ci-VSP proteins can be gradually tuned as the membrane potential is altered. Distinct levels of phosphatase activity could be coupled to distinct movement states of the voltage sensor. Further studies will be necessary to determine the precise mechanism of the functional coupling between the VSD and the phosphatase activity of Ci-VSP.
Our conclusion that Ci-VSP phosphatase activity is coupled to the VSD over a span of 100 mV also raises a simple question: does Ci-VSP function at such high membrane potentials in any physiological context? One recent study of Ci-VSP gene expression in ascidian juveniles and adults showed that Ci-VSP is expressed in a subpopulation of blood cells that express the gp91 NADPH oxidase subunit gene (Ogasawara et al. 2011). The gp91 subunit plays a principal role in generating reactive oxygen species in phagocytes, where large depolarizations (>50 mV) take place due to the export of electrons (Bánfi et al. 1999). In addition, phosphoinositides play critical roles in the dynamics of the generation and maturation of phagosomes and endosomes within phagocytes (Kamen et al. 2007; Tiwari et al. 2009). It will be interesting to see whether the voltage range of Ci-VSP's enzymatic activity is, in fact, important for activation in such native environments.
Acknowledgments
We thank Drs M. Takano (Jichii Medical University) and N. Uozumi (Tohoku University) for providing the PHPLC-GFP plasmid, and Dr Yoshihiro Kubo (National Institute for Physiological Sciences, Okazaki, Japan) for providing the Kir2.1 plasmid. We are grateful to lab members for helpful discussion. This work was supported by HFSP research grants, a Mitsubishi Foundation grants, and grants from the Japan Ministry of Education, Culture, Sports, Science and Technology including Targeted Proteins Research Program to Y.O. The virtual cell is supported by National Institutes of Health (NIH) grant P41rr013186 from the National Center for Research Resources.
Glossary
Abbreviations
- GFP
green fluorescent protein
- PH
pleckstrin homology domain
- PI(4)P
phosphatidylinositol-4-monophosphate
- PI(3,4,5)P3
phosphatidylinositol-3,4,5-trisphosphate
- PI(4,5)P2
phosphatidylinositol-4,5-bisphosphate
- PTEN
phosphatase and tensin homologue deleted on chromosome 10
- TEVC
two-electrode voltage clamp
- VSD
voltage sensor domain
- VSP
voltage sensing phosphatase
Author contributions
This work was completed in the laboratory of Y.O. at the Department of Physiology, Graduate School of Medicine, Osaka University. The conception and design of the experiments were led by Y.O. and S.S.; data collection and analysis were performed by S.S and Md.I.H.; mathematical modelling analysis was performed by S.S.; S.S. and Y.O. wrote the paper, and all the authors approved the manuscript.
Author's present address
Md. I. Hossain: Department of Physiology, Membrane Protein Research Group, University of Montreal, Quebec, H3C 3J7, Canada.
Supplementary material
Supplemental figure 1
Supplemental figure 2
As a service to our authors and readers, this journal provides supporting information supplied by the authors. Such materials are peer-reviewed and may be re-organized for online delivery, but are not copy-edited or typeset. Technical support issues arising from supporting information (other than missing files) should be addressed to the authors
References
- Bánfi B, Schrenzel J, Nüsse O, Lew DP, Ligeti E, Krause KH, Demaurex N. A novel H+ conductance in eosinophils: unique characteristics and absence in chronic granulomatous disease. J Exp Med. 1999;190:183–194. doi: 10.1084/jem.190.2.183. [DOI] [PMC free article] [PubMed] [Google Scholar]
- Bezanilla F. The voltage sensor in voltage-dependent ion channels. Physiol Rev. 2000;80:555–592. doi: 10.1152/physrev.2000.80.2.555. [DOI] [PubMed] [Google Scholar]
- Cho H, Kim YA, Ho WK. Phosphate number and acyl chain length determine the subcellular location and lateral mobility of phosphoinositides. Mol Cells. 2006;22:97–103. [PubMed] [Google Scholar]
- Cho H, Kim YA, Yoon JY, Lee D, Kim JH, Lee SH, Ho WK. Low mobility of phosphatidylinositol 4,5-bisphosphate underlies receptor specificity of Gq-mediated ion channel regulation in atrial myocytes. Proc Natl Acad Sci U S A. 2005;102:15241–15246. doi: 10.1073/pnas.0408851102. [DOI] [PMC free article] [PubMed] [Google Scholar]
- Drummond GB. Reporting ethical matters in The Journal of Physiology: standards and advice. J Physiol. 2009;587:713–719. doi: 10.1113/jphysiol.2008.167387. [DOI] [PMC free article] [PubMed] [Google Scholar]
- Falkenburger BH, Jensen JB, Hille B. Kinetics of PIP2 metabolism and KCNQ2/3 channel regulation studied with a voltage-sensitive phosphatase in living cells. J Gen Physiol. 2010;135:99–114. doi: 10.1085/jgp.200910345. [DOI] [PMC free article] [PubMed] [Google Scholar]
- Goldin AL. Maintenance of Xenopus laevis and oocyte injection. Methods Enzymol. 1992;207:266–279. doi: 10.1016/0076-6879(92)07017-i. [DOI] [PubMed] [Google Scholar]
- Golebiewska U, Nyako M, Woturski W, Zaitseva I, McLaughlin S. Diffusion coefficient of fluorescent phosphatidylinositol 4,5-bisphosphate in the plasma membrane of cells. Mol Biol Cell. 2008;19:1663–1669. doi: 10.1091/mbc.E07-12-1208. [DOI] [PMC free article] [PubMed] [Google Scholar]
- Halaszovich CR, Schreiber DN, Oliver D. Ci-VSP is a depolarization-activated phosphatidylinositol-4,5-bisphosphate and phosphatidylinositol-3,4,5-trisphosphate 5′-phosphatase. J Biol Chem. 2009;284:2106–2113. doi: 10.1074/jbc.M803543200. [DOI] [PubMed] [Google Scholar]
- Hille B( Ion Channels of Excitable Membranes. Sunderland, MA, USA: Sinauer; 2001. [Google Scholar]
- Hirose K, Kadowaki S, Tanabe M, Takeshima H, Iino M. Spatiotemporal dynamics of inositol 1,4,5-triphosphate that underlies complex Ca2+ mobilization patterns. Science. 1999;284:1527–1530. doi: 10.1126/science.284.5419.1527. [DOI] [PubMed] [Google Scholar]
- Hossain MI, Iwasaki H, Okochi Y, Chahine M, Higashijima S, Nagayama K, Okamura Y. Enzyme domain affects the movement of the voltage sensor in ascidian and zebrafish voltage-sensing phosphatases. J Biol Chem. 2008;283:18248–18259. doi: 10.1074/jbc.M706184200. [DOI] [PubMed] [Google Scholar]
- Huang CL, Feng S, Hilgemann DW. Direct activation of inward rectifier potassium channels by PIP2 and its stabilization by Gβγ. Nature. 1998;391:803–806. doi: 10.1038/35882. [DOI] [PubMed] [Google Scholar]
- Iwasaki H, Murata Y, Kim Y, Hossain MI, Worby CA, Dixon JE, McCormack T, Sasaki T, Okamura Y. A voltage-sensing phosphatase, Ci-VSP, which shares sequence identity with PTEN, dephosphorylates phosphatidylinositol 4,5-bisphosphate. Proc Natl Acad Sci U S A. 2008;105:7970–7975. doi: 10.1073/pnas.0803936105. [DOI] [PMC free article] [PubMed] [Google Scholar]
- Jin T, Sui JL, Rosenhouse-Dantsker A, Chan KW, Jan LY, Logothetis DE. Stoichiometry of Kir channels with phosphatidylinositol bisphosphate. Channels. 2008;2:19–33. doi: 10.4161/chan.2.1.5942. [DOI] [PubMed] [Google Scholar]
- Johnson CM, Chichili GR, Rodgers W. Compartmentalization of phosphatidylinositol 4,5-bisphosphate signaling evidenced using targeted phosphatase. J Biol Chem. 2008;283:29920–29928. doi: 10.1074/jbc.M805921200. [DOI] [PMC free article] [PubMed] [Google Scholar]
- Kamen LA, Levinsohn J, Swanson JA. Differential association of phosphatidylinositol 3-kinase, SHIP-1, and PTEN with forming phagosomes. Mol Biol Cell. 2007;18:2463–2472. doi: 10.1091/mbc.E07-01-0061. [DOI] [PMC free article] [PubMed] [Google Scholar]
- Kohout SC, Bell SC, Liu L, Xu Q, Minor DL, Jr, Isacoff EY. Electrochemical coupling in the voltage-dependent phosphatase Ci-VSP. Nat Chem Biol. 2010;6:369–375. doi: 10.1038/nchembio.349. [DOI] [PMC free article] [PubMed] [Google Scholar]
- Kohout SC, Ulbrich MH, Bell SC, Isacoff EY. Subunit organization and functional transitions in Ci-VSP. Nat Struct Mol Biol. 2008;15:106–108. doi: 10.1038/nsmb1320. [DOI] [PubMed] [Google Scholar]
- Lemmon MA, Ferguson KM, O'Brien R, Sigler PB, Schlessinger J. Specific and high-affinity binding of inositol phosphates to an insolated pleckstrin homology domain. Proc Natl Acad Sci U S A. 1995;92:10 472–10 476. doi: 10.1073/pnas.92.23.10472. [DOI] [PMC free article] [PubMed] [Google Scholar]
- Maehama T, Taylor GS, Dixon JE. PTEN and myotubularin: novel phosphoinositide phosphatases. Annu Rev Biochem. 2001;70:247–279. doi: 10.1146/annurev.biochem.70.1.247. [DOI] [PubMed] [Google Scholar]
- Martin TF. PI(4,5)P2 regulation of surface membrane traffic. Curr Opin Cell Biol. 2001;13:493–499. doi: 10.1016/s0955-0674(00)00241-6. [DOI] [PubMed] [Google Scholar]
- Murata Y, Iwasaki H, Sasaki M, Inaba K, Okamura Y. Phosphoinositide phosphatase activity coupled to an intrinsic voltage sensor. Nature. 2005;435:1239–1243. doi: 10.1038/nature03650. [DOI] [PubMed] [Google Scholar]
- Murata Y, Okamura Y. Depolarization activates the phosphoinositide phosphatase Ci-VSP, as detected in Xenopus oocytes coexpressing sensors of PIP2. J Physiol. 2007;583:875–889. doi: 10.1113/jphysiol.2007.134775. [DOI] [PMC free article] [PubMed] [Google Scholar]
- Ogasawara M, Sasaki M, Nakazawa N, Nishino A, Okamura Y. Gene expression profile of Ci-VSP in juveniles and adult blood cells of ascidian. Gene Expr Patterns. 2011;11:233–238. doi: 10.1016/j.gep.2010.12.004. [DOI] [PubMed] [Google Scholar]
- Okamura Y, Dixon J. Voltage-sensing phosphatase: its molecular relationship with PTEN. Physiology. 2011;26:6–13. doi: 10.1152/physiol.00035.2010. [DOI] [PubMed] [Google Scholar]
- Okamura Y, Murata Y, Iwasaki H. Voltage-sensing phosphatase: actions and potentials. J Physiol. 2009;587:513–520. doi: 10.1113/jphysiol.2008.163097. [DOI] [PMC free article] [PubMed] [Google Scholar]
- Oliver D, Lien CC, Soom M, Baukrowitz T, Jonas P, Fakler B. Functional conversion between A-type and delayed rectifier K+ channel by membrane lipids. Science. 2004;304:265–270. doi: 10.1126/science.1094113. [DOI] [PubMed] [Google Scholar]
- Ruchira, Hink MA, Bosgraaf L, van Haastert PJ, Visser AJ. Pleckstrin homology domain diffusion in Dictyostelium cytoplasm studied using fluorescence correlation spectroscopy. J Biol Chem. 2004;279:10 013–10 019. doi: 10.1074/jbc.M310039200. [DOI] [PubMed] [Google Scholar]
- Stühmer W. Electrophysiological recording from Xenopus oocytes. Methods Enzymol. 1992;207:319–339. doi: 10.1016/0076-6879(92)07021-f. [DOI] [PubMed] [Google Scholar]
- Schaff JC, Slepchenko BM, Loew LM. Physiological modeling with virtual cell framework. Methods Enzymol. 2000;321:1–23. doi: 10.1016/s0076-6879(00)21184-1. [DOI] [PubMed] [Google Scholar]
- Tiwari S, Choi HP, Matsuzawa T, Pypaert M, MacMicking JD. Targeting of the GTPase Irgm1 to the phagosomal membrane via PtdIns(3,4)P2 and PtdIns(3,4,5)P3 promotes immunity to mycobacteria. Nat Immunol. 2009;10:907–917. doi: 10.1038/ni.1759. [DOI] [PMC free article] [PubMed] [Google Scholar]
- Villalba-Galea CA, Miceli F, Taglialatela M, Bezanilla F. Coupling between the voltage-sensing and phosphatase domains of Ci-VSP. J Gen Physiol. 2009;134:5–14. doi: 10.1085/jgp.200910215. [DOI] [PMC free article] [PubMed] [Google Scholar]
- Willars GB, Nahorski SR, Challiss RAJ. Differential regulation of muscarinic acetylcholine receptor-sensitive polyphosphoinositide pools and consequences for signaling in human neuroblastoma cells. J Biol Chem. 1998;273:5037–5046. doi: 10.1074/jbc.273.9.5037. [DOI] [PubMed] [Google Scholar]
- Xie LH, John SA, Ribalet B, Weiss JN. Phosphatidylinositol-4,5-bisphosphate (PIP2) regulation of strong inward rectifier Kir2.1 channels: multilevel positive cooperativity. J Physiol. 2008;586:1833–1848. doi: 10.1113/jphysiol.2007.147868. [DOI] [PMC free article] [PubMed] [Google Scholar]
- Xu C, Watras J, Loew LM. Kinetic analysis of receptor-activated phosphoinositide turnover. J Cell Biol. 2003;161:779–791. doi: 10.1083/jcb.200301070. [DOI] [PMC free article] [PubMed] [Google Scholar]
- Zhang L, Lee JK, John SA, Uozumi N, Kodama I. Mechanosensitivity of GIRK channels is mediated by protein kinase C-dependent channel-phosphatidylinositol 4,5-bisphosphate interaction. J Biol Chem. 2004;279:7037–7047. doi: 10.1074/jbc.M307323200. [DOI] [PubMed] [Google Scholar]
Associated Data
This section collects any data citations, data availability statements, or supplementary materials included in this article.