

Non-technical summary
An excess production of liver glucose is common in patients with diabetes, and animal studies show that female rats who consume a high-fat diet during pregnancy may give birth to offspring who are more likely to develop diabetes in adulthood. However, how this may be occurring remains poorly understood. The present study investigated the effect of a maternal high fat diet on fetal genes in the liver that control the production of glucose, and the potential regulatory mechanisms of these genes. We observed that pups of high fat-fed dams were heavier and had higher blood glucose at the time of delivery than pups of dams fed the control diet. While the high fat-fed dams themselves did not have increased blood glucose, their pups had higher expression of genes to make glucose in addition to elevated blood glucose. Our study demonstrates that exposure to a high fat diet during pregnancy programs the over-production of glucose in livers of offspring, which has the potential to lead to type II diabetes in childhood and adulthood.
Abstract
Abstract
In insulin resistance and type II diabetes, there is an elevation of hepatic gluconeogenesis, which contributes to hyperglycaemia. Studies in experimental animals have provided evidence that consumption of high fat (HF) diets by female rats programs the progeny for glucose intolerance in adulthood, but the mechanisms behind the in utero programming remain poorly understood. The present study analysed the effect of a maternal HF diet on fetal gluconeogenic gene expression and potential regulation mechanism related to histone modifications. Dams were fed either a Control (C, 16% kcal fat) or a high-fat (HF, 45% kcal fat) diet throughout gestation. Livers of the offspring were collected on gestational day 21 and analysed to determine the consequences of a maternal HF diet on molecular markers of fetal liver gluconeogenesis. We demonstrated that offspring of HF-fed dams were significantly heavier and had significantly higher blood glucose levels at the time of delivery than offspring of dams fed the C diet. While maternal gluconeogenesis and plasma glucose were not affected by the HF diet, offspring of HF-fed dams had significantly higher mRNA contents of gluconeogenic genes in addition to the elevated plasma glucose. In addition to increased transcription rate, a gestational HF diet resulted in modifications of the Pck1 histone code in livers of offspring. Our results demonstrate that in utero exposure to HF diet has the potential to program the gluconeogenic capacity of offspring through epigenetic modifications, which could potentially lead to excessive glucose production and altered insulin sensitivity in adulthood.
Introduction
The intake of high-fat, energy dense foods is on the rise in industrialized as well as developing nations (Zhai et al. 2009; Misra et al. 2010), which may have devastating effects on many populations. Because maternal nutrition programs both short- and long-term health outcomes in offspring, the increased intake of high fat (HF) may be especially detrimental during pregnancy. A maternal HF diet has adverse effects on fetal liver development in non-human primates (McCurdy et al. 2009), which has the potential to lead to altered glucose metabolism in adulthood. As the prevalence of diabetes increases (Zhang et al. 2010), determining the mechanisms behind its in utero development in response to maternal diet and physiology may become the key to its prevention.
Hepatic gluconeogenesis is a key contributor to the maintenance of plasma glucose homeostasis, and the phosphoenolpyruvate carboxykinase (PCK) enzyme regulates one of the rate-limiting steps of this process (Beale et al. 2007). The pivotal role of PCK in glucose control is undisputable. Overexpression of the gene Pck led to hyperglycaemia and type 2 diabetes (Valera et al. 1994) in mice, and silencing of the Pck1 (which encodes the cytosolic form of the PCK enzyme) gene in a mouse model of diabetes led to improved glucose control and alleviation of insulin resistance (Gomez-Valades et al. 2008). Transcriptional control of the Pck gene has been shown to occur primarily through the binding of various transcription factors within its promoter, and recent studies have shown that the location and deposition of these factors may depend on alterations of the chromatin itself, and specifically, on histone modification (Yang et al. 2009). These modifications are thought to have one of two functions, either unravelling the chromatin or recruiting additional proteins. Histone acetylation has most often been associated with the unravelling of the chromosome, therefore increasing the transcription of genes, whereas histone methylation may activate or inhibit transcription, depending on the target histone and residue (Kouzarides, 2007). The histone code produced by these epigenetic modifications in utero is likely to persist into adulthood to permanently control gene expression.
In utero histone modification in response to the maternal nutrient supply has been demonstrated in a number of studies. Gestational food restriction in rats was shown to affect Igf1 mRNA expression and the levels of dimethylation of histone H3 at lysine residue 4 (H3K4Me2) within its promoter (Tosh et al. 2010), and gestational protein restriction in mice resulted in a decrease in the mRNA expression of Igf2, with a concurrent decrease of H3K4Me3 and H4K20Me3, and increase of H3K9Me3 and H3K27Me3 (Sharif et al. 2007). In another study, gestational choline supplementation led to an increase in H3K9Me2 and H3K27Me2, while choline deficiency increased the levels of H3K4Me2 (Davison et al. 2009) in offspring of rat dams. The consequences of gestational HF diet on the histone code have not been thoroughly studied. A recent study in primates, Japanese macaques, showed that chronic consumption of a maternal high-fat diet led to an increase in fetal liver triglycerides and non-alcoholic fatty liver disease. In fetal hepatic tissue, there was an increase in H3K14Ac, and a trend of increase in H3K9Ac and H3K18Ac. There was also a trend of increase in H3K9Me2, H3K9Me3 and H3K27Me3 (Aagaard-Tillery et al. 2008). These results suggest that maternal HF diet alters fetal chromatin structure in primates via covalent histone modifications.
Exposure to a HF diet during fetal and neonatal life in mice can induce the type 2 diabetes phenotype that can be transmitted to the progeny (Gniuli et al. 2008). In order to identify the molecular basis of the fetal origins of diabetes by HF diet, the present study utilized an obesity resistant (OR) rat model without the concurrent development of gestational obesity or diabetes. This model isolated the effects of fat intake from those of maternal adiposity typically observed in animal models of diet-induced obesity. Our results demonstrate that in utero exposure to a HF diet affects expression of gluconeogenic genes through epigenetic modifications and has the potential to program the gluconeogenic capacity of offspring.
Methods
Animal and experimental design
Timed-pregnant female rats were obtained from Charles River Laboratories (Wilmington, MA, USA) on embryonic day 2. The obese resistant (OR) strain (Crl:OR(CD)) used in the current experiment was developed from an outbred line of Crl:CD(SD) rats. This model does not become obese when fed high-fat diets. Dams were separated into two dietary treatments: five in control (C; 64% CHO, 20% Pro, 16% fat), and five in high fat (HF; 35% CHO, 20% Pro, 45% fat) (Table 1). Pregnant animals were fed these diets ad libitum until embryonic day 20, when they were fasted overnight and killed by standard carbon dioxide inhalation before they underwent caesarean delivery to collect livers from dams and offspring. All fetal and maternal tissue samples were immediately stored in liquid nitrogen and kept for further analysis. Additionally, trunk blood from each dam was collected and immediately spun down to isolate serum and plasma. Blood for plasma isolation was collected into glass EDTA-coated Vacutainer tubes, and into glass Vacutainer tubes with no additives for serum samples (BD, Franklin Lakes, NJ, USA). Fetal weights, as well as maternal and fetal blood glucose were also recorded at this time. We certify that all applicable institutional and governmental regulations regarding the ethical use of animals were followed during this research (University of Illinois Institutional Animal Care and Use Committee approval no. 09112).
Table 1.
Diet composition
| Control (C) | High fat (HF) | |||
|---|---|---|---|---|
| % | Gram | kcal | Gram | kcal |
| Protein | 20 | 20 | 24 | 20 |
| Carbohydrate | 64 | 64 | 41 | 35 |
| Fat | 7 | 16 | 24 | 45 |
| Ingredients | ||||
| Casein | 200 | 800 | 200 | 800 |
| l-Cystine | 3 | 12 | 3 | 12 |
| Corn starch | 437 | 1749 | 72.8 | 291 |
| Maltodextrin | 100 | 400 | 100 | 400 |
| Sucrose | 102 | 408 | 172.8 | 691 |
| Cellulose | 50 | 0 | 50 | 0 |
| Soybean Oil | 25 | 225 | 25 | 225 |
| Saturated | 4 | 36 | 4 | 36 |
| Monounsaturated | 6 | 54 | 6 | 54 |
| Polyunsaturated | 15 | 135 | 15 | 135 |
| Lard | 47 | 423 | 177.5 | 1597.5 |
| Saturated | 19.7 | 177.7 | 74.55 | 670.95 |
| Monounsaturated | 21.2 | 190.4 | 79.88 | 718.875 |
| Polyunsaturated | 6.11 | 54.99 | 23.08 | 207.675 |
| Total saturated fat | 23.7 | 213.7 | 78.55 | 706.95 |
| Total Monounsaturated fat | 27.2 | 244.4 | 85.88 | 772.875 |
| Total polyunsaturated fat | 21.1 | 190 | 38.08 | 342.675 |
| Mineral mix | 10 | 0 | 10 | 0 |
| Dicalcium phosphate | 13 | 0 | 13 | 0 |
| Calcium carbonate | 5.5 | 0 | 5.5 | 0 |
| Potassium citrate | 16.5 | 0 | 16.5 | 0 |
| Vitamin mix | 10 | 40 | 10 | 0 |
| Choline bitartrate | 2 | 0 | 2 | 0 |
*Research Diets, Inc., New Brunswick, NJ, USA.
Plasma and serum analysis
Maternal and fetal plasma glucose concentrations were determined immediately after caesarean delivery from all animals using trunk blood via the Accu-Chek Advantage Glucometer and Comfort Curve Strips (Fisher Scientific, Houston, TX, USA). Accuracy and appropriateness of this protocol were previously confirmed by the Infinity Glucose Oxidase Reagent method (Thermo Fisher Scientific, Rockford, IL, USA). Maternal plasma leptin was analysed using the Rat Leptin ELISA Kit (Millipore cat. No. EZRL-83K, Billerica, MA, USA) according to the manufacturer's instructions. Maternal serum insulin and MCP-1 were analysed using the Milliplex MAP Rat Serum Adipokine Panel Kit from Millipore (cat. no. RADPK-81K) following the manufacturer's instructions and results were obtained using the Bio-Plex 200 System from Bio-Rad (Hercules, CA, USA).
RNA isolation, RT-PCR analysis, and transcription rate
Livers from 10 offspring (5 male and 5 female) from each dietary treatment group were randomly chosen for sampling, with all litters being represented in the analysis. Additionally, livers from all dams were dissected following the caesarean delivery and the right lobe was used for analysis. Total RNA was isolated using the GenElute Mammalian Total RNA Miniprep Kit (Sigma-Aldrich, St Louis, MO, USA), treated with DNase I to eliminate any DNA contamination and quantified using a Nano Drop ND-1000 Spectophotometer while assuring that the ratio of 260/280 was >1.9. cDNA was synthesized from a total of 2 μg of RNA in a 20 μl reaction volume using the High Capacity cDNA Reverse Transcription Kit using random primers (Applied Biosystems, Foster City, CA, USA) and a thermal cycler (Applied Biosystems 2700), with the following programme: 25°C for 10 min, 37°C for 120 min, 85°C for 5 s, and a 4°C hold. Real-time PCR was performed using 25 ng cDNA as the template, SYBR Green PCR Master Mix (Applied Biosystems), and 5 μmol l−1 of each forward and reverse primer (Table 2) in the 7300 Real-Time PCR System (Applied Biosystems), with the following programme: 95°C for 10 min, 95°C for 15 s, 60°C for 1 min, 95°C for 15 s, 55°C for 1 min, 95°C for 15 s, with 40 cycles of steps 2 and 3. A serial dilution was used to create a standard curve for quantification and a dissociation curve was analysed following each reaction, and a no-template control was included with all reactions to assure that no additional products were synthesized during the PCR reaction.
Table 2.
Primer information
| Gene | Forward sequence and location | Reverse sequence and location | Transcript ID |
|---|---|---|---|
| Pck1 | ENSRNOT00000031586 | ||
| Coding mRNA | AGGAGGAAGAAAGGTGGCACCAG (+90) | GGCAGAGAAGTCCAGACCATTATGC (+182) | |
| Pre-mRNA | GGAGGGTGTCATCCGCAAGC (+501) | CCAGAGACTTTGGGCTGAAGGG (+567) | |
| Coding ChIP | CGAACGCCATTAAGACCATCCAG (+1177) | CCAGTAAACACCCCCATCACTTGTC (+1253) | |
| Promoter ChIP | TGTTAGGTCAGTTCCAAACCGTGC (–148F) | TGGACCTGGAGGCTCGCC (–65R) | |
| Negative ChIP | CTCTGTCTGTGTCCACCAAC (-4996) | AAGTCCCTACCTCCCGAA (-4889) | |
| G6Pase | NM_013098 | ||
| Cebpα | AGTCGGTGGATAAGAACAGCAACG (+821) | GCTGTTTGGCTTTATCTCGGCTC (+910) | ENSRNOT00000014517 |
| Cebpβ | AGAACGAGCGGCTGCAGAAGA (+1220) | GAACAAGTTCCGCAGCGTGC (+1287) | ENSRNOT00000030773 |
| Srebp-1a | GCTTCTCTGGGCTCCTCTCTGG (+522) | CAGTGGGTGCCGATGGTGG (+616) | ENSRNOT0000004705 |
| Pgc1a | TGGCGTCATTCAGGAGCTGG (+15F) | CAACCAGGGCAGCACACTCTATG (+98) | ENSRNOT00000006071 |
| L7a (mRNA and ChIP) | GAGGCCAAAAAGGTGGTCAATCC (+64) | CCTGCCCAATGCCGAAGTTCT (+127) | ENSRNOT00000006754 |
To determine the transcription rate of the Pck1 gene, total RNA was treated with DNase I to eliminate any DNA contamination. Transcription rate of the Pck1 gene was determined by designing primers that cover both an exon and intron of the gene to measure unspliced pre-mRNA. This procedure has been reported to be a valid technique for analysing transcription rate (Chen et al. 2004), and was adapted from a method originally described by Lipson & Baserga(1989), except that pre-mRNA amounts were quantified by real time PCR.
ChIP analysis
ChIP analysis was performed using a modified protocol (Chen et al. 2004). Livers from 10 offspring (5 male and 5 female) from each dietary treatment group were randomly chosen for sampling, and were the same samples as those used for mRNA analysis. Briefly, 200 mg of frozen liver samples were ground using a mortar and pestle with liquid nitrogen and washed with phosphate-buffered saline (PBS). The samples were resuspended in PBS and cross-linked in 1% formaldehyde for 10 min at room temperature. After centrifugation, the pellet was resuspend in nuclei swelling buffer containing protease inhibitor and phosphorylation inhibitor. The nuclei were lysed in SDS lysis buffer containing protease inhibitor and phosphorylation inhibitor. The chromatin was sonicated (Fisher Scientific model 100 Sonic Dismembrator, Pittsburgh, PA, USA) on ice with six bursts for 40 s at power setting 5 with 2 min cooling intervals between each burst. After removal of the cell debris by centrifugation at 16,200×g in 4°C for 10 min, sheared chromatin was diluted to 10 ml in ChIP Dilution Buffer to perform 10 immunoprecipitations (IPs). One millilitre of the diluted lysate was incubated overnight on a haematology mixer (Model 346, Fisher Scientific) with 2 μg of each primary antibody at 4°C (Table 3). Sixty millilitres of pre-blocked salmon sperm DNA/protein G agarose beads (60 μl, 50% slurry; Upstate Biotechnology, Lake Placid, NY, USA) were then added to the chromatin samples, followed by 2 h of incubation at 4°C. The mixture was then centrifuged at 400×g for 1 min at 4°C. Supernatant of normal rabbit IgG was saved as input control. Pellets containing the immunoprecipitated complexes were washed sequentially with 1 ml of low salt solution, high salt solution, and LiCl solution, and twice with TE (pH 8.0). Antibody/protein/DNA complexes were eluted from Protein G beads by adding twice 250 μl of elution buffer followed by shaking at 37°C for 15 min at 10×g and flash spinning at room temperature. The combined supernatants were incubated at 65°C for 5 h with 20 μl 5 mol l−1 NaCl and 1 μg of RNase A (Qiagen, Hilden, Germany) to reverse the formaldehyde cross-linking and release the DNA fragments. Samples were then treated with proteinase K (Sigma) at 37°C for 1 h to remove any protein. DNA was purified with a DNA miniprep system (Qiagen). Five microlitres of immunoprecipitated DNA was used for the real-time PCR reaction.
Table 3.
ChIP Antibody Information
| Antibody | Species | Source | Catalogue no. |
|---|---|---|---|
| IgG | Rabbit | Santa Cruz | sc-2027 |
| H3Ac | Rabbit | Millipore | 06–599 |
| H4Ac | Rabbit | Upstate | 06–866 |
| H3K4Me2 | Rabbit | Millipore | 07–030 |
| H3K9Me3 | Rabbit | Upstate | 07–442 |
| H3K27Me3 | Rabbit | Upstate | 07–449 |
Statistical analysis
Results are reported as means ± SEM. n = 5 for maternal food intake, weight gain, mRNA and plasma analyses. Fetal weight and blood glucose analysis was performed by taking the average of weights by litter, with a resulting n = 5. For fetal mRNA and ChIP analysis, n = 10. Maternal weight gain and food intake were analysed using the repeated measures ANOVA with diet as the main factor. For all remaining data, the main effect of diet was determined using one-way ANOVA (SAS software, SAS Institute Inc., Cary, NC, USA).
Results
Maternal gestational characteristics
Gestational food intake did not differ between animals on the C and HF diets (Fig. 1A). There was also no difference in maternal body weight between the C and HF groups throughout gestation (Fig. 1B). Dams fed the HF diet gained significantly more weight when compared to the C group (P < 0.05, Fig. 1C), measured by subtracting body weight on day 2 of gestation from body weight on day 21 of gestation, possibly because offspring of these dams were also heavier. However, when fetal and placental weights were subtracted from this weight to determine actual mass gained during gestation, the two groups did not have a significantly different gestational body mass gain (Fig. 1D).
Figure 1. Food intake (A), growth curve (B), total gestational weight gain (C), and gestational body mass gain (D) of dams fed the Control and HF diet during gestation.
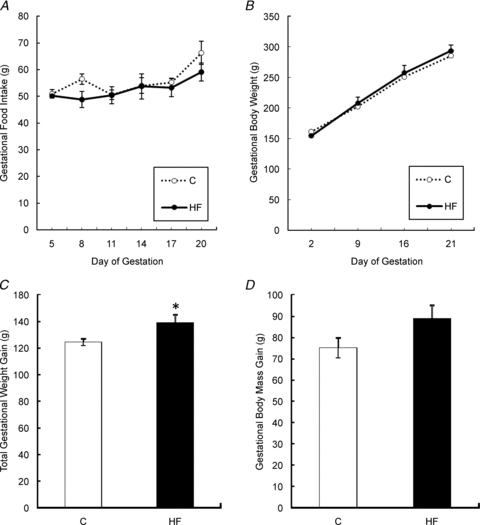
Values are means ± SEM, *Different from C, P < 0.05.
At the time of cesarean delivery on gestational day 21, maternal blood glucose was not different between the C and HF groups (Table 4). There was also no difference in levels of insulin (Table 4), leptin (Table 4), or MCP-1 (Table 4) between animals fed the two diets. The mRNA amount of liver Pck1 and G6Pase was not different in dams fed the HF diet when compared to those fed the C diet (Table 4).
Table 4.
Maternal characteristics
| Diet | P value | ||
|---|---|---|---|
| Variable | C | HF | P value |
| Maternal metabolic measures | |||
| Glucose (mg dl−1) | 53.4 ± 3.66 | 59.25 ± 2.78 | NS |
| Leptin (ng ml−1) | 0.91 ± 0.11 | 0.85 ± 0.26 | NS |
| Insulin (pg ml−1) | 689.15 ± 100.4 | 550.38 ± 66.19 | NS |
| MCP-1 (pg ml−1) | 451.17 ± 29.13 | 423.82 ± 9.76 | NS |
| Maternal gluconeogenic mRNA Content normalized to L7a | |||
| Pck1 | 0.922 ± 0.090 | 1.05 ± 0.15 | NS |
| G6Pase | 1.35 ± 0.32 | 0.89 ± 0.32 | NS |
Offspring observations
There were no differences in litter size between the two dietary groups (data not shown), and at the time of caesarean delivery on gestational day 21, offspring of dams fed the HF diet were significantly heavier when compared to offspring of dams that were fed the C diet during gestation (P < 0.05, Fig. 2A). Offspring of HF-fed dams also had significantly higher blood glucose levels when compared to offspring of dams fed the C diet (P < 0.05, Fig. 2B).
Figure 2. Delivery weights (A) and blood glucose (B) of offspring of dams fed the Control and HF diet during gestation.
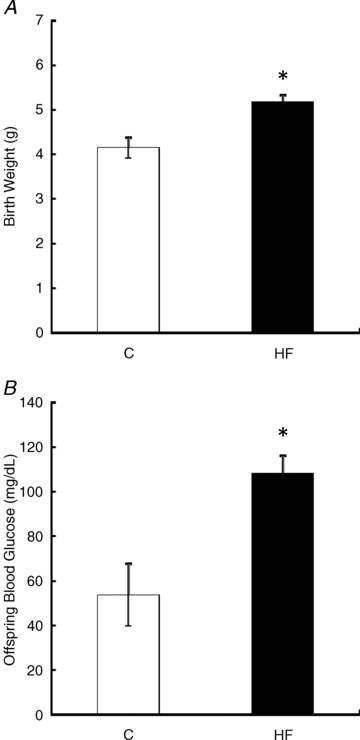
Values are means ± SEM, n = 5 litters. *Different from C, P < 0.05.
Offspring liver mRNA contents related to gluconeogenesis
The mRNA expression (P < 0.05, Fig. 3A) as well as transcription rate (P < 0.01, Fig. 3B) of Pck1 was significantly higher in livers of offspring born to dams that were fed the HF diet when compared to offspring of dams fed the C diet. Additionally, G6Pase (P < 0.05), Cebpα (P < 0.01), Srebp1a (P < 0.01), and Pgc1a (P < 0.05) mRNA content was significantly higher in offspring of HF-fed dams when compared to offspring of dams fed the C diet (Fig. 3C). There was no significant difference in the expression of Cebpβ between the two offspring groups (Fig. 3C).
Figure 3. Hepatic Pck1 and L7a mRNA levels (A), Pck1 transcription rate (B) and gluconeogenic pathway mRNA levels (C) in offspring of dams fed the Control or HF diet during gestation.
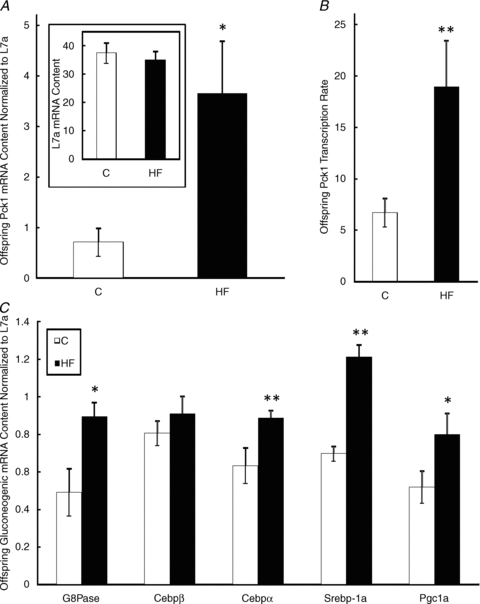
Values are means ± SEM, n = 10. *Different from C, P < 0.05, **Different from C, P < 0.01.
Histone modifications on Pck gene in offspring liver
ChIP analysis of the hepatic Pck1 gene (Fig. 4A) demonstrated that a maternal HF diet led to a decrease in the association of H3Ac (P < 0.05), H3K4Me2 (P < 0.05), H3K9Me3 (P < 0.05) and H3K27Me3 (P < 0.05) when compared to C offspring (Fig. 4B). There was no significant difference in the association of promoter H4Ac between the two offspring groups (Fig. 4B). Analysis of the Pck1 coding region showed that maternal HF diet led to a trend in decrease in the association of H3Ac (P = 0.088), a decrease in H3K9Me3 (P < 0.05), and an increase in H4Ac (P < 0.001) and H3K4Me2 (P < 0.001) when compared to C offspring (Fig. 4C). There was no significant difference in the association of H3K27Me3 within the coding region between the two offspring groups (Fig. 4C). A region approximately 5 kb upstream of Pck1 was also analysed, and a maternal HF diet resulted in a significant increase of H4Ac (P < 0.001) and H3K4Me2 (P < 0.001) (Fig. 4D). Because L7a was used as a housekeeping gene for mRNA normalization, we also performed ChIP promoter analysis of this gene, and observed a decrease in H3K9Me3 (P < 0.05) by maternal HF diet, but no other modifications (Fig. 4E). There was also no effect by maternal diet in the association of hepatic IgG binding within any of the regions tested, which was used as a negative control (Fig. 4).
Figure 4. Pck1 gene structure (A), with triangles that face each other indicating the forward and reverse primers utilized in the current experiment.
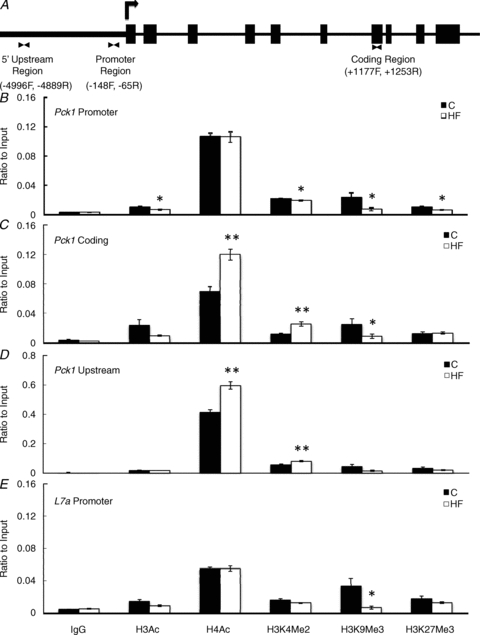
Histone modifications within the promoter region (B), coding region (C) and upstream region (D) of the hepatic Pck1 gene, as well as the L7a promoter region (E) in offspring of dams fed the Control or HF diet during gestation. Values are means ± SEM, n = 10. *Different from C, P < 0.05, **Different from C, P < 0.001.
Discussion
The current study is the first to demonstrate that a HF diet isolated to the gestational period, independent of maternal obesity and diabetes development, leads to the elevated amount of mRNA of several genes associated with the hepatic gluconeogenic pathway in liver of fetal offspring, corresponding to elevated glucose levels in offspring at the time of delivery. We also demonstrated that feeding the HF diet during gestation programs Pck1 expression with histone modifications in offspring liver.
We utilized an obesity resistant (OR) rat model to separate the effects of gestational diet and weight, which is challenging to accomplish in traditional models of diet-induced obesity. A recent review of animal models of gestational high-fat feeding (Ainge et al. 2010) concluded that despite it being difficult to draw concrete conclusions from all of the reviewed studies, there appears to be a definitive risk of diabetes development in offspring of HF-fed dams, independent of maternal obesity. By utilizing an animal model in which dams were not sensitive to the obesigenic effects of HF intake, we intended to confirm that HF feeding alone would negatively impact fetal development. In the current study, offspring of HF-fed dams were significantly heavier at the time of delivery, and had significantly higher blood glucose levels when compared to offspring of C-fed dams, which we suggest is a result of their enhanced gluconeogenic capacity in response to the gestational HF diet. Our analysis of maternal gluconeogenic genes showed that maternal hepatic glucose handling did not appear to be affected by the composition of our diets. We also did not observe changes in maternal blood glucose in the HF-fed dams when compared to C animals. This leads us to conclude that the increase in fetal glucose we observed occurred as a result of fetal glucose production, and not because of increased glucose availability from the mother. Because the fetus has a continuous in utero supply of energy from the mother, hepatic gluconeogenesis does not occur at a considerable rate until immediately after birth, when the flow of glucose from the mother is eliminated (Ballard & Hanson, 1967). The premature activation of the pathway in association with an energy-rich postnatal environment may explain the mechanism behind fetal programming of insulin resistance or diabetes. As has been suggested (Weir et al. 2001), it is not the overproduction of glucose per se that may lead to diabetes development, but the chronic burden (and eventual dysfunction) on the pancreas to produce sufficient insulin to handle the excess glucose.
The upregulation of fetal Pck1 and diabetes programming has been reported in a variety of studies of gestational nutrient restriction or intrauterine growth restriction (Greenwood et al. 2002; Thorn et al. 2009; Nijland et al. 2010), and reviewed in Desai & Hales(1997) and Ozanne & Hales(1999), suggesting that maternal malnutrition or stress may program an upregulation in hepatic gluconeogenesis to insure adequate fetal glucose availability in utero and after birth. However, fewer studies are available to assess the effect of maternal HF feeding on fetal gluconeogenesis. A recent study in non-human primates demonstrated that a gestational HF diet independent of obesity led to increased expression of gluconeogenic genes in the offspring (McCurdy et al. 2009). However, the mothers in this study were fed the HF diet chronically for 2–4 years before becoming pregnant. Our study showed that a similar consequence for fetal gluconeogenesis is possible after only gestational exposure to HF feeding. Additionally, human studies have demonstrated that macrosomic, and not only growth-restricted, offspring are at risk for the development of diabetes, as are those whose mothers may be overweight or overnourished (Hoegsberg et al. 1993; Pinar et al. 2000; Jain et al. 2007; Guerrero-Romero et al. 2010). The developing world is beginning to be exposed to the typical ‘Western’ diet, and so the deleterious effects of these new dietary practices should also be considered as important factors for the potential in utero programming of diabetes.
Our ChIP analysis of the Pck1 gene suggests that gestational HF feeding leads to certain histone modifications that have previously been associated with transcriptional activation. Although we did not observe an increase in the acetylation of histone H4 within the Pck1 promoter, it was increased within the coding region as well as an upstream region of the gene. This suggests that these regions may be of more consequence for activating the gene in response to maternal HF diet, which is consistent with a report that there may be more acetylation events occurring within the coding region of the genome than within the promoter (Roh et al. 2004). We showed that the acetylation of histone H3 was significantly decreased within the promoter and had a trend of decrease within the coding region of the Pck1 gene. Although histone H3 is associated with actively transcribed genes, studies have shown that H3 and H4 acetylation may have different functions, and thus may not contribute equally to transcriptional events, or else the acetylation of one may compensate for the change in the acetylation of the other (Kristjuhan et al. 2002; Roh et al. 2004). Methylation of histone H3 at lysine residues 9 and 27 leads to an inhibition of gene transcription (Lindroth et al. 2004; Alvarez-Venegas & Avramova, 2005), and our study indicates that gestational HF diet produces a histone code in offspring that favours the activation of the Pck1 gene by decreasing these inhibitors. However, since H3K9Me2 was also decreased in the promoter of L7a, it is possible that in the current experiment, a decrease in H3K9Me2 in response to gestational HF diet corresponds to all actively transcribed genes. We show that the methylation of H3 at Lys residue 4 was increased in the coding and upstream regions, but not the promoter region, of the transcriptionally active Pck1 gene in response to gestational HF diet. This observation is consistent with reports that H3K4Me2 within the coding region, but not the promoter, may correlate to transcription (Bernstein et al. 2002; Schneider et al. 2004), and may indicate an increase in gene elongation (Liang et al. 2004).
In conclusion, our data demonstrate that exposure to a maternal high fat diet during pregnancy, in the absence of diabetes and obesity, may also have adverse consequences for the offspring. Histone modification is likely to be in part responsible for the increased rate and level of transcription of the fetal gluconeogenic Pck1 gene, and that this histone ‘code’ in response to a gestational high fat diet may present a potential mechanism for the in utero programming of gluconeogenesis. If this pattern of expression proceeds into adulthood, the increase in hepatic glucose production will inevitably lead to altered glucose handling, with increased potential for the development of type 2 diabetes.
Acknowledgments
This project was supported by the USDA Cooperative State Research, Education and Extension Service, Hatch project no. ILLU-698-374.
Glossary
Abbreviations
- AcH3
acetylated histone H3
- AcH4
acetylated histone H4
- Cebp
CCAAT-enhancer-binding protein
- G6Pase
glucose-6-phosphotase
- H3K4Me2
dimethylation of histone H3 at lysine residue 4
- H3K9Me3, or H3K27Me3
trimethylation of histone H3 at lysine residue 9 or 27
- HF
high-fat
- OR
obesity resistant
- PCK
phosphoenolpyruvate carboxykinase
- PGC1α
peroxisome proliferator activated receptor γ coactivator 1α
- SREBP
sterol regulatory element binding protein
Author contributions
The experiments were performed in the laboratory of Y.-X.P. at University of Illinois at Urbana-Champaign. Y.-X.P. and R.S. were responsible for conception and design of the experiments. R.S., D.Z. and X.Z. conducted the experiments and collected data. R.S. analysed the data, performed statistical analysis, and drafted the manuscript. Y.-X.P. and R.S. have primary responsibility for the final content. All authors read and approved the final manuscript.
References
- Aagaard-Tillery KM, Grove K, Bishop J, Ke X, Fu Q, McKnight R, Lane RH. Developmental origins of disease and determinants of chromatin structure: maternal diet modifies the primate fetal epigenome. J Mol Endocrinol. 2008;41:91–102. doi: 10.1677/JME-08-0025. [DOI] [PMC free article] [PubMed] [Google Scholar]
- Ainge H, Thompson C, Ozanne SE, Rooney KB. A systematic review on animal models of maternal high fat feeding and offspring glycaemic control. Int J Obes (Lond) 2010;35:325–335. doi: 10.1038/ijo.2010.149. [DOI] [PubMed] [Google Scholar]
- Alvarez-Venegas R, Avramova Z. Methylation patterns of histone H3 Lys 4, Lys 9 and Lys 27 in transcriptionally active and inactive Arabidopsis genes and in atx1 mutants. Nucleic Acids Res. 2005;33:5199–5207. doi: 10.1093/nar/gki830. [DOI] [PMC free article] [PubMed] [Google Scholar]
- Ballard FJ, Hanson RW. Phosphoenolpyruvate carboxykinase and pyruvate carboxylase in developing rat liver. Biochem J. 1967;104:866–871. doi: 10.1042/bj1040866. [DOI] [PMC free article] [PubMed] [Google Scholar]
- Beale EG, Harvey BJ, Forest C. PCK1 and PCK2 as candidate diabetes and obesity genes. Cell Biochem Biophys. 2007;48:89–95. doi: 10.1007/s12013-007-0025-6. [DOI] [PubMed] [Google Scholar]
- Bernstein BE, Humphrey EL, Erlich RL, Schneider R, Bouman P, Liu JS, Kouzarides T, Schreiber SL. Methylation of histone H3 Lys 4 in coding regions of active genes. Proc Natl Acad Sci U S A. 2002;99:8695–8700. doi: 10.1073/pnas.082249499. [DOI] [PMC free article] [PubMed] [Google Scholar]
- Chen H, Pan YX, Dudenhausen EE, Kilberg MS. Amino acid deprivation induces the transcription rate of the human asparagine synthetase gene through a timed program of expression and promoter binding of nutrient-responsive basic region/leucine zipper transcription factors as well as localized histone acetylation. J Biol Chem. 2004;279:50829–50839. doi: 10.1074/jbc.M409173200. [DOI] [PubMed] [Google Scholar]
- Davison JM, Mellott TJ, Kovacheva VP, Blusztajn JK. Gestational choline supply regulates methylation of histone H3, expression of histone methyltransferases G9a (Kmt1c) and Suv39h1 (Kmt1a), and DNA methylation of their genes in rat fetal liver and brain. J Biol Chem. 2009;284:1982–1989. doi: 10.1074/jbc.M807651200. [DOI] [PMC free article] [PubMed] [Google Scholar]
- Desai M, Hales CN. Role of fetal and infant growth in programming metabolism in later life. Biol Rev Camb Philos Soc. 1997;72:329–348. doi: 10.1017/s0006323196005026. [DOI] [PubMed] [Google Scholar]
- Gniuli D, Calcagno A, Caristo ME, Mancuso A, Macchi V, Mingrone G, Vettor R. Effects of high-fat diet exposure during fetal life on type 2 diabetes development in the progeny. J Lipid Res. 2008;49:1936–1945. doi: 10.1194/jlr.M800033-JLR200. [DOI] [PubMed] [Google Scholar]
- Gomez-Valades AG, Mendez-Lucas A, Vidal-Alabro A, Blasco FX, Chillon M, Bartrons R, Bermudez J, Perales JC. Pck1 gene silencing in the liver improves glycemia control, insulin sensitivity, and dyslipidemia in db/db mice. Diabetes. 2008;57:2199–2210. doi: 10.2337/db07-1087. [DOI] [PMC free article] [PubMed] [Google Scholar]
- Greenwood PL, Hunt AS, Slepetis RM, Finnerty KD, Alston C, Beermann DH, Bell AW. Effects of birth weight and postnatal nutrition on neonatal sheep: III. Regulation of energy metabolism. J Anim Sci. 2002;80:2850–2861. doi: 10.2527/2002.80112850x. [DOI] [PubMed] [Google Scholar]
- Guerrero-Romero F, Aradillas-Garcia C, Simental-Mendia LE, Monreal-Escalante E, de la Cruz Mendoza E, Rodriguez-Moran M. Birth weight, family history of diabetes, and metabolic syndrome in children and adolescents. J Pediatr. 2010;156:719–723. 723.e1. doi: 10.1016/j.jpeds.2009.11.043. [DOI] [PubMed] [Google Scholar]
- Hoegsberg B, Gruppuso PA, Coustan DR. Hyperinsulinemia in macrosomic infants of nondiabetic mothers. Diabetes Care. 1993;16:32–36. doi: 10.2337/diacare.16.1.32. [DOI] [PubMed] [Google Scholar]
- Jain NJ, Denk CE, Kruse LK, Dandolu V. Maternal obesity: can pregnancy weight gain modify risk of selected adverse pregnancy outcomes? Am J Perinatol. 2007;24:291–298. doi: 10.1055/s-2007-981432. [DOI] [PubMed] [Google Scholar]
- Kouzarides T. Chromatin modifications and their function. Cell. 2007;128:693–705. doi: 10.1016/j.cell.2007.02.005. [DOI] [PubMed] [Google Scholar]
- Kristjuhan A, Walker J, Suka N, Grunstein M, Roberts D, Cairns BR, Svejstrup JQ. Transcriptional inhibition of genes with severe histone h3 hypoacetylation in the coding region. Mol Cell. 2002;10:925–933. doi: 10.1016/s1097-2765(02)00647-0. [DOI] [PMC free article] [PubMed] [Google Scholar]
- Liang G, Lin JC, Wei V, Yoo C, Cheng JC, Nguyen CT, Weisenberger DJ, Egger G, Takai D, Gonzales FA, Jones PA. Distinct localization of histone H3 acetylation and H3-K4 methylation to the transcription start sites in the human genome. Proc Natl Acad Sci U S A. 2004;101:7357–7362. doi: 10.1073/pnas.0401866101. [DOI] [PMC free article] [PubMed] [Google Scholar]
- Lindroth AM, Shultis D, Jasencakova Z, Fuchs J, Johnson L, Schubert D, Patnaik D, Pradhan S, Goodrich J, Schubert I, Jenuwein T, Khorasanizadeh S, Jacobsen SE. Dual histone H3 methylation marks at lysines 9 and 27 required for interaction with CHROMOMETHYLASE3. EMBO J. 2004;23:4286–4296. doi: 10.1038/sj.emboj.7600430. [DOI] [PMC free article] [PubMed] [Google Scholar]
- Lipson KE, Baserga R. Transcriptional activity of the human thymidine kinase gene determined by a method using the polymerase chain reaction and an intron-specific probe. Proc Natl Acad Sci U S A. 1989;86:9774–9777. doi: 10.1073/pnas.86.24.9774. [DOI] [PMC free article] [PubMed] [Google Scholar]
- McCurdy CE, Bishop JM, Williams SM, Grayson BE, Smith MS, Friedman JE, Grove KL. Maternal high-fat diet triggers lipotoxicity in the fetal livers of nonhuman primates. J Clin Invest. 2009;119:323–335. doi: 10.1172/JCI32661. [DOI] [PMC free article] [PubMed] [Google Scholar]
- Misra A, Singhal N, Khurana L. Obesity, the metabolic syndrome, and type 2 diabetes in developing countries: role of dietary fats and oils. J Am Coll Nutr. 2010;29:289S–301S. doi: 10.1080/07315724.2010.10719844. [DOI] [PubMed] [Google Scholar]
- Nijland MJ, Mitsuya K, Li C, Ford S, McDonald TJ, Nathanielsz PW, Cox LA. Epigenetic modification of fetal baboon hepatic phosphoenolpyruvate carboxykinase following exposure to moderately reduced nutrient availability. J Physiol. 2010;588:1349–1359. doi: 10.1113/jphysiol.2009.184168. [DOI] [PMC free article] [PubMed] [Google Scholar]
- Ozanne SE, Hales CN. The long-term consequences of intra-uterine protein malnutrition for glucose metabolism. Proc Nutr Soc. 1999;58:615–619. doi: 10.1017/s0029665199000804. [DOI] [PubMed] [Google Scholar]
- Pinar H, Pinar T, Singer DB. Beta-cell hyperplasia in macrosomic infants and fetuses of nondiabetic mothers. Pediatr Dev Pathol. 2000;3:48–52. doi: 10.1007/s100240050006. [DOI] [PubMed] [Google Scholar]
- Roh TY, Ngau WC, Cui K, Landsman D, Zhao K. High-resolution genome-wide mapping of histone modifications. Nat Biotechnol. 2004;22:1013–1016. doi: 10.1038/nbt990. [DOI] [PubMed] [Google Scholar]
- Schneider R, Bannister AJ, Myers FA, Thorne AW, Crane-Robinson C, Kouzarides T. Histone H3 lysine 4 methylation patterns in higher eukaryotic genes. Nat Cell Biol. 2004;6:73–77. doi: 10.1038/ncb1076. [DOI] [PubMed] [Google Scholar]
- Sharif J, Nakamura M, Ito T, Kimura Y, Nagamune T, Mitsuya K, Okamura K. Food restriction in pregnant mice can induce changes in histone modifications and suppress gene expression in fetus. Nucleic Acids Symp Ser (Oxf) 2007:125–126. doi: 10.1093/nass/nrm063. [DOI] [PubMed] [Google Scholar]
- Thorn SR, Regnault TR, Brown LD, Rozance PJ, Keng J, Roper M, Wilkening RB, Hay WW, Jr, Friedman JE. Intrauterine growth restriction increases fetal hepatic gluconeogenic capacity and reduces messenger ribonucleic acid translation initiation and nutrient sensing in fetal liver and skeletal muscle. Endocrinology. 2009;150:3021–3030. doi: 10.1210/en.2008-1789. [DOI] [PMC free article] [PubMed] [Google Scholar]
- Tosh DN, Fu Q, Callaway CW, McKnight RA, McMillen IC, Ross MG, Lane RH, Desai M. Epigenetics of programmed obesity: Alteration in IUGR rat hepatic IGF1 mRNA expression and histone structure in rapid versus delayed postnatal catch-up growth. Am J Physiol Gastrointest Liver Physiol. 2010;299:G1023–1029. doi: 10.1152/ajpgi.00052.2010. [DOI] [PMC free article] [PubMed] [Google Scholar]
- Valera A, Pujol A, Pelegrin M, Bosch F. Transgenic mice overexpressing phosphoenolpyruvate carboxykinase develop non-insulin-dependent diabetes mellitus. Proc Natl Acad Sci U S A. 1994;91:9151–9154. doi: 10.1073/pnas.91.19.9151. [DOI] [PMC free article] [PubMed] [Google Scholar]
- Weir GC, Laybutt DR, Kaneto H, Bonner-Weir S, Sharma A. Beta-cell adaptation and decompensation during the progression of diabetes. Diabetes. 2001;50(Suppl 1):S154–159. doi: 10.2337/diabetes.50.2007.s154. [DOI] [PubMed] [Google Scholar]
- Yang J, Reshef L, Cassuto H, Aleman G, Hanson RW. Aspects of the control of phosphoenolpyruvate carboxykinase gene transcription. J Biol Chem. 2009;284:27 031–27 035. doi: 10.1074/jbc.R109.040535. [DOI] [PMC free article] [PubMed] [Google Scholar]
- Zhai F, Wang H, Du S, He Y, Wang Z, Ge K, Popkin BM. Prospective study on nutrition transition in China. Nutr Rev. 2009;67(Suppl 1):S56–61. doi: 10.1111/j.1753-4887.2009.00160.x. [DOI] [PubMed] [Google Scholar]
- Zhang X, Saaddine JB, Chou CF, Cotch MF, Cheng YJ, Geiss LS, Gregg EW, Albright AL, Klein BE, Klein R. Prevalence of diabetic retinopathy in the United States, 2005–2008. JAMA. 2010;304:649–656. doi: 10.1001/jama.2010.1111. [DOI] [PMC free article] [PubMed] [Google Scholar]