

Non-technical summary
Colour gets a free ride, according to our study of visual nerve cell responses in marmoset monkeys. All male marmosets are red–green colour-blind (dichromatic), but most female marmosets have normal trichromatic colour vision. It is known that signals for high-acuity daytime vision are carried in the parvocellular (P) pathway, and the P pathway also carries signals for red–green colour vision in trichromats. Here we compared P cell responses with patterned stimuli in dichromatic and trichromatic marmosets, and found no detectable difference in resolving power for fine patterns. These results indicate that red–green colour vision does not come at a cost for spatial vision. The ‘piggyback ride’ for colour signals in the P pathway may have encouraged the evolution of full colour vision in primates, including great apes, monkeys and humans.
Abstract
Abstract
The red–green axis of colour vision evolved recently in primate evolutionary history. Signals serving red–green colour vision travel together with signals serving spatial vision, in the parvocellular (PC) division of the subcortical visual pathway. However, the question of whether receptive fields of PC pathway cells are specialized to transmit red–green colour signals remains unresolved. We addressed this question in single-cell recordings from the lateral geniculate nucleus of anaesthetized marmosets. Marmosets show a high proportion of dichromatic (red–green colour-blind) individuals, allowing spatial and colour tuning properties of PC cells to be directly compared in dichromatic and trichromatic visual systems. We measured spatial frequency tuning for sine gratings that provided selective stimulation of individual photoreceptor types. We found that in trichromatic marmosets, the foveal visual field representation is dominated by red–green colour-selective PC cells. Colour selectivity of PC cells is reduced at greater eccentricities, but cone inputs to centre and surround are biased to create more selectivity than predicted by a purely ‘random wiring’ model. Thus, one-to-one connections in the fovea are sufficient, but not necessary, to create colour-selective responses. The distribution of spatial tuning properties for achromatic stimuli shows almost complete overlap between PC cells recorded in dichromatic and trichromatic marmosets. These data indicate that transmission of red–green colour signals has been enabled by centre–surround receptive fields of PC cells, and has not altered the capacity of PC cells to serve high-acuity vision at high stimulus contrast.
Introduction
Most humans, and many species of apes and monkeys, show trichromatic colour vision based on three cone photoreceptor classes sensitive to long (L), medium (M) or short (S) wavelengths of light. The L and M photoreceptors diverged recently in evolutionary history, thereby adding a red–green colour axis to the simple dichromatic or ‘blue–green’ colour vision exhibited by most diurnal mammals (reviewed by Nathans, 1999 and Jacobs, 2008). According to the ‘random wiring’ hypothesis, red–green colour vision is enabled by high-acuity nerve pathways in the central (foveal) region of the retina, where cones show one-to-one connectivity with cells in the midget-parvocellular (PC) pathway (Mollon et al. 1984; Shapley & Perry, 1986; Lennie et al. 1991). Dominant input to the receptive field centre of a foveal PC cell arises in a single L or M cone. Input to the receptive field surround arises via retinal interneurones (horizontal and amacrine cells), which receive mixed spectral input from M and L cones. Thus, there is imbalance in spectral inputs to centre and surround, allowing opponent colour signals to be transmitted to the brain without evolution of new colour-selective pathways. Consistent with this hypothesis, there is broad agreement that the majority of PC pathway cells show centre–surround organization, and that red–green opponency can arise from centre–surround interaction (Dreher et al. 1976; Derrington et al. 1984; Kaplan & Shapley, 1986; Smith et al. 1992; Lankheet et al. 1998; Kilavik et al. 2003; Blessing et al. 2004; Diller et al. 2004; Solomon et al. 2005; Buzás et al. 2006; Crook et al. 2011). By contrast, according to the original ‘two channel’ model for chromatic signal transmission, chromatic signals are carried by specific populations of cells showing (‘type II’) opposing spectral inputs to large and overlapping receptive field regions (Wiesel & Hubel, 1966; Dreher et al. 1976; Rodieck, 1991; Calkins & Sterling, 1999; Conway et al. 2010). Red–green type II receptive fields would therefore form a distinct population in the visual system of trichromatic primates according to the two channel model. What has been lacking to date is a critical control experiment, that is, to determine whether the originally distinguished type II receptive fields are unique to primates expressing trichromatic vision or are simply at one end of a distribution of PC cells with a range of spatial sampling properties.
Understanding whether the PC pathway transmits signals for colour and acuity through separate subpopulations is important goal for two main reasons. Firstly, although there is no anatomical evidence for colour-selective wiring of PC pathway cells (Boycott & Wässle, 1991; Wässle et al. 1994; Jusuf et al. 2006b; but see also Calkins et al. 1994), several physiological studies suggest that the PC cell receptive fields have functionally adapted to favour transmission of colour over spatial signals (Lee et al. 1998; Reid & Shapley, 2002; Solomon et al. 2005; Buzás et al. 2006; but see also Diller et al. 2004 and Crook et al. 2011).
Diurnal Old World monkeys, such as macaques, show almost exclusively trichromatic colour vision (Onishi et al. 1999). In contrast, many New World monkeys show highly variable colour vision, because cone pigments in the medium-to-long wavelength-sensitive (ML) range are encoded as allelic variants at a single locus on the X chromosome (Hunt et al. 1993). Male marmosets, and females which carry the same allele on each X chromosome, show dichromatic colour vision. Female marmosets carrying distinct alleles show one of three trichromatic phenotypes (Travis et al. 1988; Tovée et al. 1992). This natural experiment allows study of the consequences of alterations in ML pigments upon neural responses underlying spatial and colour vision.
With the exception of colour vision polymorphism, the afferent visual pathway in marmosets is quantitatively similar to that of humans and macaques (Yeh et al. 1995; Yamada et al. 1996; Blessing et al. 2004). Spatial and chromatic properties of PC cells in marmosets have been addressed independently in some of the studies cited above. The goal of the present study was to make direct comparison of spatial tuning and red–green colour-selective properties across dichromatic and trichromatic marmosets using identical stimulus and cell sampling protocols. The results do not support the presence of a distinct group of colour-selective type II PC cells in trichromatic marmosets. We previously studied PC cell responses in trichromatic marmosets using discrete spatial stimuli (apertures and annuli) to isolate centre and surround contributions to PC cell responses (Buzás et al. 2006). The results were broadly consistent with random wiring, with functional bias increasing the proportion of cone opponent cells in peripheral retina, above the predictions of a pure random model. Our results extend the conclusions of Buzás et al. (2006) by showing that in trichromatic marmosets, responses of PC cells to coloured gratings are also consistent with a ‘random wiring with functional bias’ model, meaning that transmission of red–green colour signals has been accompanied by subtle changes in synaptic weight to centre–surround receptive fields, not by evolution of specialized colour-coding cells.
Methods
Ethical approval
Marmosets (Callithrix jacchus, n = 14) were obtained from the Australian National Health and Medical Research Council (NHMRC) combined breeding facility (Churchill, VIC, Australia). Procedures were approved by institutional (University of Melbourne) Animal Experimentation and Ethics Committee, and conform to the Society for Neuroscience and NHMRC policies on the use of animals in neuroscience research.
Genotyping
In 8 of the 10 female animals, the genes encoding ML opsins were identified by PCR–restriction fragment length polymorphism prior to recordings, as described in detail elsewhere (Blessing et al. 2004). In the remaining females and all males, the ML cone complement was diagnosed from PC cell responses without prior genetic analysis. Details for each animal studied are shown in Table 1.
Table 1.
Summary of marmoset phenotypes
| ID | Phenotype | Colony ID | Sex | Diagnostic | No. of PC cells |
|---|---|---|---|---|---|
| 89 | 543/563 | 847 | Female | PCR + Phys | 9 |
| 90 | 556/563 | 693 | Female | PCR + Phys | 17 |
| 95 | 543 | 871 | Male | Phys | 6 |
| 96 | 563 | 748 | Male | Phys | 9 |
| 97 | 556 | 822 | Male | Phys | 10 |
| 101 | 556 | 825 | Female | PCR + Phys | 16 |
| 102 | 543/556 | 872 | Female | PCR + Phys | 7 |
| 103 | 543 | 864 | Male | Phys | 7 |
| 104 | 543/556 | 890 | Female | PCR + Phys | 7 |
| 107 | 543/563 | 835 | Female | PCR + Phys | 37 |
| 109 | 543/556 | 881 | Female | PCR + Phys | 29 |
| 112 | 556/563 | 831 | Female | PCR + Phys | 11 |
| 115 | 543/563 | 850 | Female | Phys | 18 |
| 116 | 543/563 | 851 | Female | Phys | 8 |
Abbreviations: ID, identification number; PC, parvocellular; PCR, polymerase chain reaction diagnosis; Phys, physiological diagnosis.
Experimental preparation
Animals were anaesthetized with inhaled isoflurane (Forthane; Abbott, Sydney, NSW, Australia; 1.5–2%) carried in Carbogen (5% C02 in O2) and intramuscular ketamine (Ketalar; Parke-Davis, Sydney, NSW, Australia; 30 mg kg−1) for surgery. A femoral vein and the trachea were cannulated. Animals were artificially ventilated with a 70%–30% mixture of NO2–carbogen. A venous infusion of 40 μg kg−1 alcuronium chloride (Alloferin; Roche, Sydney, NSW, Australia) in dextrose Ringer solution (Baxter, Sydney, NSW, Australia) was infused at a rate of 1 ml h−1 to maintain muscular relaxation. Anaesthesia was maintained during recording with an intravenous infusion of sufentanil citrate (Sufenta-Forte, Janssen-Cilag, Beerse, Belgium; 4–8 μg kg−1h−1).
Electroencephalogram (EEG) and electrocardiogram signals were monitored to ensure adequate depth of anaesthesia. The EEG signal was subjected to Fourier analysis. Dominance of low frequencies (1–5 Hz) in the EEG recording and absence of EEG changes under noxious stimulus (tail pinch) were taken as the chief signs of an adequate level of anaesthesia. We found that low dose rates in the range cited above were always very effective during the first 24 h of recordings. Thereafter, drifts towards higher frequencies (5–10 Hz) in the EEG record were counteracted by increasing the rate of venous infusion or the concentration of anaesthetic. The typical duration of a recording session was 48–72 h. At the termination of the recording session, the animal was killed with an overdose of pentobarbitone sodium (80–150 mg kg−1, i.v.).
Visual stimulus and single-cell recording
The animal was mounted in a stereotaxic frame that was tilted to bring the optic axis close to the horizontal plane. The positions of the fovea and optic disc were mapped onto a tangent screen using a fundus camera equipped with a rear projection device. The table supporting the stereotaxic frame was rotated as required to bring the receptive fields of recorded cells near the centre of the tangent screen. These movements were monitored by means of a laser attached to the table.
The corneas were protected with oxygen-permeable contact lenses with curvature set to focus the eyes near 114 cm. A gimballed front-silvered mirror was used to reflect the stimulus image onto the receptive field of recorded units. For each eye, the first cell encountered that responded to grating spatial frequencies higher than 1 cycle deg−1 (cpd) was used to optimally refract that eye with a supplementary glass lens. The optimal lens power was determined by choosing the lens that permitted response to the highest possible spatial frequency of a black–white drifting sinusoidal grating. Receptive field diameters were consistent with reported values for marmoset lateral geniculate nucleus (Kremers & Weiss, 1997; White et al. 2001; Kilavik et al. 2003). The reader should note that the relatively small size of the marmoset eye (foveal magnification factor, 128 μm deg−1; Troilo et al. 1993) increases the angle subtended by receptive fields in comparison with the situation in the macaque eye (foveal magnification factor, 200 μm deg−1; Perry & Cowey, 1985). Pupil diameter varied between ∼2 and 4 mm, yielding retinal illuminance in a range equivalent to ∼300–1500 human Troland (Troilo et al. 1993; Victor et al. 2007). Topical atropine or neosynephrine was applied if required to keep pupil diameter in the range given above. Accurate centring of the stimulus on the receptive field was confirmed during data collection, by monitoring the position of maximal response to a small (0.05 deg radius) flashed spot. On rare occasions, drifts in eye position and/or accommodative state became evident during data collection, because such drifts caused characteristic changes in recorded response amplitude and trial-to-trial variability. These data were discarded.
In early experiments, visual stimuli were generated using a Series Three video signal generator (VSG Series Three; Cambridge Research Systems, Cambridge, UK) and presented on a Reference Calibrator Plus monitor (Barco Systems, Kortrijk, Belgium) at a frame refresh rate of 80 Hz. Mean luminance was 55 (Expo) or 32 cd m−2 (VSG). The VSG system incorporates a photometric feedback system for colorimetric specification and γ correction to allow direct specification of stimuli in Commission Internationale de l'Eclairage (CIE) colorimetric coordinates (x, y, Y). In later experiments, visual stimuli were generated using Open GL commands controlled via freely available software (Expo) written by Peter Lennie (University of Rochester, Rochester, New York, USA) and presented on a linearized, colorimetrically calibrated Sony G520 monitor refreshed at 120 Hz. The accuracy of both systems was verified with a PR-650 photometer (Photo Research, Palo Alto, CA, USA).
For each cell, the optimal spatial frequency, temporal frequency, orientation and contrast were determined, using achromatic drifting gratings presented within a 4 deg diameter aperture. An aperture-tuning curve was measured using the optimal stimulus parameters. An aperture diameter which was slightly above the optimal diameter, and which also was an integer multiple of the optimal spatial period, was used thereafter. Such apertures encompass both centre and surround components of the classical receptive field (Solomon et al. 2002). Receptive field dimensions were estimated by difference-of-Gaussians (DOG) fit to the spatial frequency tuning curve using standard methods (Croner & Kaplan, 1995; White et al. 2001). At the low temporal frequencies used for these measurements (4–5 Hz), the phase error introduced by using the DOG fit rather than a vector model (Frishman et al. 1987; Kilavik et al. 2003) is small (<15 deg).
A set of spectral absorbance templates (nomograms) with peak wavelengths corresponding to those present in a given animal was generated using polynomial templates (Lamb, 1995). Lens absorbance was corrected using published measurements for the marmoset (Tovée et al. 1992). The effect of receptor self-screening was estimated assuming axial absorbance of 1.5% and outer segment length 20 μm. For measurements taken using the VSG system, the cone contrast for a given stimulus was calculated for each nomogram by convolution with the [x, y, Y] co-ordinates of the grating components via the Judd-Voss modified CIE 1931 colour-matching functions (Brainard, 1996). For measurements taken using the Expo system, the contrast in a given class of cone generated by a given stimulus was obtained by calculating the inner product between the relevant cone nomogram and the spectral power distribution of the R, G and B guns specified by the stimulus. Action potential time series from individual PC cells were digitized at 10 kHz. The frequency of action potentials (impulses) per second was subjected to Fourier analysis. The first harmonic amplitude and phase were used as response measures. Not all tests were performed on all cells.
The accuracy of our cone contrast calculations was confirmed by measuring, for a subset of PC cells, responses to low spatial frequency modulation where the relative intensity of the red and green monitor phosphors was varied systematically. As shown in Fig. 1A, for a PC cell recorded in a male marmoset predicted to express the 556 nm pigment, the theoretical silent exchange point for the 556 nm pigment (s556; Fig. 1A) corresponds to the position of response amplitude minimum and response phase reversal for this cell. Thus, the functional input to this PC cell is dominated by a single cone mechanism at the light levels used for these experiments. Parallel results were obtained for marmosets predicted to express the 543 and 563 nm pigments; that is, responses were consistent with dominant input from the single predicted cone mechanism. Figure 1A shows the mean and range of response minima in cells recorded from two animals predicted to express the 556 nm pigment (MY101, MY97) and one animal predicted to express the 543 nm pigment (MY103). The physiological data are in good accord with prediction. Parvocellular cells recorded in female marmosets predicted to express two ML cone types did not show stereotyped behaviour to this same stimulus. An example is shown in Fig. 1B; for this PC cell, there is no response amplitude minimum, and over the range of relative intensities tested the response phase changes slowly. Hereinafter, we refer to trichromatic phenotypes according the spectral separation (in nanometres) of ML cone peak sensitivity, as follows: 556 nm/563 nm (Δ7 nm) phenotype; 543 nm/556 nm (Δ13 nm) phenotype; and 543 nm/563 nm (Δ20 nm) phenotype. We refer to the distinct ML range cone types expressed in trichromatic marmosets according to their relative spectral position. Thus the 556 nm cone is referred to as the M cone for the (556 nm/563 nm) Δ7 nm phenotype, but is referred to as the L cone for the (543 nm/556 nm) Δ13 nm phenotype. Spatial frequency tuning curves were recorded using in-phase modulation of the R and G monitor guns (hereinafter referred to as R + G or ‘luminance’ modulation) or out-of-phase modulation of the R and G monitor guns. For R + G modulation, the R and G guns were normally set to their maximal values (nominal 100%); if lower values were used, the response was normalized to 100% contrast. For out-of-phase modulation, the relative intensity of the R and G guns was set either to the silent substitution point(s) for the expressed ML pigment(s) or to produce approximately equal amplitude and opposite phase modulation in the M and L cones expressed by trichromatic marmosets. We refer to the latter stimulus condition as R − G or ‘chromatic’ modulation. Cone contrasts produced by these stimuli are summarized in Table 2. For dichromatic marmosets, the silent substitution grating for the expressed cone type was used as surrogate for the R − G grating. As shown in Fig. 1, in dichromatic animals the silent substitution grating acts as a control against errors in estimating the corneal cone sensitivities. In trichromatic animals, this confound is difficult to distinguish from true L–M opponent interaction.
Figure 1. Accuracy of cone contrast calculations.

A and B, response amplitude and phase of a PC cell in a dichromatic marmoset as a function of the relative intensity (RG balance) of out-of -phase modulated red and green monitor guns. Arrows above the graphs show the predicted silent substitution (s) ratio for cone mechanisms at the indicated peak wavelength. Note sharp response minimum and phase reversal corresponding to the predicted value for the 556 nm cone. Horizontal lines beneath the amplitude graph in A show the mean (symbols) and range of response minima in samples of PC cells from three dichromatic marmosets. Note that minima are located close to predictions for a single cone mechanism: minima for animals MY97 and MY101 are close to the prediction for 556 nm and minima for animal MY103 are close to the prediction for 543 nm. C and D, response amplitude and phase in a PC cell from a 543 nm/563 nm (Δ13 nm) phenotype marmoset. Note the lack of clear response minimum across the range of relative intensities tested.
Table 2.
Cone contrasts
| Δ7 nm M (556) | Δ7 nm L (563) | Δ13 nm M (543) | Δ13 nm L (556) | Δ20 nm M (543) | Δ20 nm L (563) | |
|---|---|---|---|---|---|---|
| R − G | 0.035 | −0.072 | 0.125 | −0.126 | 0.176 | −0.181 |
| MS | n.d. | n.d. | 0.245 | <0.001 | 0.346 | <0.001 |
| LS | n.d. | n.d. | <0.001 | −0.246 | <0.001 | −0.346 |
Michelson cone contrasts given by chromatic (M–L) and cone-selective gratings (MS, LS). Numbers in parentheses show the λmax of the M or L cone pigment in each phenotype. Positive values for R − G indicate that modulation from red (phase 0 deg) to green (phase 180 deg) increases cone excitation; negative values indicate the converse. Abbreviations: Δ7 nm, 556 nm/563 nm phenotype; Δ13 nm, 543 nm/556 nm phenotype; Δ20, 543 nm/563 nm phenotype; and n.d., not determined.
Cells were also tested for signs of functional input from short-wavelength-sensitive (S) cones as described elsewhere (Forte et al. 2006; Tailby et al. 2010). None of the PC cells described here responded to S-cone-selective gratings at amplitudes above 5 impulses s−1. Where appropriate in the following analysis, we categorized cells as non-opponent if the gain ratio (R − G)/(R + G) was less than unity or if the maximal response to the R − G stimulus was below 10 impulses s−1. However, the reader should note that as in our previous studies (Blessing et al. 2004; Buzás et al. 2006) the results showed a continuum of response properties in PC cells on all stimulus dimensions we measured, and this criterion does not imply the existence of discrete subclasses of PC cells.
Where appropriate, the proportion of opponent PC cells was compared with predictions of a ‘hit and miss’ binomial model of L and M cone inputs to PC receptive fields (Mullen & Kingdom, 1996) as previously described in detail (Buzás et al. 2006). Briefly, the number of cones converging on the receptive field centre at a given eccentricity was estimated from published data (Goodchild et al. 1996). The opponent purity for random wiring was predicted assuming 1:1 L to M cone ratio and 1:6 centre to surround cone convergence ratio. These values yield the relationship  , where O is opponent purity, c1 = 1.0813, c2 = 0.2723, λ1 = 1.5079, λ2 = 0.0647 and n is the number of cones in the receptive field centre (Mullen & Kingdom, 1996; Buzás et al. 2006).
Results
We report results from a total of 191 PC cells (Table 1). Forty-eight cells (25%) were recorded from five animals showing dichromatic phenotype, that is, PC cell responses were consistent with input from a single cone mechanism in the medium–long (ML)-wavelength-sensitive range (Fig. 1). Twenty-eight cells (15%) were recorded from two animals showing trichromatic 556/563 phenotype (Δ7 nm), 43 cells (23%) were recorded from three animals showing 543/556 (Δ13 nm) phenotype, and 72 cells (38%) were recorded from four animals showing 653/563 (Δ20 nm) phenotype. For 96 cells, the physiological characterization was compared with histological reconstruction as described in our previous studies (White et al. 2001; Szmajda et al. 2006). Of these cells, 57 (59%) were located in the external PC lamina, 38 (40%) were located in the internal PC lamina, and one (1%) was located in koniocellular layer K3. No systematic differences in response properties were seen on comparing these anatomically distinct cell populations, so data were pooled for analysis. Responses of some cells to a subset of the stimuli used here were described previously (Buzás et al. 2006; Forte et al. 2006; Victor et al. 2007). These data were reanalysed for the present study. Some of the present findings were reported in abstract form (Martin et al. 2009).
Emergence of red–green opponent responses
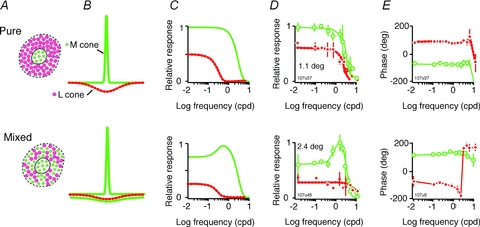
Figure 2 shows example spatial frequency tuning curves for R + G gratings (Fig. 2B) and R − G gratings (Fig. 2C) for one dichromatic and three trichromatic marmosets. The cone complement expressed by each animal is indicated by the small sketches above each column (Fig. 2A). The stimulus waveform is shown schematically at the right of the figure. For all phenotypes, responses to R + G modulation (Fig. 2B) show the bandpass tuning expected from centre–surround antagonism (Enroth-Cugell & Robson, 1966; Derrington & Lennie, 1984; Kremers & Weiss, 1997; White et al. 2001). Consistent with responses to achromatic (black–white) gratings previously reported (Kremers & Weiss, 1997; Kremers et al. 2001; Solomon et al. 2002; Blessing et al. 2004; Webb et al. 2005), the peak spatial frequency for cells outside the fovea is typically between 1 and 5 cpd, and response falls close to noise levels above 10 cpd.
Figure 2. Colour and luminance signals in marmoset PC cells.
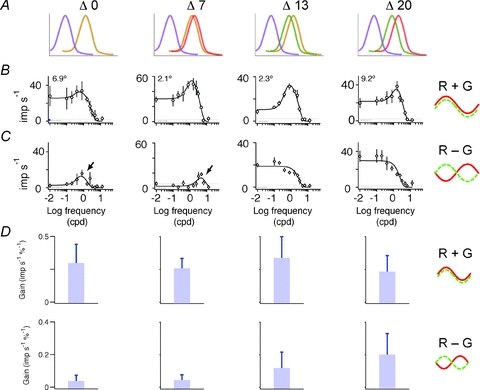
Each column shows responses of an example cell for each marmoset colour vision phenotype. A, sketches of the cone complement. The spectral separation between long (L) and medium (M) wavelength-sensitive cones is indicated above each sketch. Note that none of the PC cells recorded showed significant functional input from short-wavelength-sensitive cones. B, spatial frequency modulation transfer functions for in-phase (R + G, ‘luminance’) modulated gratings. C, spatial frequency modulation transfer functions for out-of-phase (R − G, ‘chromatic’) modulation. In all phenotypes, the luminance transfer function shows bandpass characteristics, with peak spatial frequency at 1–5 cycles deg−1 (cpd). In the Δ13 and Δ20 nm phenotypes, responses to chromatic modulation are present at low spatial frequencies. The spatial/temporal profile of cone modulation is sketched to the right of the graphs. Continuous line, L cone; dashed line, M cone. Error bars show standard deviations. Inset values in B show receptive field distance from the fovea. D, bar graphs showing mean and standard deviation for each measured cohort for R + G (upper row) and R − G stimuli (lower row).
The R − G tuning functions (Fig. 2C) show marked differences among the different phenotypes. In the dichromatic (Δ0 nm) and trichromatic Δ7 nm phenotypes the response is close to the noise level (continuous grey lines, Fig. 2B and C) at low spatial frequencies and exhibits a small, sharply bandpass ‘blip’ response with a peak between ∼1 and 5 cpd (arrows in Fig. 2C). We previously showed that in dichromatic marmosets, this response is attributable to longitudinal and/or transverse chromatic aberrations in the eye (Forte et al. 2006). As the blip response in the Δ7 nm phenotype shows characteristics consistent with those we reported for dichromatic marmosets, we presume it has the same origin. However, we did not study these responses in more detail because complete spatial tuning functions were only obtained for a small number of cells (n = 7) in the Δ7 nm phenotype. In the Δ13 and Δ20 nm phenotypes, the R − G response is well above the noise level for all frequencies tested below 1 cpd, and the response shows the low-pass tuning characteristic expected from synergistic combination of centre and surround mechanisms. Population responses for low (<0.02 cpd) spatial frequency modulation are summarized in Fig. 2D, which shows means and standard deviations for R − G and R + G modulation. As previously reported (Victor et al. 2007), on average the chromatic sensitivity increases with increasing spectral separation of L and M pigments, with wide intercell variation.
The increase in gain for R − G modulation appears proportional to the increasing (M–L) contrast in the stimulus, which increases from ∼10% for the Δ7 nm phenotype to over 30% in the Δ20 nm phenotype (Table 2). We tested proportionality by calculating R − G gain after dividing by the sum of M and (–L) cone contrast (Table 2). According to this normalization, the mean gain for the Δ13 nm phenotype (1.87; SD, 1.56; n = 37) is very close to the mean gain for the Δ20 nm phenotype (1.57; SD, 1.015; n = 70; P = 0.78, Wilcoxon rank-sum test). The ‘un-normalized’ R − G gain in the Δ7 nm phenotype (mean, 0.045; SD, 0.032; n = 28) is not distinguishable from the value for dichromats (0.038; SD, 0.035; n = 48; P = 0.23, Wilcoxon rank-sum test) so responses in the Δ7 nm phenotype were not included in this proportionality test. In sum, these data are consistent with R − G response amplitude as proportional to M–L cone contrast (see also Victor et al. 2007).
Complete spatial tuning functions for R + G and R − G gratings were obtained for 116 PC cells. As noted above, analysis of responses to R − G gratings is complicated by the fact that the high-frequency limb of the R − G response can be corrupted by chromatic aberrations. We handled this problem by considering R − G amplitude at two spatial frequencies: low frequency (where centre and surround are active) and the peak spatial frequency for the R + G response (where centre only is active). Analysis of centre radius for R + G gratings is presented in a later section.
Figure 3 shows population spatial tuning data. Data for cells with receptive field eccentricity below 20 deg are shown. Each row shows two scatter plots for one phenotype, with response amplitudes recovered from DOG fits to the data. The left column shows responses to R + G modulation. Each plot compares the amplitude at the optimal spatial frequency (x-axis) with the response at low (<0.02 cpd) spatial frequency (y-axis). For R + G modulation, it can be seen that there is substantial overlap in the distribution of points on comparing the different phenotypes. Furthermore, the great majority of points (>80%) for each phenotype lies below the unity line (dotted lines in Fig. 3). This indicates bandpass spatial tuning consistent with centre–surround antagonism. The right column shows responses to R − G modulation; here the x-axis shows responses at the optimal frequency for (R + G) modulation, and the y-axis shows responses for low-frequency modulation (<0.02 cpd). For nearly all cells in the Δ20 nm phenotype, and a smaller proportion of cells in the Δ13 nm phenotype, responses lie above the unity line, indicating more low-pass spatial tuning for chromatic than for luminance modulation. In summary, the example tuning curves (Fig. 2) exemplify the main result. With increasing separation of M and L photopigments, there is little change in spatial tuning for luminance contrast, yet responses to red–green colour contrast emerge in the low spatial frequency band. Quantitative comparison of receptive field dimensions between phenotypes (as described in a later section, Comparison of spatial tuning in dichromats and trichromats) confirmed this main finding.
Figure 3. Summary of spatial transfer properties.
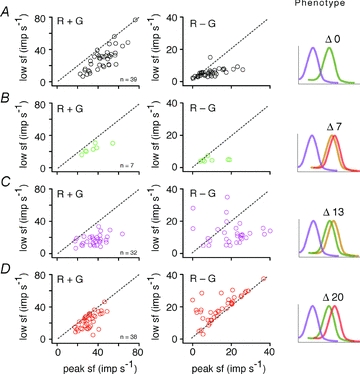
Response amplitude estimates were recovered from difference of Gaussians (DOG) fits to the fundamental Fourier component at the spatial frequency (sf) of the stimulus. Upper row (A) shows pooled data from dichromatic marmosets (n = 39). The other rows show data from trichromatic marmosets with peak M and L cone sensitivities as follows: 556 nm/563 nm (Δ7 nm; B); 543 nm/563 nm (Δ13 nm; C); and 543 nm/563 nm (Δ20 nm; D). The cone complements are shown schematically together with the spectral separation of M and L pigments in the right column. Left column, R + G modulation. The majority of data points lie below the unity line, indicating centre–surround antagonism. Right column, L–M modulation. Most points for the Δ20 nm phenotype, and a smaller number of points for the Δ13 nm phenotype, lie above the unity line, indicating low-pass spatial tuning.
Response timing in subpopulations of PC cells
In macaque monkeys, the red–green opponent ganglion cells in the retina and in the PC layers of the lateral geniculate nucleus can be separated into distinct clusters on the basis of response timing relative to chromatic and luminance modulation (Derrington et al. 1984; Smith et al. 1992; Lankheet et al. 1998). We reasoned that if similar retinal processing generates PC fields in macaques and marmosets, then responses of PC cells in trichromatic marmosets should comprise timing clusters similar to those described for macaques. Figure 4 gives evidence that this is the case.
Figure 4. Phase coherence of PC cell cohorts.
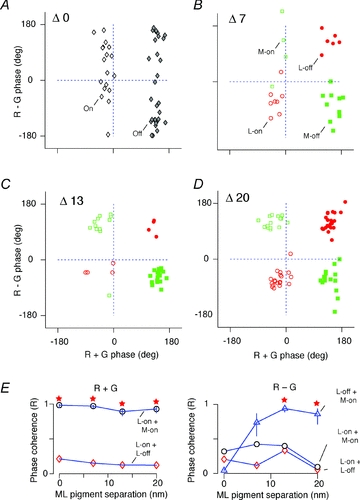
A–D, each scatter plot shows the response phase for R + G modulation (x-axis) against R − G modulation (y-axis) for one phenotype as indicated at the top left of the plot. Note the wide phase dispersion for R − G modulation in the dichromatic phenotype. E, phase coherence and spectral separation of L and M cones. Coherence is high across like (on- or off-) response sign for R + G modulation (left panel), and for opposite response sign for R − G modulation (right panel). Stars indicate P < 0.01 (Rayleigh test for uniform circular distribution).
In Fig. 4A–D, the scatter plots show response phase for R + G and R − G modulation. Responses to low spatial frequency (<0.02 cpd) modulation at 4 Hz are shown. For R + G modulation, the off-centre cells respond as a coherent group, with response maximum following the stimulus minimal luminance. In trichromatic marmosets (Fig. 4B–D), cells receiving dominant centre input from M cones (‘M-off’) respond in phase with cells receiving dominant centre input from L cones (‘L-off’), and the response phase is consistent with the phase of off-centre cells in dichromatic marmosets (Fig. 4A). In response to R − G modulation, for trichromatic phenotypes, the L-off and M-off cells show approximately 180 deg phase difference (Fig. 4B–D). Conversely, cells showing opposite (on or off) response sign, but receiving distinct (L or M) spectral inputs, respond in phase for chromatic modulation. For example, in the Δ20 nm phenotype, the average response phase of L-on cells (−65.3 ± 23.7 deg, mean ± angular SD; n = 19) is close to that of M-off cells (−64.7 ± 37.0 deg; n = 15; Fisher F-statistic = 0.0, P = 0.953, Watson-Williams test for equal mean angle), and the average response phase of M-on cells (119.7 ± 16.2 deg; n = 15) is close to that of L-off cells (120.5 ± 26.8 deg; n = 21; F = 0.0, P = 0.917, Watson-Williams test for equal mean angle).
We analysed these population responses by measuring the Rayleigh phase coherence (R statistic) for different response cohorts. The Rayleigh statistic is given by the following equation:
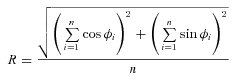 |
for a cohort of n cell responses exhibiting response phase ϕ1…ϕn. Confidence intervals (±95%) on the R statistic were estimated from bootstrap replicas (Statistics toolbox; Mathworks, Natick, NJ, USA). As expected, for R + G modulation the coherence for M-on and L-on cells is high (mean R = 0.93, P < 0.01 for each phenotype; Fig. 4E); a similar value was obtained for the combined cohort of M-off and L-off cells (mean R = 0.93, P < 0.01 for each phenotype). Accordingly, for R − G modulation the coherence for like-response sign is low (mean R = 0.31 for L-on and M-on, mean R = 0.36 for L-off and M-off, Fig. 4E). With increasing spectral separation of L and M cones, an increasingly coherent response to chromatic modulation emerges among cells receiving opposite-sign excitation from distinct cone mechanisms (Fig. 4E). For example, in trichromatic Δ13 and Δ20 phenotypes the mean R = 0.90 for the combined cohort of L-on and M-off cells, and mean R = 0.88 for the combined cohort of L-off and M-on cells.
We conclude that with expression of distinct M and L pigments in marmosets, distinct subclasses of PC cells can be identified on the basis of response timing to chromatic stimuli. What we show in the following sections is that these chromatic responses are superimposed upon, but do not change, the spatial tuning and timing of responses to luminance modulation.
Responses to cone-selective gratings
Are the cone inputs to PC cells specifically organized to amplify chromatic signals or do they arise by ‘random’ connections with the cone mosaic? The presence of polymorphic colour vision in marmosets allows us to address this question. This is because according to the random wiring hypothesis, the mechanisms producing centre–surround antagonism are sufficient to produce red–green responses in retinas expressing both M and L cones (Paulus & Kröger-Paulus, 1983; Bowmaker et al. 1987; Lennie et al. 1991). We previously showed in a study of Δ20 nm phenotype marmosets that chromatic selectivity of PC cells is predicted by overall segregation of M and L cone inputs to centre and surround of the receptive field (Buzás et al. 2006). In the following, we analyse responses to cone-selective gratings in the Δ13 and Δ20 nm marmoset phenotypes, and compare spatial tuning across retinal eccentricity for all marmoset phenotypes.
Hereinafter, we refer to L-cone-selective gratings as LS gratings and to M-cone-selective gratings as MS gratings. Figure 5 shows example tuning curves for LS and MS gratings in two PC cells recorded in one marmoset (Case MY107, Δ20 nm phenotype), together with a schematic representation how L and M cone inputs could explain the spatial tuning curves. The upper row shows responses consistent with exclusive M cone inputs to the receptive field centre and exclusive L cone inputs to the receptive field surround (Fig. 5A–D, upper row). This spatial arrangement predicts low-pass frequency tuning for both LS and MS gratings, with the frequency tuning curve for the centre shifted upwards and rightwards. The lower row shows predictions for a cell receiving exclusively M cone input to the centre and mixed (M + L) inputs to the surround; the cell shows low-pass tuning for MS gratings (Fig. 5D, lower row) and bandpass tuning for LS gratings. The response phase for LS and MS gratings differs by close to 180 deg at low and intermediate spatial frequencies, indicating dominance of M cones to centre and L cones to surround (Fig. 5E). In the following sections, we characterize receptive fields of PC cells by, firstly, response amplitude at low spatial frequency for cone-selective and chromatic gratings and, secondly, the shape of the lower frequency limb of the spatial tuning functions. The first metric allows red–green colour sensitivity to be related to the overall balance of L and M cone inputs; the second allows the contribution of each cone type to the receptive field surround mechanism to be assessed.
Figure 5. Segregation of M and L cone inputs to PC cells.
A, hypothetical arrangement of cone inputs to a PC receptive field. Both examples show exclusive excitatory (centre) input from M cones. Upper example shows exclusive inhibitory (surround) input from L cones. Lower example shows mixed input of M and L cones to the surround. B, DOG model functions to approximate the input weighting functions for these distributions, where each cone contributes to a separate DOG. C, frequency spectra of these DOG functions. Note that the upper example predicts low-pass frequency tuning for M cones, whereas the lower example predicts bandpass tuning for M cones. D, spatial frequency tuning curves from two PC cells consistent with the predicted pattern. For ease of comparison with the DOG model, normalized responses to cone-selective gratings are shown. Continuous line, DOG fit to M-cone-selective (MS) gratings. Dashed line, DOG fit to L-cone-selective (LS) gratings. Cone weight [LS/(LS+ MS)] and RG gain values are as follows: upper row, 0.42 and 3.73; lower row, 0.39 and 3.24, respectively.
Cone weight and red–green colour sensitivity
The purpose of the next experiments was to establish whether PC cells in trichromatic marmosets comprise discrete populations coding luminance or chromatic variation, or whether they form a single population with continuous variation in chromatic sensitivity. Figure 6 shows analysis of responses to low-frequency (<0.02 cpd) LS and MS gratings. Pooled data from Δ13 and Δ20 nm phenotypes are shown. Cells are classified according to the dominant cone (M or L). The mean response amplitude of cells dominated by L cone input (18.92 ± 10.54 impulses s−1, mean ± SD; n = 44) was close to that of cells dominated by M cone input (19.94 ± 13.31 impulses s−1; n = 55; P = 0.98, Wilcoxon rank-sum test). As the LS and MS gratings deliver approximately equal contrast to L and M cones (Table 2), this result suggests there is no systematic bias in functional weight of L or M cone inputs to PC cells in our sample. As shown in Fig. 6A, for the great majority of cells in which response phase could be reliably measured at low spatial frequency (80/93, 86%), response phase for LS gratings showed greater than 90 deg phase difference to response phase for MS gratings, indicating opponent (L–M) interaction (Smith et al. 1992; Lankheet et al. 1998; Solomon et al. 2005). Accordingly, cells showing RG gain greater than one all cluster near 180 deg phase difference between responses to LS and MS gratings (Fig. 6A).
Figure 6. Range of chromatic selectivity in PC cells.
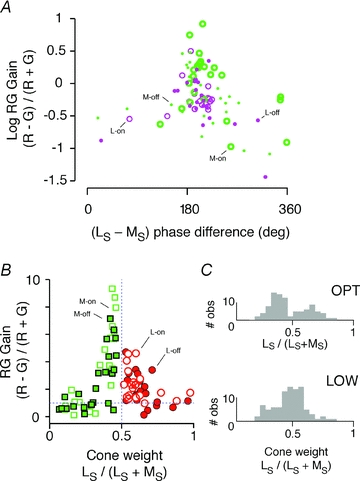
A, response phase difference between L-cone-selective (LS) gratings and M-cone-selective (MS) gratings compared with red–green chromatic sensitivity (RG gain). Phase is referenced to the dominant (M or L) centre cone. B, relative response amplitude for LS and MS gratings compared with RG gain. Note the wide range of cone weights, and that cells with approximately equally weighted L and M cone inputs show higher RG gain. C, histograms showing how distribution of cone weights for LS and MS gratings becomes broader with increasing spatial frequency, consistent with increased contribution of the excitatory cone mechanism to response amplitude.
At low spatial frequency, the response amplitudes for LS and MS gratings are positively correlated (correlation coefficient 0.75; r2 = 0.57, P < 0.01). This means that sensitivity to chromatic (R − G) gratings should be greatest for PC cells which receive balanced inputs from L and M cones. To test this prediction, we measured the ratio of response amplitude for (R − G) and (R + G) gratings. We refer to this ratio [(R − G)/(R + G)] as RG gain. In Fig. 6A, the x-axis shows relative response amplitude for cone-selective gratings [LS/(LS+ MS)], and the y-axis shows RG gain. As predicted, RG gain is greater for cells with approximately equal and opposite sign inputs from L and M cones. The average RG gain for M-cone-dominated cells (4.09 ± 6.35, mean ± SD; n = 48) was higher than the average RG gain for L-cone-dominated cells (2.10 ± 1.14; n = 41), but this difference is not significant (P = 0.58, Wilcoxon rank-sum test). Complete spatial frequency tuning functions were obtained for R + G gratings for nearly all the cells shown in Fig. 6A (87/99, 88%). We therefore compared receptive field dimensions of cells showing balanced {0.4 < [LS/(LS+ MS)] < 0.6} or unbalanced cone weights. As expected, the RG gain for balanced cells (5.10 ± 6.57, mean ± SD; n = 40) is significantly greater than the RG gain for unbalanced cells (1.52 ± 1.23; n = 47; P < 0.01, Wilcoxon rank-sum test). The centre radius returned by DOG fits to the R + G spatial frequency tuning curves shows, however, close correspondence between balanced (0.106 ± 0.064 deg, mean ± SD; n = 40) and unbalanced cells (0.085 ± 0.049, mean ± SD; n = 47; P = 0.21, Wilcoxon rank-sum test). Likewise, the ratio of centre to surround radius shows no difference between balanced (0.196 ± 0.269, mean ± SD; n = 40) and unbalanced cells (0.166 ± 0.177, mean ± SD; n = 47; P = 0.43, Wilcoxon rank-sum test). Thus, there is heavy overlap of spatial tuning in cells with balanced or unbalanced cone inputs. The histograms in Fig. 6C compare the distribution of cone weights for low and optimal spatial frequency luminance gratings. As expected, the distribution becomes broader at optimal spatial frequency because the relative weight of the centre-dominating cone increases. Neither distribution, however, showed a significant departure from unimodality (P > 0.1, Hartigan unimodality statistic; Mechler & Ringach, 2002).
In summary, responses to cone-isolating gratings reveal a broad correlation between cone weights and RG gain rather than existence of a discrete population of large, colour-selective receptive fields.
Visual field eccentricity and red–green colour sensitivity
We previously showed that in trichromatic marmosets the proportion of red–green opponent PC cells is reduced outside the foveal visual field, but is nevertheless higher than expected under a purely random model of cone connections to PC cell receptive fields (Buzás et al. 2006). The cell sample in that study was limited because the method used (analysis of responses to stimuli presented in small apertures and annuli) is sensitive to small changes in eye position and is difficult to apply to receptive fields which depart from circular symmetry. Spatial frequency analysis is relatively immune to these problems (Forte et al. 2002), allowing more receptive fields to be analysed and a systematic study of eccentricity-dependent changes to be made. In this section, we show how red–green sensitivity is related to eccentricity in trichromatic marmosets and compare responses to spatial contrast in dichromatic and trichromatic marmosets. We show that centre–surround antagonism changes across the visual field, in a pattern which is common to dichromatic and trichromatic marmosets.
Figure 7A shows RG gain for the Δ20 and Δ13 nm phenotypes as a function of receptive field eccentricity. These data include the cohort (n = 32) from three Δ20 nm phenotype animals previously described using aperture and annulus stimuli (Buzás et al. 2006). We categorized cells as non-opponent if RG gain was less than unity, or if the maximal response to the R − G stimulus was below 10 impulses s−1. These criteria are intentionally ‘conservative’ in the sense that they will only class cells as opponent if they give vigorous R − G responses. We divided the sample of PC cells into three cohorts of large enough size to detect a 50% decline in RG gain at power 0.8 (Lenth, 2006). Receptive fields in the central-most cohort (<2.2 deg eccentricity; n = 36) are predicted to have single-cone centres (Wilder et al. 1996; Jusuf et al. 2006a; Telkes et al. 2008). Receptive fields in the intermediate cohort (2.2–8 deg eccentricity; n = 37) are predicted to have centres encompassing between one and 10 cones (Telkes et al. 2008), and those in the peripheral cohort (>8 deg; n = 35) are predicted to derive excitatory input from 10–70 cones (Jusuf et al. 2006b). In broad agreement with the random wiring hypothesis, the median RG gain (continuous blue line in Fig. 7A,) falls almost threefold from 3.96 in foveal retina to 1.50 in intermediate retina (P < 0.01, Wilcoxon's unpaired test); however, the large increase in cone convergence between intermediate and peripheral samples (median increase, 1.30) is accompanied by only a small reduction in the population RG gain (from 1.50 to 1.30; P = 0.93, Wilcoxon's unpaired test). Three key aspects of these data are summarized in Fig. 7B–D. Firstly, the distribution of RG gain (Fig. 7B) is unimodal (P = 0.22, Hartigan unimodality test), suggesting there is no discrete population of PC cells showing high colour sensitivity. Secondly, the mean RG gain of opponent PC cells (Fig. 7C) shows only mild decrease, from 4.94 in foveal visual field to 3.61 in peripheral visual field (P = 0.05, Wilcoxon's unpaired test). Finally, the fovea contains almost exclusively opponent cells (31/36, 86%; Fig. 7D). The proportion of opponent PC cells is smaller in peripheral visual field (15/35, 43%), but is nevertheless higher than the proportion (12%) predicted by the ‘hit or miss’ binomial model for random wiring described in the Methods section (Mullen & Kingdom, 1996; Solomon et al. 2005; Buzás et al. 2006). In order to confirm that these calculations are not skewed by pooling data from Δ 20 and Δ13 nm phenotypes, we repeated the above analysis using only data from the Δ20 nm phenotype. Omitting the Δ13 nm phenotype increased the population RG gain values (foveal, 4.22, n = 25; intermediate, 2.33, n = 26; and peripheral, 1.38, n = 24) but did not alter the statistical significance of any of the comparisons outlined above. In summary, the data are consistent with a ‘random wiring with functional bias’ model (Buzás et al. 2006), as follows. One-to-one connections in the fovea are sufficient, but not necessary, to create opponent responses. In peripheral retina, cone inputs to centre and surround are biased, creating more opponent cells than predicted by a purely random model.
Figure 7. Eccentricity dependence of RG gain in PC cells.
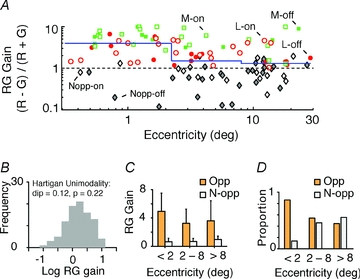
A, RG gain of cells recorded in Δ13 and Δ20 nm phenotypes. Cells were classified into opponent (M-on, M-off, L-on and L-off) or non-opponent (Nopp-on and Nopp-off) groups according to the criteria described in the text. Note the presence of opponent cells throughout the eccentricity range studied, and the low proportion of non-opponent cells in the central-most two degrees. Continuous line shows median RG gain over three ranges: 0–2.2, 2.2–8 and 8–30 deg. B, frequency distribution of RG gain is unimodal, consistent with opponent (Opp) and non-opponent (N-opp) categories forming a single functional population. C, mean RG gain of opponent and non-opponent categories. Error bars show standard deviations. D, proportion of cells in opponent and non-opponent populations.
We next asked whether decreased chromatic sensitivity in peripheral visual field is associated with increased cone mixing in the receptive field surround mechanism. Figure 8A–D shows example tuning curves for cone-selective gratings, R + G gratings and R − G gratings, in four PC cells recorded at eccentricities between 0.3 and 18.1 deg in Δ20 nm phenotype animals. In each case, the data points are shown together with the optimal DOG fit. The reader should note that where response amplitudes are low, the shape of the high-frequency limb of the tuning curve can be quite complex and poorly captured by the DOG fit. This we presume to be a result of corruption by chromatic aberrations, as noted above in the section ‘Emergence of red–green opponent responses’. For this reason, the DOG fits were not used to obtain estimates of subunit size; rather, we characterized spatial antagonism as described in the next paragraph. Receptive fields recorded in central retina (Fig. 8A and B) show low-pass or mild bandpass spatial tuning for both M- and L-cone-selective gratings. This indicates segregation of M and L inputs to spatially distinct (centre and surround) mechanisms. Consistently, response phase for low spatial frequency cone-selective gratings showed close to 180 deg separation between dominant and non-dominant cone inputs (–158.1 ± 22.7 deg, mean ± SD; n = 35), indicating segregation of cone inputs to centre and surround of the receptive field. The receptive fields recorded outside the fovea showed bandpass spatial tuning for cone selective gratings (Fig. 8C and D), indicating mixed cone inputs to the receptive field centre and surround, as previously described using aperture and annular stimuli (Buzás et al. 2006; Crook et al. 2011). Responses to R + G and R − G gratings are consistent with the results shown in Fig. 2; that is, the response to R + G gratings is bandpass and response to R − G gratings is low-pass. We characterized spatial antagonism for cone-selective gratings across the PC population as follows.
Figure 8. Surround inhibition reduces chromatic selectivity in PC cells.
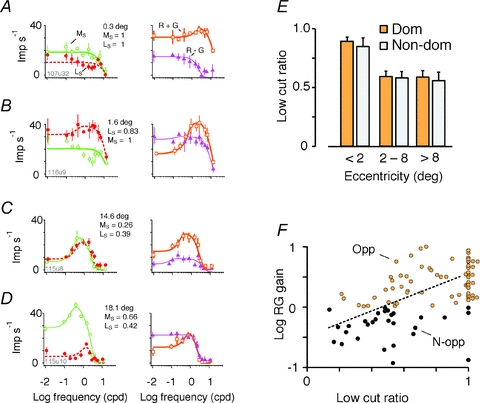
A–D, responses of four example cells to LS and MS gratings. The examples are sorted according to receptive field eccentricity. Data points show mean and standard deviation for the dominant cone mechanism. Continuous lines show DOG fits. Note increasing low-frequency roll-off with increasing eccentricity. Receptive field eccentricity and low cut ratio values extracted from DOG fits are shown to the right of each example. E, comparison of low cut ratio for dominant cone (Dom) and non-dominant cone (Non-dom) in three eccentricity ranges. F, relation of low cut ratio to RG gain. Dotted line shows linear regression for cells with low cut ratio <1; slope = 1.01, y-intercept = −0.47.
Spatial antagonism is evident as low-frequency roll-off in the spatial tuning curve, and can be characterized by a single number termed ‘low cut ratio’ (Forte et al. 2005). The low cut ratio is the response to the lowest spatial frequency divided by the response to the optimal spatial frequency. Its value varies between zero (indicating that responses are completely attenuated at low frequencies) and one (indicating that the tuning function is low pass). Figure 8E shows that while PC cells in the fovea show low-pass spatial tuning for the dominant cone input (low cut ratio, 0.90 ± 0.19, mean ± SD; n = 35), there is more substantial spatial antagonism in mid-peripheral and peripheral cohorts (mid-peripheral low cut ratio, 0.60 ± 0.26, n = 34; peripheral low cut ratio 0.60 ± 0.25, n = 27; P < 0.01, Kruskal–Wallis non-parametric analysis of variance for three groups). The same trend is present for the non-dominant cone (fovea low cut ratio, 0.85 ± 0.27, mean ± SD, n = 35; mid-peripheral low cut ratio, 0.58 ± 0.39, n = 34; peripheral low cut ratio, 0.57 ± 0.35, n = 27, P < 0.01, Kruskal–Wallis non-parametric analysis of variance for three groups).
Figure 8F shows that low-pass spatial characteristic for the dominant cone is associated with high RG gain. Furthermore, for those cells showing bandpass spatial tuning (low cut ratio below unity) the log RG gain is positively correlated with the low cut ratio (correlation coefficient 0.52, P < 0.01). There is substantial scatter in the data, and only a small part of the variance is accounted for (r2 = 0.27). The data nevertheless allow the conclusion that in peripheral visual field both cone types contribute to centre and surround; in other words, the centre excitation of a given (M or L) cone type is likely to be antagonized by contribution of the same cone type to the surround (see also Solomon et al. 2005; Buzás et al. 2006). These data show that the fundamental centre–surround structure of PC receptive fields is preserved on transition from a dichromatic to a trichromatic cone array. In foveal PC cells, the surround is relatively weak, meaning that responses are dominated by the cone type that dominates the centre mechanism. In peripheral PC cells, the surround is relatively strong, meaning that in trichromatic marmosets the contribution of the same (M or L) cone type to both centre and surround is manifest as low frequency roll-off in the spatial frequency tuning curves for cone-selective stimuli.
Comparison of spatial tuning in dichromats and trichromats
The results outlined above show that responses of foveal PC cells are only weakly attenuated by low-frequency cone-selective gratings. It could be argued that this result implies cone-selective wiring to PC cell surrounds in the fovea, but the result would also be expected under the random wiring with functional bias model, if the surround per se is weaker in the fovea. We therefore compared spatial tuning properties for R + G modulation in dichromatic and trichromatic marmosets. This experiment also tests the possibility that strong surrounds are present in the fovea but are masked by optical blur. The results are shown in Fig. 9. Pooled results for dichromatic and trichromatic phenotypes are shown in Fig. 9A and B. Cells with centre radius below 0.05 deg are distinguished in these plots. It can be seen from Fig. 9B that cells with small centre radii show a wide variance in low cut ratio. Thus, low-pass spatial tuning in the fovea is not simply attributable to optical blur. Furthermore, the pooled population shows eccentricity-dependent increase in low-frequency attenuation (correlation coefficient − 0.46, P < 0.01, r2 = 0.21). Specific comparison of results from dichromatic and trichromatic phenotypes (Fig. 9C) revealed no consistent difference below 8 deg eccentricity (dichromats, 0.68 ± 0.19, mean ± SD, n = 25; trichromats, 0.68 ± 0.22, n = 64; P = 0.95, Wilcoxon's unpaired test) or above 8 deg eccentricity (dichromats, 0.51 ± 0.16, n = 15; trichromats, 0.42 ± 0.16, n = 17; P = 0.14, Wilcoxon's unpaired test).
Figure 9. Spatial tuning in PC populations.
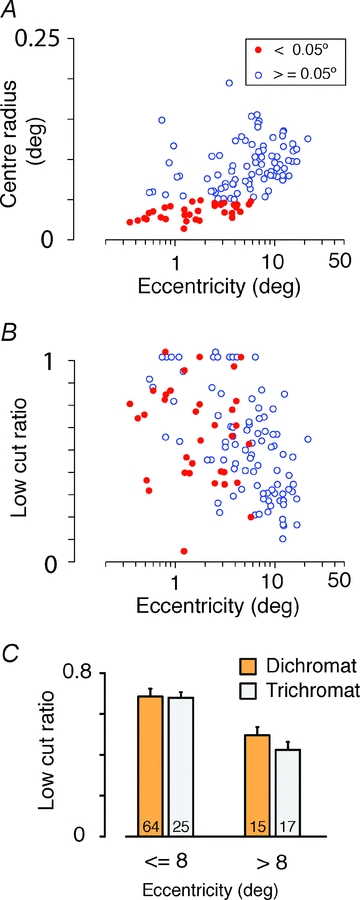
Parameters were estimated from DOG fits to response amplitude for luminance (L + M) gratings. Pooled data from dichromatic and trichromatic phenotypes are shown. A, receptive field centre radius. Cells with radius below 0.05 deg are restricted to the central 10 deg eccentricity. B, low cut ratio. Note variation of low cut ratio among cells with small receptive fields, and eccentricity-dependent increase in low cut ratio. C, comparison of low cut ratio in dichromatic and trichromatic phenotypes.
Finally, we compared receptive field radius in dichromatic and trichromatic phenotypes. We constructed closely matched samples by drawing from the trichromatic data set the receptive field with the closest eccentricity to each receptive field in the dichromatic data set, in the range 4–20 deg eccentricity. Over this range, the mean receptive field centre radius in the trichromatic data set (0.083 ± 0.030, mean ± SD; n = 31) was ∼20% smaller than the mean radius for the dichromatic data set (0.103 ± 0.027, n = 31; P < 0.01, Wilcoxon's unpaired test). This result could be interpreted to mean that there is a systematic increase in spatial acuity of PC receptive fields in trichromatic marmosets. Post hoc comparison, however, revealed that the difference is more likely to be due to individual variation. Case MY107 (Δ7 nm trichromatic female) showed smaller centre radius than the dichromatic male case MY97, whereas there were no significant differences between other animals (post hoc comparison, Kruskal–Wallis non-parametric analysis of variance). Finally, for trichromatic phenotypes no difference was seen on comparing receptive field centre radius for cells dominated by M or L cones (P = 0.2, Wilcoxon's unpaired test). Measured radii were overall consistent with previous studies at the relevant eccentricity range (Kremers & Weiss, 1997; Solomon et al. 2002; Blessing et al. 2004; but see also Kilavik et al. 2003). We conclude that low-pass spatial tuning in foveal PC cells is not a consequence of specific wiring for chromatic selectivity, and that acuity of PC receptive fields is not reduced by expression of distinct L and M cone pigments.
Discussion
Our data support the hypothesis that in trichromatic monkeys, colour signals appear as an additional response dimension without influencing high spatial acuity signals in the PC pathway. Firstly (consistent with previous studies), we find that expression of distinct M and L cone pigments in marmoset retina produces red–green opponent colour signals in PC cells. Secondly, we show that the amplitude of these responses is roughly proportional to the spectral separation of M and L cones. Thirdly, we show that the origin of red–green responses is in centre–surround antagonism, not in evolution of a specific subset of colour-coding cells. Finally, we find almost complete overlap of PC cell populations on spatial tuning parameters when dichromatic and trichromatic phenotypes are compared.
In the present study of PC cells, we did not see evidence for a distinct population of type II cells (Wiesel & Hubel, 1966; Dreher et al. 1976; Zrenner & Gouras, 1983; Calkins & Sterling, 1999). Rather, we found continuous variation in receptive field dimensions and cone weights in trichromatic marmosets, and responses of PC cells to luminance modulation were indistinguishable between dichromatic and trichromatic marmosets. As outlined below, our results rather suggest that distinct colour and spatial signals could be reconstructed from population activity of a single functional channel rather than by specialized subpopulations of PC cells.
Comparison of dichromatic and trichromatic individuals is not feasible in macaque monkeys, because the prevalence of dichromatic macaques is very low (Onishi et al. 1999; Jacobs, 2008). Available evidence, however, shows that (apart from colour-vision polymorphism) the similarities between macaque and marmoset PC cells outweigh the differences. The majority of red–green opponent cells in macaques show spatial and spectral opponency (Wiesel & Hubel, 1966; Dreher et al. 1976; Derrington et al. 1984; but see also Reid & Shapley, 2002). Where measured, the red–green opponent cells have smaller receptive fields than blue-on/yellow-off cells, and the proportion of opponent cells falls with increasing visual field eccentricity (Zrenner & Gouras, 1983; Solomon et al. 2005; Tailby et al. 2008). What we show here that is new is that these changes in red–green sensitivity can be largely explained by changes in spatial tuning that are common to dichromatic and trichromatic visual systems.
In a recent study, Crook et al. (2011) recorded from midget-PC pathway ganglion cells in macaque retina in vitro, during pharmacological blockade of inhibition from outer or inner retina. They showed that the inhibitory surround is preserved during blockade of synaptic transmission (as expected if horizontal cell activity in outer retina creates the surround). This result refutes our previous speculation (Buzás et al. 2006) that cone-biased PC cell surrounds are formed by the inner retina. Consistent with the present study, Crook et al. (2011) showed a broad range of M:L cone weights to centre and surround, as expected under random wiring. Their data also showed a negative correlation between centre and surround cone weights (r2≈−0.2; data from Fig. 1F in Crook et al. 2011), indicating functional bias of cone weight. Our previous analysis in PC cells in marmoset lateral geniculate nucleus showed a substantially stronger negative correlation between centre and surround cone weights (r2 = −0.79; data from Fig. 8A of Buzás et al. 2006). Thus, there is stronger functional bias in marmoset lateral geniculate nucleus than in macaque retina. Whether this difference in functional bias reflects a species difference, arises from differences in methodology or analysis, or is a result of biased wiring at the level of the lateral geniculate nucleus is not clear.
The proposal that PC cells carry both acuity and colour signals has a long and controversial history (Dreher et al. 1976; Ingling & Martinez-Uriegas, 1985; Rodieck, 1991; Wässle & Boycott, 1991; Lee et al. 2010). Much attention has focused on comparing PC cells with cells in the magnocellular (MC) division of the retinogeniculate pathway (Derrington & Lennie, 1984; Blakemore & Vital-Durand, 1986; Kaplan & Shapley, 1986; Crook et al. 1987; Lee et al. 1988; Reid & Shapley, 2002). Cells in the MC pathway do share many properties (including high spatial acuity at low image contrasts) with the human photometric Vλ luminosity channel (Lee et al. 2007; but see also Lennie et al. 1993 for alternative views). Behavioural evidence that the PC pathway contributes to high-acuity vision at high image contrasts is, however, strong (Schiller et al. 1990; Lynch et al. 1992), suggesting that the Vλ luminosity channel may not be the only psychophysical channel supporting high-acuity vision. Indeed, the radically alternative view that the PC pathway exists solely to support red–green colour vision is a priori inadmissible for ‘red–green colour-blind’ (dichromatic) and ‘completely colour-blind’ (monochromatic) monkeys and humans.
We find that individual PC cells respond to both luminance and chromatic variation, yet these distinct stimuli produce distinct patterns of response across the PC cell population. Previous proposals hypothesize distinct anatomical connections with input signal streams as the basis for generating spatial and chromatic channels in visual cortex (Lennie & D'Zmura, 1988; Shapley & Hawken, 2002). Our data suggest that response timing across the input populations could be a basis for generating anatomically selective connections. For example, specific patterns of connections could develop by neural plastic processes, which are well documented in cerebral cortex (Singer, 1995). A compatible model for phase-of-firing encoding, and demonstration of theoretical utility of timing information, was recently proposed for cortical networks (Montemurro et al. 2008). Our analysis of phase coherence (Fig. 3) gives support to these ideas by showing how expression of distinct M and L cone pigments yields a reliably coherent response across the PC population for chromatic stimuli. The question of whether naturalistic stimuli likewise produce such distinct firing patterns has not been tested in the present study, but measurements of cone contrasts in natural scenes include the range where we see coherent activity in opponent PC populations (Ruderman et al. 1998; van Hateren et al. 2002).
Johnson et al. (2004), in recordings from primary visual cortex, showed spatially tuned simple cells that also respond to red–green modulation. This may be the natural inheritance from PC cells with red–green luminance multiplexing (Shapley & Hawken, 2002). On the other hand, there are consistent reports of a small population comprising chromatically sensitive cells which show low-pass spatial tuning (Ts'o & Gilbert, 1988; Lennie et al. 1990; DeValois et al. 2000; Conway, 2001; Johnson et al. 2004; Solomon & Lennie, 2005). Combination of spatially adjacent pairings of units is one hypothetical means to generate selective fields of this nature.
From an evolutionary point of view, our results are consistent with primordial specialization of the PC pathway for high-acuity spatial vision at high image contrast. Transmission of red–green colour signals is enhanced by subtle changes in synaptic weights to centre–surround receptive fields, rather than overt anatomical rewiring in early stages of visual pathways. Inherent flexibility of cortical circuits may then be invoked as the substrate for extracting information about spectral reflectance from diverse input streams. Recent demonstrations that adding a new receptor type yields new colour vision capacity in mice and monkeys are consistent with this idea (Jacobs et al. 2007; Mancuso et al. 2009).
Acknowledgments
We thank A. Lara and D. Matin for technical assistance; T. FitzGibbon and P. Jusuf for assistance with recordings; and B. Dreher, U. Grünert and C. Tailby for helpful comments and discussion. This work was supported by Australian NHMRC grant 253621 and Australian Research Council grant A00104053.
Glossary
Abbreviations
- L
long
- M
medium
- PC
parvocellular
- S
short
Author contributions
Experiments were conceived and designed by E.B., J.F. and P.M. Data were collected, interpreted and analysed by all authors. The article was drafted by E.B. and P.M. and revised critically for important intellectual content by all authors. All authors have approved the final version of the manuscript. Experiments were performed at the National Vision Research Institute of Australia.
Authors' present addresses
P. Buzás: Institute of Physiology, Medical School, University of Pécs, Pécs H-7642, Hungary.
B. A. Szmajda: Department of Ophthalmology-Research, Northwestern University, Chicago 60611, USA.
References
- Blakemore C, Vital-Durand F. Organization and post-natal development of the monkey's lateral geniculate nucleus. J Physiol. 1986;380:453–491. doi: 10.1113/jphysiol.1986.sp016297. [DOI] [PMC free article] [PubMed] [Google Scholar]
- Blessing EM, Solomon SG, Hashemi-Nezhad M, Morris BJ, Martin PR. Chromatic and spatial properties of parvocellular cells in the lateral geniculate nucleus of the marmoset (Callithrix jacchus) J Physiol. 2004;557:229–245. doi: 10.1113/jphysiol.2003.058065. [DOI] [PMC free article] [PubMed] [Google Scholar]
- Bowmaker JK, Jacobs GH, Mollon JD. Polymorphism of photopigments in the squirrel monkey: a sixth phenotype. Proc R Soc Lond B Biol Sci. 1987;231:383–390. doi: 10.1098/rspb.1987.0051. [DOI] [PubMed] [Google Scholar]
- Boycott BB, Wässle H. Morphological classification of bipolar cells of the primate retina. Eur J Neurosci. 1991;3:1069–1088. doi: 10.1111/j.1460-9568.1991.tb00043.x. [DOI] [PubMed] [Google Scholar]
- Brainard DH. Cone contrast and opponent modulation color spaces. In: Kaiser PK, Boynton GM, editors. Human Color Vision. Washington, DC: Optical Society of America; 1996. pp. 563–577. [Google Scholar]
- Buzás P, Blessing EM, Szmajda BA, Martin PR. Specificity of M and L cone inputs to receptive fields in the parvocellular pathway: random wiring with functional bias. J Neurosci. 2006;26:11 148–11 161. doi: 10.1523/JNEUROSCI.3237-06.2006. [DOI] [PMC free article] [PubMed] [Google Scholar]
- Calkins DJ, Schein SJ, Tsukamoto Y, Sterling P. M and L cones in macaque fovea connect to midget ganglion cells by different numbers of excitatory synapses. Nature. 1994;371:70–72. doi: 10.1038/371070a0. [DOI] [PubMed] [Google Scholar]
- Calkins DJ, Sterling P. Evidence that circuits for spatial and color vision segregate at the first retinal synapse. Neuron. 1999;24:313–321. doi: 10.1016/s0896-6273(00)80846-6. [DOI] [PubMed] [Google Scholar]
- Conway BR. Spatial structure of cone inputs to color cells in alert macaque primary visual cortex (V-1) J Neurosci. 2001;21:2768–2783. doi: 10.1523/JNEUROSCI.21-08-02768.2001. [DOI] [PMC free article] [PubMed] [Google Scholar]
- Conway BR, Chatterjee S, Field GD, Horwitz GD, Johnson EN, Koida K, Mancuso K. Advances in color science: from retina to behavior. J Neurosci. 2010;30:14 955–14 963. doi: 10.1523/JNEUROSCI.4348-10.2010. [DOI] [PMC free article] [PubMed] [Google Scholar]
- Croner LJ, Kaplan E. Receptive fields of P and M ganglion cells across the primate retina. Vision Res. 1995;35:7–24. doi: 10.1016/0042-6989(94)e0066-t. [DOI] [PubMed] [Google Scholar]
- Crook JM, Lee BB, Tigwell DA, Valberg A. Thresholds to chromatic spots of cells in the macaque geniculate nucleus as compared to detection sensitivity in man. J Physiol. 1987;392:193–211. doi: 10.1113/jphysiol.1987.sp016776. [DOI] [PMC free article] [PubMed] [Google Scholar]
- Crook JD, Manookin MB, Packer OS, Dacey DM. Horizontal cell feedback without cone type-selective inhibition mediates “red–green” color opponency in midget ganglion cells of the primate retina. J Neurosci. 2011;31:1762–1772. doi: 10.1523/JNEUROSCI.4385-10.2011. [DOI] [PMC free article] [PubMed] [Google Scholar]
- Derrington AM, Krauskopf J, Lennie P. Chromatic mechanisms in lateral geniculate nucleus of macaque. J Physiol. 1984;357:241–265. doi: 10.1113/jphysiol.1984.sp015499. [DOI] [PMC free article] [PubMed] [Google Scholar]
- Derrington AM, Lennie P. Spatial and temporal contrast sensitivities of neurones in lateral geniculate nucleus of macaque. J Physiol. 1984;357:219–240. doi: 10.1113/jphysiol.1984.sp015498. [DOI] [PMC free article] [PubMed] [Google Scholar]
- DeValois RL, Cottaris NP, Elfar SD, Mahon LE, Wilson JA. Some transformations of color information from lateral geniculate nucleus to striate cortex. Proc Natl Acad Sci USA. 2000;97:4997–5002. doi: 10.1073/pnas.97.9.4997. [DOI] [PMC free article] [PubMed] [Google Scholar]
- Diller L, Packer OS, Verweij J, McMahon MJ, Williams DR, Dacey DM. L and M cone contributions to the midget and parasol ganglion cell receptive fields of macaque monkey retina. J Neurosci. 2004;24:1079–1088. doi: 10.1523/JNEUROSCI.3828-03.2004. [DOI] [PMC free article] [PubMed] [Google Scholar]
- Dreher B, Fukada Y, Rodieck RW. Identification, classification and anatomical segregation of cells with X-like and Y-like properties in the lateral geniculate nucleus of Old-World primates. J Physiol. 1976;258:433–452. doi: 10.1113/jphysiol.1976.sp011429. [DOI] [PMC free article] [PubMed] [Google Scholar]
- Enroth-Cugell C, Robson J. The contrast sensitivity of retinal ganglion cells of the cat. J Physiol. 1966;187:517–552. doi: 10.1113/jphysiol.1966.sp008107. [DOI] [PMC free article] [PubMed] [Google Scholar]
- Forte J, Peirce JW, Kraft JM, Krauskopf J, Lennie P. Residual eye-movements in macaque and their effects on visual responses of neurons. Vis Neurosci. 2002;19:31–38. doi: 10.1017/s0952523801191030. [DOI] [PubMed] [Google Scholar]
- Forte JD, Blessing EM, Buzás P, Martin PR. Contribution of chromatic aberrations to color signals in the primate visual system. J Vision. 2006;6:97–105. doi: 10.1167/6.2.1. [DOI] [PubMed] [Google Scholar]
- Forte JD, Hashemi-Nezhad M, Dobbie WJ, Dreher B, Martin PR. Spatial coding and response redundancy in parallel visual pathways of the marmoset Callithrix jacchus. Vis Neurosci. 2005;22:479–491. doi: 10.1017/S0952523805224094. [DOI] [PubMed] [Google Scholar]
- Frishman LJ, Freeman AW, Troy JB, Schweitzer-Tong DE, Enroth-Cugell C. Spatiotemporal frequency responses of cat retinal ganglion cells. J Gen Physiol. 1987;89:599–628. doi: 10.1085/jgp.89.4.599. [DOI] [PMC free article] [PubMed] [Google Scholar]
- Goodchild AK, Ghosh KK, Martin PR. Comparison of photoreceptor spatial density and ganglion cell morphology in the retina of human, macaque monkey, cat, and the marmoset Callithrix jacchus. J Comp Neurol. 1996;366:55–75. doi: 10.1002/(SICI)1096-9861(19960226)366:1<55::AID-CNE5>3.0.CO;2-J. [DOI] [PubMed] [Google Scholar]
- Hunt DM, Williams AJ, Bowmaker JK, Mollon JD. Structure and evolution of the polymorphic photopigment gene of the marmoset. Vision Res. 1993;33:147–154. doi: 10.1016/0042-6989(93)90153-n. [DOI] [PubMed] [Google Scholar]
- Ingling CR, Martinez-Uriegas E. The spatio-temporal properties of the r-g cell channel. Vision Res. 1985;25:33–38. doi: 10.1016/0042-6989(85)90077-x. [DOI] [PubMed] [Google Scholar]
- Jacobs GH. Primate color vision: a comparative perspective. Vis Neurosci. 2008;25:619–633. doi: 10.1017/S0952523808080760. [DOI] [PubMed] [Google Scholar]
- Jacobs GH, Williams GA, Cahill H, Nathans J. Emergence of novel color vision in mice engineered to express a human cone photopigment. Science. 2007;315:1723–1725. doi: 10.1126/science.1138838. [DOI] [PubMed] [Google Scholar]
- Johnson EN, Hawken MJ, Shapley R. Cone inputs in macaque primary visual cortex. J Neurophysiol. 2004;91:2501–2514. doi: 10.1152/jn.01043.2003. [DOI] [PubMed] [Google Scholar]
- Jusuf PR, Martin PR, Grünert U. Synaptic connectivity in the midget-parvocellular pathway of primate retina. J Comp Neurol. 2006a;494:260–274. doi: 10.1002/cne.20804. [DOI] [PubMed] [Google Scholar]
- Jusuf PR, Martin PR, Grünert U. Random wiring in the midget pathway of primate retina. J Neurosci. 2006b;26:3908–3917. doi: 10.1523/JNEUROSCI.4891-05.2006. [DOI] [PMC free article] [PubMed] [Google Scholar]
- Kaplan E, Shapley RM. The primate retina contains two types of ganglion cells, with high and low contrast sensitivity. Proc Natl Acad Sci USA. 1986;83:2755–2757. doi: 10.1073/pnas.83.8.2755. [DOI] [PMC free article] [PubMed] [Google Scholar]
- Kilavik BE, Silveira LC, Kremers J. Centre and surround responses of marmoset lateral geniculate neurones at different temporal frequencies. J Physiol. 2003;546:903–919. doi: 10.1113/jphysiol.2002.027748. [DOI] [PMC free article] [PubMed] [Google Scholar]
- Kremers J, Silveira LC, Kilavik BE. Influence of contrast on the responses of marmoset lateral geniculate cells to drifting gratings. J Neurophysiol. 2001;85:235–246. doi: 10.1152/jn.2001.85.1.235. [DOI] [PubMed] [Google Scholar]
- Kremers J, Weiss S. Receptive field dimensions of lateral geniculate cells in the common marmoset (Callithrix jacchus) Vision Res. 1997;37:2171–2181. doi: 10.1016/s0042-6989(97)00041-2. [DOI] [PubMed] [Google Scholar]
- Lamb TD. Photoreceptor spectral sensitivities: common shape in the long-wavelength region. Vision Res. 1995;35:3083–3091. doi: 10.1016/0042-6989(95)00114-f. [DOI] [PubMed] [Google Scholar]
- Lankheet MJM, Lennie P, Krauskopf J. Distinctive characteristics of subclasses of red-green P-cells in LGN of macaque. Vis Neurosci. 1998;15:37–46. doi: 10.1017/s0952523898151027. [DOI] [PubMed] [Google Scholar]
- Lee BB, Kremers J, Yeh T. Receptive fields of primate retinal ganglion cells studied with a novel technique. Vis Neurosci. 1998;15:161–175. doi: 10.1017/s095252389815112x. [DOI] [PubMed] [Google Scholar]
- Lee BB, Martin PR, Grünert U. Retinal connectivity and primate vision. Prog Ret Eye Res. 2010;29:622–639. doi: 10.1016/j.preteyeres.2010.08.004. [DOI] [PMC free article] [PubMed] [Google Scholar]
- Lee BB, Martin PR, Valberg A. The physiological basis of heterochromatic flicker photometry demonstrated in the ganglion cells of the macaque retina. J Physiol. 1988;404:323–347. doi: 10.1113/jphysiol.1988.sp017292. [DOI] [PMC free article] [PubMed] [Google Scholar]
- Lee BB, Sun H, Zucchini W. The temporal properties of the response of macaque ganglion cells and central mechanisms of flicker detection. J Vis. 2007;7:1–16. doi: 10.116/7.14.1. [DOI] [PMC free article] [PubMed] [Google Scholar]
- Lennie P, D'Zmura M. Mechanisms of color vision. Crit Rev Neurobiol. 1988;3:333–400. [PubMed] [Google Scholar]
- Lennie P, Haake PW, Williams DR. The design of chromatically opponent receptive fields. In: Landy MS, Movshon JA, editors. Computational Models of Visual Processing. Cambridge, MA: MIT Press; 1991. pp. 71–82. [Google Scholar]
- Lennie P, Krauskopf J, Sclar G. Chromatic mechanisms in striate cortex of macaque. J Neurosci. 1990;10:649–669. doi: 10.1523/JNEUROSCI.10-02-00649.1990. [DOI] [PMC free article] [PubMed] [Google Scholar]
- Lennie P, Pokorny J, Smith VC. Luminance. J Opt Soc Am A. 1993;10:1283–1293. doi: 10.1364/josaa.10.001283. [DOI] [PubMed] [Google Scholar]
- Lenth RV. Java applets for power and sample size, V1.63. 2006. http://www.stat.uiowa.edu/~rlenth/Power.
- Lynch JJ, III, Silveira LCL, Perry VH, Merigan WH. Visual effects of damage to P ganglion cells in macaques. Vis Neurosci. 1992;8:575–583. doi: 10.1017/s0952523800005678. [DOI] [PubMed] [Google Scholar]
- Mancuso K, Hauswirth WW, Li Q, Connor TB, Kuchenbecker JA, Mauck MC, Neitz J, Neitz M. Gene therapy for red–green colour blindness in adult primates. Nature. 2009;461:784–787. doi: 10.1038/nature08401. [DOI] [PMC free article] [PubMed] [Google Scholar]
- Martin PR, Blessing EM, Buzás P, Forte JD. Eccentricity dependence of chromatic sensitivity in marmoset parvocellular neurons. Invest Ophthalmol (ARVO abstracts) 2009 program no. 3473. [Google Scholar]
- Mechler F, Ringach DL. On the classification of simple and complex cells. Vision Res. 2002;42:1017–1033. doi: 10.1016/s0042-6989(02)00025-1. [DOI] [PubMed] [Google Scholar]
- Mollon JD, Bowmaker JK, Jacobs GH. Variations of colour vision in a New World primate can be explained by polymorphism of retinal photopigments. Proc R Soc Lond B Biol Sci. 1984;222:373–399. doi: 10.1098/rspb.1984.0071. [DOI] [PubMed] [Google Scholar]
- Montemurro MA, Rasch MJ, Murayama Y, Logothetis NK, Panzeri S. Phase-of-firing coding of natural visual stimuli in primary visual cortex. Curr Biol. 2008;18:375–380. doi: 10.1016/j.cub.2008.02.023. [DOI] [PubMed] [Google Scholar]
- Mullen KT, Kingdom FAA. Losses in peripheral colour sensitivity predicted from ‘hit and miss’ post-receptoral cone connections. Vision Res. 1996;36:1995–2000. doi: 10.1016/0042-6989(95)00261-8. [DOI] [PubMed] [Google Scholar]
- Nathans J. The evolution and physiology of human color vision: insights from molecular genetic studies of visual pigments. Neuron. 1999;24:299–312. doi: 10.1016/s0896-6273(00)80845-4. [DOI] [PubMed] [Google Scholar]
- Onishi A, Koike S, Ida M, Imai H, Shichida Y, Takenaka O, Hanazawa A, Konatsu H, Mikami A, Goto S, Suryobroto B, Kitahara K, Yamamori T. Dichromatism in macaque monkeys. Nature. 1999;402:139–140. doi: 10.1038/45966. [DOI] [PubMed] [Google Scholar]
- Paulus W, Kröger-Paulus A. A new concept of retinal colour coding. Vision Res. 1983;23:529–540. doi: 10.1016/0042-6989(83)90128-1. [DOI] [PubMed] [Google Scholar]
- Perry VH, Cowey A. The ganglion cell and cone distributions in the monkey's retina: implications for central magnification factors. Vision Res. 1985;25:1795–1810. doi: 10.1016/0042-6989(85)90004-5. [DOI] [PubMed] [Google Scholar]
- Reid RC, Shapley RM. Space and time maps of cone photoreceptor signals in macaque lateral geniculate nucleus. J Neurosci. 2002;22:6158–6175. doi: 10.1523/JNEUROSCI.22-14-06158.2002. [DOI] [PMC free article] [PubMed] [Google Scholar]
- Rodieck RW. Which cells code for color? In: Valberg A, Lee BB, editors. From Pigments to Perception: Advances in Understanding Visual Processes. London: Plenum Press; 1991. pp. 83–93. [Google Scholar]
- Ruderman DL, Cronin TW, Chiao C-C. Statistics of cone responses to natural images: implications for visual coding. J Opt Soc Am A. 1998;15:2036–2045. [Google Scholar]
- Schiller PH, Logothetis NK, Charles ER. Role of the color-opponent and broad-band channels in vision. Vis Neurosci. 1990;5:321–346. doi: 10.1017/s0952523800000420. [DOI] [PubMed] [Google Scholar]
- Shapley R, Hawken M. Neural mechanisms for color perception in the primary visual cortex. Curr Opin Neurobiol. 2002;12:426–432. doi: 10.1016/s0959-4388(02)00349-5. [DOI] [PubMed] [Google Scholar]
- Shapley R, Perry VH. Cat and monkey retinal ganglion cells and their visual functional roles. Trends Neurosci. 1986;9:229–235. [Google Scholar]
- Singer W. Development and plasticity of cortical processing architectures. Science. 1995;270:758–764. doi: 10.1126/science.270.5237.758. [DOI] [PubMed] [Google Scholar]
- Smith VC, Lee BB, Pokorny J, Martin PR, Valberg A. Responses of macaque ganglion cells to the relative phase of heterochromatically modulated lights. J Physiol. 1992;458:191–221. doi: 10.1113/jphysiol.1992.sp019413. [DOI] [PMC free article] [PubMed] [Google Scholar]
- Solomon SG, Lee BB, White AJ, Rüttiger L, Martin PR. Chromatic organization of ganglion cell receptive fields in the peripheral retina. J Neurosci. 2005;25:4527–4539. doi: 10.1523/JNEUROSCI.3921-04.2005. [DOI] [PMC free article] [PubMed] [Google Scholar]
- Solomon SG, Lennie P. Chromatic gain controls in visual cortical neurons. J Neurosci. 2005;25:4779–4792. doi: 10.1523/JNEUROSCI.5316-04.2005. [DOI] [PMC free article] [PubMed] [Google Scholar]
- Solomon SG, White AJR, Martin PR. Extra-classical receptive field properties of parvocellular, magnocellular and koniocellular cells in the primate lateral geniculate nucleus. J Neurosci. 2002;22:338–349. doi: 10.1523/JNEUROSCI.22-01-00338.2002. [DOI] [PMC free article] [PubMed] [Google Scholar]
- Szmajda BA, Buzás P, FitzGibbon T, Martin PR. Geniculocortical relay of blue-off signals in the primate visual system. Proc Natl Acad Sci USA. 2006;103:19 512–19 517. doi: 10.1073/pnas.0606970103. [DOI] [PMC free article] [PubMed] [Google Scholar]
- Tailby C, Dobbie WJ, Hashemi-Nezhad M, Forte JD, Martin PR. Receptive field asymmetries produce color-dependent direction selectivity in primate lateral geniculate nucleus. J Vision. 2010;10:1–18. doi: 10.1167/10.8.1. [DOI] [PubMed] [Google Scholar]
- Tailby C, Solomon SG, Lennie P. Functional asymmetries in visual pathways carrying S-cone signals in macaque. J Neurosci. 2008;28:4078–4087. doi: 10.1523/JNEUROSCI.5338-07.2008. [DOI] [PMC free article] [PubMed] [Google Scholar]
- Telkes I, Lee SC, Jusuf PR, Grünert U. The midget-parvocellular pathway of marmoset retina: a quantitative light microscopic study. J Comp Neurol. 2008;510:539–549. doi: 10.1002/cne.21813. [DOI] [PubMed] [Google Scholar]
- Tovée MJ, Bowmaker JK, Mollon JD. The relationship between cone pigments and behavioural sensitivity in a New World monkey (Callithrix jacchus jacchus) Vision Res. 1992;32:867–878. doi: 10.1016/0042-6989(92)90029-i. [DOI] [PubMed] [Google Scholar]
- Travis DS, Bowmaker JK, Mollon JD. Polymorphism of visual pigments in a callitrichid monkey. Vision Res. 1988;28:481–490. doi: 10.1016/0042-6989(88)90170-8. [DOI] [PubMed] [Google Scholar]
- Troilo D, Howland HC, Judge SJ. Visual optics and retinal cone topography in the common marmoset (Callithrix jacchus) Vision Res. 1993;33:1301–1310. doi: 10.1016/0042-6989(93)90038-x. [DOI] [PubMed] [Google Scholar]
- Ts'o DY, Gilbert CD. The organization of chromatic and spatial interactions in the primate striate cortex. J Neurosci. 1988;8:1712–1727. doi: 10.1523/JNEUROSCI.08-05-01712.1988. [DOI] [PMC free article] [PubMed] [Google Scholar]
- van Hateren JH, Ruttiger L, Sun H, Lee BB. Processing of natural temporal stimuli by macaque retinal ganglion cells. J Neurosci. 2002;22:9945–9960. doi: 10.1523/JNEUROSCI.22-22-09945.2002. [DOI] [PMC free article] [PubMed] [Google Scholar]
- Victor JD, Blessing EM, Forte J, Buzás P, Martin PR. Response variability of marmoset parvocellular neurons. J Physiol. 2007;579:29–51. doi: 10.1113/jphysiol.2006.122283. [DOI] [PMC free article] [PubMed] [Google Scholar]
- Wässle H, Boycott BB. Functional architecture of the mammalian retina. Physiol Rev. 1991;71:447–480. doi: 10.1152/physrev.1991.71.2.447. [DOI] [PubMed] [Google Scholar]
- Wässle H, Grünert U, Martin PR, Boycott BB. Immunocytochemical characterization and spatial distribution of midget bipolar cells in the macaque monkey retina. Vision Res. 1994;34:561–579. doi: 10.1016/0042-6989(94)90013-2. [DOI] [PubMed] [Google Scholar]
- Webb BS, Tinsley CJ, Vincent CJ, Derrington AM. Spatial distribution of suppressive signals outside the classical receptive field in lateral geniculate nucleus. J Neurophysiol. 2005;94:1789–1797. doi: 10.1152/jn.00826.2004. [DOI] [PubMed] [Google Scholar]
- White AJR, Solomon SG, Martin PR. Spatial properties of koniocellular cells in the lateral geniculate nucleus of the marmoset Callithrix jacchus. J Physiol. 2001;533:519–535. doi: 10.1111/j.1469-7793.2001.0519a.x. [DOI] [PMC free article] [PubMed] [Google Scholar]
- Wiesel TN, Hubel D. Spatial and chromatic interactions in the lateral geniculate body of the rhesus monkey. J Neurophysiol. 1966;29:1115–1156. doi: 10.1152/jn.1966.29.6.1115. [DOI] [PubMed] [Google Scholar]
- Wilder HD, Grünert U, Lee BB, Martin PR. Topography of ganglion cells and photoreceptors in the retina of a New World monkey: the marmoset Callithrix jacchus. Vis Neurosci. 1996;13:335–352. doi: 10.1017/s0952523800007586. [DOI] [PubMed] [Google Scholar]
- Yamada ES, Silveira LCL, Gomes FL, Lee BB. The retinal ganglion cell classes of New World primates. Rev Brasil Biol. 1996;56:381–396. [PubMed] [Google Scholar]
- Yeh T, Lee BB, Kremers J, Cowing JA, Hunt DM, Martin PR, Troy JB. Visual responses in the lateral geniculate nucleus of dichromatic and trichromatic marmosets (Callithrix jacchus) J Neurosci. 1995;15:7892–7904. doi: 10.1523/JNEUROSCI.15-12-07892.1995. [DOI] [PMC free article] [PubMed] [Google Scholar]
- Zrenner E, Gouras P. Cone opponency in tonic ganglion cells and its variation with eccentricity in rhesus monkey retina. In: Mollon JD, Sharpe LT, editors. Colour Vision: Physiology and Psychophysics. London: Academic Press; 1983. pp. 211–223. [Google Scholar]