

Non-technical summary
The mechanism underlying the plateau or relative decrease in cerebral blood flow during maximal incremental dynamic exercise remains unclear. We show that during graded dynamic exercise, the regulation of internal carotid artery blood flow was limited by a large increase in external carotid artery blood flow, one function of which is thermoregulation during heavy exercise. The mechanism of the plateau or decrease in internal carotid artery blood flow appears to be partly due to exercise-induced redistribution of arterial blood flow to the head and brain.
Abstract
Abstract
The mechanism underlying the plateau or relative decrease in cerebral blood flow (CBF) during maximal incremental dynamic exercise remains unclear. We hypothesized that cerebral perfusion is limited during high-intensity dynamic exercise due to a redistribution of carotid artery blood flow. To identify the distribution of blood flow among the arteries supplying the head and brain, we evaluated common carotid artery (CCA), internal carotid artery (ICA), external carotid artery (ECA) and vertebral artery (VA) blood flow during dynamic exercise using Doppler ultrasound. Ten subjects performed graded cycling exercise in a semi-supine position at 40, 60 and 80% of peak oxygen uptake ( ) for 5 min at each workload. The ICA blood flow increased by 23.0 ± 4.6% (mean ± SE) from rest to exercise at 60%
  . However, at 80%
  , ICA blood flow returned towards near resting levels (9.6 ± 4.7%vs. rest). In contrast, ECA, CCA and VA blood flow increased proportionally with workload. The change in ICA blood flow during graded exercise was correlated with end-tidal partial pressure of CO2 (r = 0.72). The change in ICA blood flow from 60%
  to 80%
  was negatively correlated with the change in ECA blood flow (r = −0.77). Moreover, there was a significant correlation between forehead cutaneous vascular conductance and ECA blood flow during exercise (r = 0.79). These results suggest that during high-intensity dynamic exercise the plateau or decrease in ICA blood flow is partly due to a large increase in ECA blood flow, which is selectively increased to prioritize thermoregulation.
Introduction
Increases in cerebral blood flow (CBF) are an important means of meeting the metabolic demands of cerebral neuronal activation during dynamic exercise (Ide & Secher, 2000; Querido & Sheel, 2007; Secher et al. 2008; Ogoh & Ainslie, 2009). Indeed, during mild-to-moderate exercise intensity, increases in cerebral metabolism are paralleled by increases in internal carotid artery (ICA) blood flow (Helström et al. 1996; Sato & Sadamoto, 2010) and middle cerebral artery (MCA) mean blood flow velocity (MCA  ) (Querido & Sheel, 2007; Ogoh & Ainslie, 2009). In contrast, during heavy dynamic exercise (>60% of peak oxygen uptake;
  ) ICA blood flow plateaus or even decreases towards resting values while cerebral metabolism remains high (Ide & Secher, 2000; Secher et al. 2008). Such observations indicate that during heavy exercise, increases in brain neuronal activity and metabolism are not matched with increases in CBF and that a compensatory increase in uptake (a–v difference) of lactate, glucose and oxygen occurs in order to support the elevated brain neural activity and metabolism (Ide & Secher, 2000; Secher et al. 2008).
The mechanisms underlying the uncoupling of CBF and cerebral metabolism during heavy dynamic exercise are unclear, but potential factors include a hyperventilation-induced decrease in partial pressure of arterial carbon dioxide ( ) (Nybo & Nielsen, 2001; Nybo et al. 2002; Rasmussen et al. 2006; Ainslie & Duffin, 2009) or high exercise-induced sympathetic nerve activation (Ogoh & Ainslie, 2009). However, aside from such global factors, other local haemodynamic factors may also contribute. Indeed, we have recently demonstrated that vertebral artery (VA) blood flow does not plateau, and continues to increase from moderate- to heavy-intensity exercise (Sato & Sadamoto, 2010). Helström et al. (1996) reported that common carotid artery (CCA) blood flow continuously increased during graded dynamic exercise despite the decrease in ICA blood flow at heavy exercise. This finding suggests that heavy exercise causes a large increase in external carotid artery (ECA) blood flow because CCA branches into the ECA and ICA at the carotid bifurcation. Therefore, a large increase in ECA blood flow may be a contributory factor for the decrease in ICA blood flow during heavy exercise.
Given this background, the aim of the present study was to examine how the relative contribution made by the different cerebral arteries (CCA, ICA, ECA, VA and MCA) providing blood flow to the head and brain changes during graded cycle exercise. We hypothesized that ECA blood flow is selectively increased during heavy exercise to prioritize thermoregulation, and this results in a relative reduction in ICA blood flow. To test our hypothesis, we evaluated the distribution of CCA blood flow to ICA and ECA during graded cycle exercise using Doppler ultrasound.
Methods
Subjects and ethical approval
Ten healthy non-athletic subjects (5 men and 5 women; mean ± SD): 24 ± 5 years, 165 ± 8 cm, 55 ± 8 kg and  : 46.2 ± 7.2 ml kg min−1) participated in this study. Subjects were non-obese, normotensive and free from overt cardiovascular, pulmonary, metabolic and neurological disease. Subjects were moderately active non-smokers, who were not taking any medications. Written informed consent was obtained according to the Ethics Committee of the Japan Women's College of Physical Education (no. 2010-6). The study was conducted in accordance with the principles of the Declaration of Helsinki.
 measurement
 was determined using an incremental protocol on a cycle ergometer (Aerobike 800; Combi, Japan) 1 week before the main experiments. Subjects were exposed to an initial work rate of 30 W at a pedal rate of 60 revolutions min−1. The subjects were told to maintain the frequency of pedalling, and work rate was increased 15–20 W every minute until volitional exhaustion. Respiratory variables were determined using a breath-by-breath system (ARCO-2000; Arco System, Japan); gas fractions were analysed by a mass spectrometer; and expired gas volume was measured by a Fleisch pneumotachometer. The highest value obtained for
  over a 60 s interval was taken as
  .
.
Main experimental exercise protocols
Blood flow was measured in four cerebral arteries (i.e. ECA, ICA, CCA and VA: Fig. 1). It was impossible to simultaneously evaluate blood flow in ipsilateral cerebral arteries due to the technical limitations of Doppler ultrasound e.g. insufficient space at neck and interference between Doppler beams from multiple probes. Therefore, in order to make all the required cerebral blood flow measurements, all subjects performed the main experimental protocol twice. During the first exercise bout, left ICA blood flow, right VA blood flow and right MCA blood flow velocity were simultaneously measured, along with cardiorespiratory variables. During the second exercise bout, left ECA blood flow and right CCA blood flow were simultaneously measured. For each exercise bout, subjects were seated on a cycle ergometer (EC-3700; Cateye, Japan) in a semi-supine position with a backrest inclination of ∼40 deg. To avoid body and neck movement during dynamic exercise, the upper body was restrained by shoulder straps and a waist belt attached to the cycle frame; the head and neck were also held in a stable position by a padded head rest (Fig. 1). The protocol consisted of a 3 min baseline period, followed by exercise at workloads corresponding to 40%, 60% and 80%  with each stage lasting 5 min. Exercise bouts were carried out in a thermoneutral laboratory environment (22–23°C).
Figure 1. Subject and probe placement positions during semi-supine cycle exercise and ultrasound Doppler screens while CCA, ICA, ECA and VA blood flow are measured at 80%  in one subject.
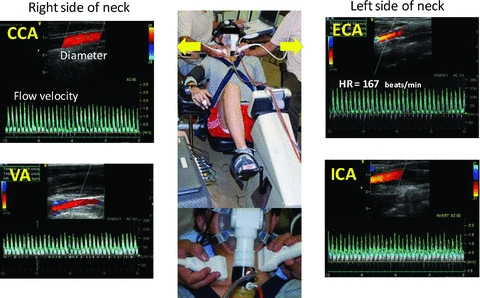
CCA, common carotid artery; VA, vertebral artery; ICA, internal carotid artery; ECA, external carotid artery.
Cerebral blood flow measurement by Doppler ultrasound
CBF was continuously measured at rest and during exercise for 1 min between the fourth and fifth minute in each workload. The representative CBF values at each workload stage are the average of all 1 min recordings. During the first exercise bout, the left ICA blood flow and right VA blood flow were measured simultaneously with two colour-coded ultrasound systems (Vivid-7 Pro for ICA and Vivid-e for VA; GE Yokogawa Medical Systems, Japan) equipped with a 10 MHz linear transducer. ICA measurements were performed ∼1.0–1.5 cm distal to the carotid bifurcation on the left ICA while the subject's chin was slightly elevated (Fig. 1). VA was measured between the transverse processes of the C3 and subclavian artery.
During the second exercise bout, the left ECA and right CCA were measured simultaneously with the same Doppler ultrasound systems mentioned above (Vivid-7 Pro for ECA and Vivid-e for CCA). These measurements were generally taken ∼1.0–1.5 cm above the carotid bifurcation on the left ECA and ∼1.5 cm below the carotid bifurcation on the right CCA. For all CBF measurements, we first used the brightness mode to measure the mean vessel diameter of each vessel in a longitudinal section, and the Doppler velocity spectrum was subsequently identified by pulsed wave mode. In detail, the systolic and diastolic diameters were measured, and then the mean diameter (cm) was calculated in relation to the blood pressure curve: mean diameter = [(systolic diameter × 1/3)]+[(diastolic diameter × 2/3)]. The time-averaged mean flow velocity obtained in pulsed wave mode was defined as the mean blood flow velocity (m s−1). The measurements of blood flow velocity were made from the average of ∼10–20 cardiac cycles to eliminate the effects caused by the breathing cycle. When making blood flow velocity measurements, care was taken to ensure that the probe position was stable, that the insonation angle did not vary (∼60 deg in most cases), and that the sample volume was positioned in the centre of the vessel and adjusted to cover the width of the vessel diameter. Finally, blood flow was calculated by multiplying the cross-sectional area (π× (mean diameter/2)2) with mean blood flow velocity; Blood flow = mean blood flow velocity × area × 60 (ml min−1). All CBF measurements were performed by the same two operators (Sato et al. 2009; Sato & Sadamoto, 2010).
Before the main experiment it was confirmed that there were no significant differences in baseline blood flow between the left and right ECA, ICA, CCA and VA. However, the left VA tended to have a larger blood flow than the right VA (Schöning et al. 1994). In the pilot study, we conducted a test–retest experiment to confirm the reproducibility of CBF measurements at rest and during moderate dynamic exercise (∼60–70%  ), and the coefficient of variation was as follows: ECA blood flow, 5.1 ± 1.0% (mean ± SEM) at rest and 5.5 ± 1.2% during moderate exercise; ICA, 5.1 ± 1.0% at rest and 5.3 ± 0.7% during moderate exercise; CCA, 4.5 ± 0.9% at rest and 4.9 ± 1.0% during moderate exercise; VA, 5.1 ± 0.9% at rest and 6.2 ± 0.6% during moderate exercise.
MCA  was measured by transcranial Doppler ultrasonography (WAKI; Atys Medical, France). A 2 MHz Doppler probe was adjusted over the temporal window of the right MCA until an optical signal was identified. The probe was then fixed and held in place using a headband strap.
Cardiorespiratory measures
Relative change (%) in skin blood flow at the forehead (SBF) was measured by laser Doppler flowmetry using an integrating flow probe (ALF21, Advance, Japan). Heart rate (HR) was continuously monitored using a 3-lead electrocardiogram (Radercirc; Dainippon Sumitomo Pharmacology, Japan). Systolic and diastolic arterial pressures were measured using a cuff sphygmomanometer (Radercirc) and mean arterial pressure (MAP) was calculated as [(2 × diastolic pressure) + systolic pressure]/3. In addition, beat-by-beat blood pressure was acquired using finger photoplethysmography from the middle or index finger of the right hand (Finometer; Finapres Medical Systems BV, the Netherlands). Furthermore, stroke volume and cardiac output (CO) were determined from the blood pressure waveform by the Modelflow software program, which incorporates gender, age, height and weight (Beat Scope 1.1; Finapres Medical Systems BV). This method provides a reliable estimate of changes in stroke volume and CO in healthy humans from rest to submaximal exercise (Sugawara et al. 2003). Respiratory variables were determined as described for  , and end-tidal partial pressure of CO2 (
 ) was measured. Cardiorespiratory variables during exercise were averaged over the last 1 min of each workload.
Data processing and statistics
The ratio of blood flow to MAP in each cerebral artery was used to calculate local cerebrovascular conductance, and an index of cerebrovascular conductance was also calculated from the ratio of MCA  to MAP. To estimate forehead cutaneous vascular conductance, SBF was divided by MAP.
Global CBF (gCBF) was calculated as the sum of the blood flow in the ICA and VA [(ICA blood flow + VA blood flow) × 2 (ml min−1)]. Moreover, total blood flow to head ( ) was also calculated by following formula: [(CCA blood flow + VA blood flow) × 2 (ml min−1)]. The proportion of CO distributed to the head was calculated as [
  /CO × 100 (%)] at rest and during exercise.
Values are expressed as means ± SEM. Differences between corresponding values at rest and at each workload were evaluated by analysis of variance (ANOVA) with repeated measures, followed by Tukey's post hoc test (SPSS12.0; SPSS, Japan). Pearson product moment was used for correlation analyses. P < 0.05 was considered to be a significant difference.
Results
The cardiorespiratory and cerebrovascular responses to graded dynamic exercise are shown in Table 1 and Fig. 2.  , HR, MAP, stroke volume and CO increased with workload (P < 0.01).
  was also elevated during exercise (P < 0.01 vs. rest); however,
  was significantly lower during exercise at 80%
  than at 60%
  (43.2 ± 1.0 vs. 48.1 ± 0.8 mmHg, respectively; P < 0.01). Forehead SBF moderately increased from rest to 60%
  (P < 0.01), while SBF was markedly increased from 60%
  to 80%
  (from 129 ± 27 to 295 ± 45%; P < 0.01). Forehead cutaneous vascular conductance was significantly increased from rest at 60% and 80%
  (185 ± 37% at 80%
  ; P < 0.01).
Table 1.
Cardiorespiratory and cerebrovascular variables at rest and during graded dynamic exercise
| Rest | 40% 
|
60% 
|
80% 
|
|
|---|---|---|---|---|
| Cardiorespiratory responses | ||||
 (ml kg−1 min−1) (ml kg−1 min−1) |
4.3 ± 0.1 | 17.5 ± 1.3† | 28.2 ± 1.9†‡ | 40.1 ± 1.9†‡ |
| HR (beats min−1) | 63 ± 2 | 107 ± 3† | 140 ± 3†‡ | 172 ± 2†‡ |
| MAP (mmHg) | 87 ± 2 | 103 ± 2† | 114 ± 3 † | 122 ± 4† |
| Stroke volume (%) | 0 | 21 ± 7† | 29 ± 8†‡ | 28 ± 8† |
| CO (%) | 0 | 105 ± 9† | 185 ± 12*‡ | 250 ± 19*‡ |
 (mmHg) (mmHg) |
39.0 ±0.6 | 47.1 ± 1.4† | 48.1 ± 0.8† | 43.2 ± 1.0*‡ |
| Forehead SBF (%) | 0 | 24 ± 6* | 129 ± 27†‡ | 295 ± 45†‡ |
| Forehead CVC (%) | 0 | 4 ± 5 | 76 ±24†‡ | 185 ±37†‡ |
| Cerebrovascular responses | ||||
| ECA blood flow (ml min−1) | 129 ± 12 | 163 ± 10* | 183 ± 12† | 238 ± 13†‡ |
| Diameter (cm) | 0.38 ± 0.01 | 0.39 ± 0.01 | 0.40 ± 0.01 | 0.40 ± 0.01 |
| Blood flow velocity (cm s−1) | 19.6 ± 1.6 | 24.2 ± 1.9* | 25.6 ± 2.2† | 31.8 ± 2.2†‡ |
| ICA blood flow (ml min−1) | 239 ± 14 | 280 ± 14* | 291 ± 16† | 258 ± 13‡ |
| Diameter (cm) | 0.42 ± 0.01 | 0.42 ± 0.01 | 0.42 ± 0.01 | 0.42 ± 0.01 |
| Blood flow velocity (cm s−1) | 28.4 ± 1.3 | 33.7 ± 1.3* | 34.4 ± 1.6† | 30.4 ± 1.0‡ |
| CCA blood flow (ml min−1) | 363 ± 18 | 420 ± 14* | 463 ±20† | 500 ±31† |
| Diameter (cm) | 0.52 ± 0.01 | 0.53 ± 0.01 | 0.54 ± 0.01 | 0.54 ± 0.01 |
| Blood flow velocity (cm s−1) | 28.5 ± 1.0 | 31.3 ± 0.7* | 34.2 ± 1.0† | 35.9 ± 1.2† |
| VA blood f1ow (ml min−1) | 90 ± 12 | 117 ± 13* | 129 ± 12* | 144 ± 14† |
| Diameter (cm) | 0.31 ± 0.02 | 0.31 ± 0.02 | 0.31 ± 0.02 | 0.32 ± 0.02 |
| Blood flow velocity (cm s−1) | 20.1 ± 1.0 | 25.2 ± 2.5* | 27.8 ± 1.9† | 30.3 ± 2.0† |
MCA  (cm s−1) (cm s−1) |
53.1 ± 3.1 | 64.3 ± 4.9* | 68.6 ± 5.2* | 60.0 ± 4.1 |
Data are mean ± SEM;  , minute oxygen uptake per weight; HR, heart rate; MAP, mean arterial pressure; CO, cardiac output;
  , end-tidal partial pressure of CO2; SBF, skin blood flow; CVC, cutaneous vascular conductance; Diameter, mean diameter of each cerebral artery; Blood flow velocity, mean blood flow velocity of each cerebral artery
Different from rest (P < 0.05)
Different from rest (P < 0.01)
Different from previous workload (P < 0.05).
Figure 2. Change in cerebral blood flow (A) and cerebrovascular conductance (B) during graded dynamic exercise.
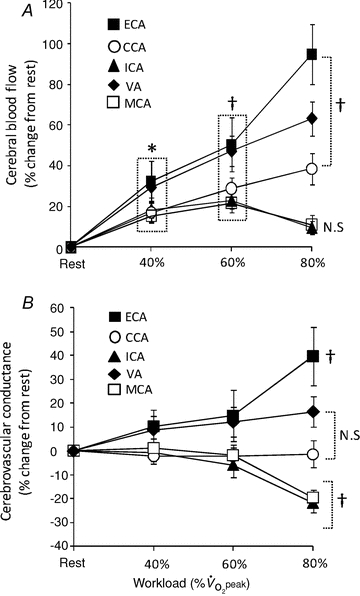
 , peak oxygen uptake; CCA, common carotid artery; VA, vertebral artery; ICA, internal carotid artery; ECA, external carotid artery; MCA, middle cerebral artery. Values are expressed as means ± SE. *Different from rest (P < 0.05). †Different from rest (P < 0.01).
The CCA and VA blood flow progressively increased from rest to 80%  by 38.6 ± 7.7% and 63.3 ± 8.4%, respectively (P < 0.01: Table 1 and Fig. 2A). At 60%
  , the ECA blood flow significantly increased by 50.5 ± 13.3% and further increased by 94.8 ± 14.9% at 80%
  (P < 0.01). In contrast, ICA blood flow increased from rest up to 60%
  (23.0 ± 4.6%): P < 0.01), but at 80%
  there was no significant difference in ICA blood flow compared to that observed at rest (9.6 ± 4.7%). There were no significant changes in the diameter of all measured vessels (CCA, ICA, ECA and VA) during graded exercise, as such increases in blood flow were attributable to increased mean blood flow velocities (Table 1). MCA
  followed a similar pattern to that of ICA blood flow during exercise. At 60%
  , MCA
, MCA  was significantly increased from rest (21.8 ± 4.1%; P < 0.01), but decreased from this level at 80%
  where it was 11.0 ± 3.3% above resting values. CCA conductance and VA conductance did not change throughout the exercise (Fig. 2B). However, with increasing exercise intensity, ECA conductance increased to 39.7 ± 12.1% at 80%
  (P < 0.01). In contrast, ICA and MCA conductance significantly decreased by –21.6 ± 4.2% and −19.4 ± 3.2% at 80%
  (P < 0.01), respectively.
The percentage changes in forehead cutaneous vascular conductance and ECA blood flow from rest to exercise were significantly correlated (r = 0.79, P < 0.01: Fig. 3A). The change in ICA blood flow was correlated with change in  (r = 0.72, P < 0.01: Fig. 3B). However, change in
  was not significantly correlated with CCA, ECA and VA blood flow during dynamic exercise. The change in CCA blood flow during exercise was significantly correlated with the change in VA blood flow (r = 0.79, P < 0.01: Fig. 3C). There was no significant correlation between ICA blood flow and VA blood flow from rest to exercise (Fig. 3D).
Figure 3. Relationship between change in ECA blood flow and forehead cutaneous vascular conductance (A),  and ICA blood flow (B), CCA blood flow and VA blood flow (C), and ICA blood flow and VA blood flow (D).
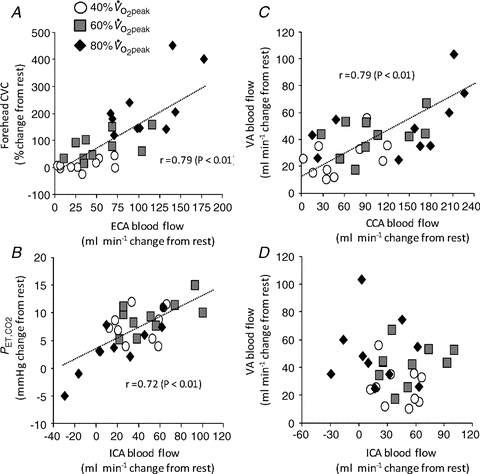
CVC, cutaneous vascular conductance;  , end-tidal partial pressure of CO2.
The absolute change (Δ) in ECA blood flow from 60%  to 80%
  was correlated with the relative change in forehead SBF (r = 0.82, P < 0.01: Fig. 4A). In addition, there was a significant correlation between ΔECA blood flow and ΔICA blood flow (r = −0.77, P < 0.01: Fig. 4B), and between ΔVA blood flow and ΔICA blood flow (r = −0.65, P < 0.05: Fig. 4C).
Figure 4. Relationship between individual change (Δ) in ECA blood flow from 60%  to 80%
  with ΔSKB (A) and ΔICA blood flow (B), and between ΔVA blood flow and ΔICA blood flow (C).
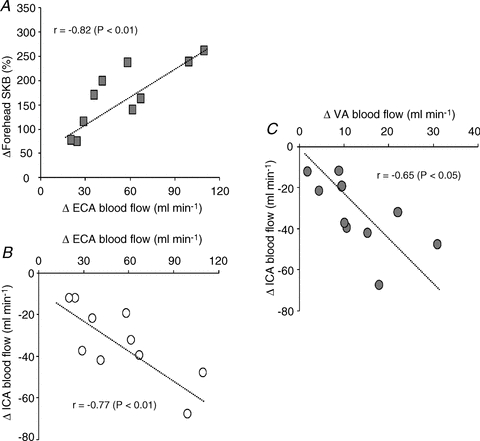
SKB, skin blood flow.
The relative contribution of CCA and VA blood flow to  did not change from rest to 80%
  (80% to 78% for CCA and 20% to 22% for VA: Fig. 5A). However, the distribution of CCA blood flow to ECA increased (35% to 48% from rest to 80%
  : Fig. 5B) while, conversely, the distribution of CCA to ICA fell (65% to 52% from rest to 80%
  ). In addition, the percentage contribution of VA blood flow to gCBF was 27 ± 3% and 36 ± 2% at rest and 80%
  , respectively, and these responses counteracted those of ICA to gCBF (73% to 64% from rest to 80%
  : Fig. 5C). At rest,
  accounted for 17.6 ± 1.1% of CO, but during exercise a progressive decrease in CO distribution to
  was observed: from 10.7 ± 0.7% at 40%
  to 7.1 ± 0.4% at 80%
  (P < 0.01: Fig. 5D).
Figure 5. The contribution of each cerebral artery blood flow to head (A), CCA blood flow (B), and brain (C) at rest and during graded exercise, and the change in the proportion of CO distributed to head, from rest to heavy exercise (D).
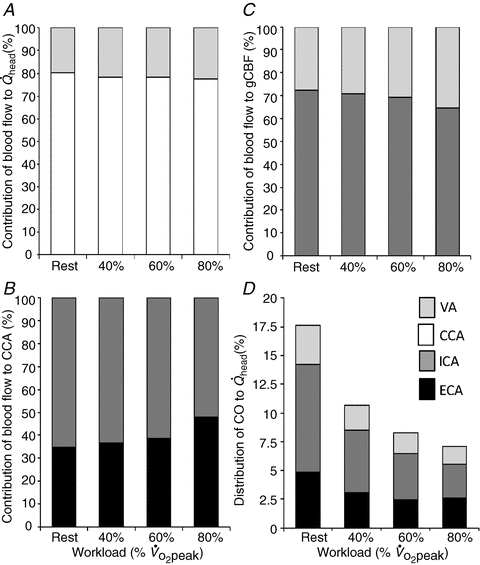
 , total blood flow to head; gCBF, global cerebral blood flow; CO, cardiac output.
Discussion
The major findings of this study were that an abrupt increase in ECA blood flow occurred from moderate- to high-intensity exercise, whereas the increase in ICA blood flow plateaued at moderate exercise, following which ICA blood flow significantly decreased during heavy exercise. The increase in ECA blood flow from moderate- to high-intensity exercise was negatively correlated with the decrease in ICA blood flow, indicating that a large increase in ECA blood flow significantly contributes to the decrease ICA blood flow observed during heavy exercise.
The observed plateau in ICA blood flow during moderate-intensity exercise and the subsequent decrease towards resting values during high-intensity exercise (>60%  ) is consistent with previous reports (Helström et al. 1996; Sato & Sadamoto, 2010). We have extended these earlier investigations with the demonstration that ECA blood flow markedly increases up to 80%
  (94.8%) despite a decrease in ICA blood flow (Fig. 2A). These conflicting results are probably due to different responses of the vascular bed in the territories supplied by the ICA and ECA. The effect of sympathetic nerve activity on the regulation of CBF in humans remains controversial (van Lieshout & Secher, 2008). However, some previous studies have demonstrated that an increase in sympathetic nerve activity prevents forced dilatation of the cerebral arterioles with a resultant regional over-perfusion and breakdown of the blood–brain barrier (Bill & Linder, 1976; Heistad et al. 1978; Rutland et al. 1980; Patel et al. 2003). Therefore, the vascular bed in the ICA territory may not be increased by sympathoexcitation during heavy exercise in this study. Indeed, resistance exercise did not affect MCA
  despite an increase in MAP (Edwards et al. 2002). This finding indicates that intense exercise-induced cerebral vasoconstriction may prevent cerebral over-perfusion.
The ECA supplies blood to the face, anterior neck and cranium wall. It is likely that ECA blood flow is selectively increased for thermoregulatory purposes because there was a significant correlation between change in forehead cutaneous vascular conductance and ECA blood flow throughout exercise (Fig. 3A). Moreover, there is a positive relationship between increases in forehead SBF and ECA blood flow from moderate to heavy exercise (Fig. 4A), potentially reflecting a selective distribution of blood flow to the cutaneous circulation to aid heat dissipation during high-intensity exercise. The increase in forehead cutaneous vascular conductance and ECA conductance are indicative of peripheral vasodilatation in the face and/or cranium, probably induced by a combination of withdrawal of vasoconstrictor tone and enlistment of active vasodilatation as temperature rises during exercise (Rowell 1993). An increased ECA blood flow and SBF could also be directly observed as increased perspiration and reddish skin colour in the faces of our subjects during heavy exercise.
To date, no study has measured the blood flow in the ECA during exercise. However, there is evidence to suggest that blood flow in the ECA increases dramatically when the body temperature is elevated due to heat stress (Fan et al. 2008). Furthermore, an increase in forehead SBF has been shown to be significantly greater than SBF at the chest, forearm, thigh and back during dynamic exercise (Kondo et al. 1998). This suggests that brain and head thermoregulation are a high priority for CBF regulation during exercise, thus explaining the prioritization of ECA blood flow over ICA blood flow during high-intensity exercise. Furthermore, CBF is markedly reduced during exercise with hyperthermia, potentially indicative of a large increase in ECA blood flow for thermoregulatory purposes (Nybo & Nielsen, 2001; Nybo et al. 2002).
It is possible that the large increases in ECA blood flow we observed during exercise result from the plateau and subsequent reduction in ICA blood flow during high-intensity exercise. Indeed, the change in ECA blood flow from 60%  to 80%
  was negatively correlated with the change in ICA blood flow (Fig. 4B). Alternatively, previous studies suggested that the reduction in CBF during heavy exercise is attributable to a hyperventilation-induced reduction in
  (Nybo & Nielsen, 2001; Nybo et al. 2002; Rasmussen et al. 2006; Ainslie & Duffin, 2009) or high sympathetic nerve activity (Ogoh & Ainslie, 2009). Consistent with this possibility, we observed a significant relationship between
  and ICA blood flow (Fig. 3B). Although
  is a major contributory factor for CBF regulation, the distribution of carotid blood flow is one of the limiting factors for change in ICA blood flow during heavy exercise.
Irrespective of the underlying mechanisms, it is important to note that reductions in ICA blood flow are unlikely to restrict submaximal exercise performance under normal conditions, because the decreases in CBF may be compensated for by increases in lactate, glucose and oxygen uptake (increased a–v difference), thus sustaining exercise-induced increases in cerebral neuronal activity and metabolism (Ide & Secher, 2000; Secher et al. 2008). However, profound decreases in CBF during exhaustive exercise, particularly during conditions of high ambient temperature, may precipitate the development of so called ‘central fatigue’ (Nybo & Nielsen, 2001; Nybo et al. 2002; Dalsgaard et al. 2004).
Changes in CCA blood flow during exercise were significantly correlated with changes in VA blood flow (Fig. 3C). Also, CCA conductance and VA conductance did not change throughout the exercise. Moreover, the contributions of CCA and VA blood flow to  were unchanged throughout a graded exercise (Fig. 5A). These findings suggest that the contribution of systemic circulatory factors (i.e. MAP or CO) to CCA blood flow was not different from that to VA blood flow, or peripheral cerebrovascular regulation to CCA was not different from that to VA. Interestingly, the contribution of CCA blood flow to
  was well maintained throughout a graded exercise despite a change in the distribution of CCA blood flow to ECA and ICA (Fig. 5B). In addition, the contribution of ICA and VA blood flow to the gCBF varied during dynamic exercise (Fig. 5C), although the relative contribution of each arterial blood flow to the brain at rest is believed to be balanced in humans (Sato & Sadamoto, 2010). It is well known that anterior cerebral (carotid system) and posterior cerebral circulation (vertebro-basilar system) eventually communicate with each other via the anastomoses that form the circle of Willis: this interconnection with the circle of Willis protects cerebral perfusion when blood flow through the anterior cerebral circulation is reduced (Rowell, 1993). Thus, the large increase in VA blood flow during heavy exercise may compensate for the decline in ICA blood flow (Fig. 4C), yet ICA blood flow still accounted for the majority of cerebral perfusion during dynamic exercise. Alternatively, the present and previous studies indicate that cerebral CO2 reactivity at rest and during dynamic exercise may be down-regulated in the posterior cerebral circulation rather than in the anterior cerebral circulation (Sorond et al. 2005; Reinhard et al. 2008; Sato & Sadamoto, 2010).
The proportion of CO distributed to the head decreased from rest to exercise (Fig. 5D); this possibly reflects the increased proportion of CO redistributed to exercising muscle (Mortensen et al. 2008). Consequently, the proportion of CO distributed to the VA, ICA and ECA was gradually decreased during graded dynamic exercise. However, the decline in the proportion of CO distributed to the ICA was much larger than that to the VA or ECA. Collectively, our results indicate that the proportion of blood flow any single vessel to head and brain is not constant during graded dynamic exercise, and flow redistribution between major cerebral arteries occurs.
The present study has several limitations. One potential limitation is that we were unable to simultaneously measure ipsilateral blood flow in the ECA, ICA and CCA due to interference caused by the ultrasound beam. Since the sum of ICA and ECA blood flow at rest and during exercise are quantitatively matched to CCA blood flow, our CBF data were therefore reliable. Second, we did not measure SBF of the forehead in absolute units. We used laser Doppler flowmetry to estimate the relative change in SBF at the forehead to dynamic exercise. Although this method was used and validated in previous studies for estimation of flow changes in a cutaneous region, this technique has some acknowledged limitations, most notably the inability to provide quantitative measurements of SBF in absolute units (Johnson et al. 1984; Rowell 1993). Third, we did not measure oesophageal and/or scalp temperature during exercise. However, the rapid increase in ECA blood flow and the increase in ECA conductance accompanied the large increase in forehead SBF and cutaneous vascular conductance, one function of which is thermoregulation (Helström et al. 1996; Fan et al. 2008). Finally, the exercise in this study was performed in thermoneutral and normal conditions. The data from exercise with heat stress or under hyperthermic condition could have strengthened this study.
In summary, during graded dynamic exercise, the regulation of internal carotid artery blood flow was limited by a large increase in external carotid artery blood flow, one function of which is thermoregulation during heavy exercise. The mechanism of the plateau or decrease in internal carotid artery blood flow appears to be partly due to exercise-induced redistribution of arterial blood flow to the head and brain, and along with changes in arterial CO2, may be a major factor contributing to the regulation of CBF during dynamic exercise.
Acknowledgments
We appreciate the time and effort spent by our volunteer subjects in the present study. We especially thank Hiroyuiki Yamamoto (GE healthcare, Tokyo, Japan) for his expert technical assistance and Dr James P Fisher (University of Birmingham, Birmingham, UK) for his assistance in the preparation of this manuscript. This research was supported in part by a Grant-in-Aid for Scientific Research from the Japanese Ministry of Education, Science, Sports and Culture grant (no. 21700704 to K.S.).
Glossary
Abbreviations
- CBF
cerebral blood flow
- CCA
common carotid artery
- CO
cardiac output
- CVC
cutaneous vascular conductance
- ECA
external carotid artery
- gCBF
global cerebral blood flow
- HR
heart rate
- ICA
internal carotid artery
- MAP
mean arterial pressure
- MCA
middle cerebral artery
- MCA

MCA mean blood flow velocity

partial pressure of arterial carbon dioxide

end-tidal partial pressure of carbon dioxide

total blood flow to head
- SBF
forehead skin blood flow
- VA
vertebral artery

peak oxygen uptake
Author contributions
K.S. contributed to the conception and design of the experiment; S.O. drafted the article and revised it critically for intellectual content; A.H. contributed to data collection, analysis and interpretation; A.O. contributed to data collection, analysis and interpretation; T.S. contributed to conception and design of the experiment. All authors approved the final version.
References
- Ainslie PN, Duffin J. Integration of cerebrovascular CO2 reactivity and chemoreflex control of breathing: mechanisms of regulation, measurement, and interpretation. Am J Physiol Regul Integr Comp Physiol. 2009;296:R1473–R1495. doi: 10.1152/ajpregu.91008.2008. [DOI] [PubMed] [Google Scholar]
- Bill A, Linder J. Sympathetic control of cerebral blood flow in acute arterial hypertension. Acta Physiol Scand. 1976;96:114–121. doi: 10.1111/j.1748-1716.1976.tb10176.x. [DOI] [PubMed] [Google Scholar]
- Dalsgaard MK, Ogoh S, Dawson EA, Yoshiga CC, Quistorff B, Secher NH. Cerebral carbohydrate cost of physical exertion in humans. Am J Physiol Regul Integr Comp Physiol. 2004;287:R534–R540. doi: 10.1152/ajpregu.00256.2004. [DOI] [PubMed] [Google Scholar]
- Edwards MR, Martin DH, Hughson RL. Cerebral hemodynamics and resistance exercise. Med Sci Sports Exerc. 2002;34:1207–1211. doi: 10.1097/00005768-200207000-00024. [DOI] [PubMed] [Google Scholar]
- Fan JL, Cotter JD, Lucas RA, Thomas K, Wilson L, Ainslie PN. Human cardiorespiratory and cerebrovascular function during severe passive hyperthermia: effects of mild hypohydration. J Appl Physiol. 2008;105:433–445. doi: 10.1152/japplphysiol.00010.2008. [DOI] [PubMed] [Google Scholar]
- Heistad DD, Marcus ML, Gross PM. Effects of sympathetic nerves on cerebral vessels in dog, cat, and monkey. Am J Physiol Heart Circ Physiol. 1978;235:H544–H552. doi: 10.1152/ajpheart.1978.235.5.H544. [DOI] [PubMed] [Google Scholar]
- Helström G, Fischer-Colbrie W, Wahlgren NG, Jogestrand T. Carotid artery blood flow and middle cerebral artery blood flow velocity during physical exercise. J Appl Physiol. 1996;81:413–418. doi: 10.1152/jappl.1996.81.1.413. [DOI] [PubMed] [Google Scholar]
- Ide K, Secher NH. Cerebral blood flow and metabolism during exercise. Prog Neurobiol. 2000;61:397–414. doi: 10.1016/s0301-0082(99)00057-x. [DOI] [PubMed] [Google Scholar]
- Johnson JM, Taylor WF, Shepherd AP, Park MK. Laser-Doppler measurement of skin blood flow: comparison with plethysmography. J Appl Physiol. 1984;56:798–803. doi: 10.1152/jappl.1984.56.3.798. [DOI] [PubMed] [Google Scholar]
- Kondo N, Takano S, Aoki K, Shibasaki M, Tominaga H, Inoue Y. Regional differences in the effect of exercise intensity on thermoregulatory sweating and cutaneous vasodilation. Acta Physiol Scand. 1998;164:71–78. doi: 10.1046/j.1365-201X.1998.00407.x. [DOI] [PubMed] [Google Scholar]
-
Mortensen SP, Damsgaard R, Dawson EA, Secher NH, González-Alonso J. Restrictions in systemic and locomotor skeletal muscle perfusion, oxygen supply and
 during high-intensity whole-body exercise in humans. J Physiol. 2008;586:2621–2635. doi: 10.1113/jphysiol.2007.149401. [DOI] [PMC free article] [PubMed] [Google Scholar]
 - Nybo L, Moller K, Volianitis S, Nielsen B, Secher NH. Effects of hyperthermia on cerebral blood flow and metabolism during prolonged exercise in humans. J Appl Physiol. 2002;93:58–64. doi: 10.1152/japplphysiol.00049.2002. [DOI] [PubMed] [Google Scholar]
- Nybo L, Nielsen B. Middle cerebral artery blood velocity is reduced with hyperthermia during prolonged exercise in humans. J Physiol. 2001;534:279–286. doi: 10.1111/j.1469-7793.2001.t01-1-00279.x. [DOI] [PMC free article] [PubMed] [Google Scholar]
- Ogoh S, Ainslie PN. Cerebral blood flow during exercise: mechanisms of regulation. J Appl Physiol. 2009;107:1370–1380. doi: 10.1152/japplphysiol.00573.2009. [DOI] [PubMed] [Google Scholar]
- Patel S, Huang DL, Sagher O. Sympathetic mechanisms in cerebral blood flow alterations induced by spinal cord stimulation. J Neurosurg. 2003;99:754–761. doi: 10.3171/jns.2003.99.4.0754. [DOI] [PubMed] [Google Scholar]
- Querido JS, Sheel AW. Regulation of cerebral blood flow during exercise. Sports Med. 2007;37:765–782. doi: 10.2165/00007256-200737090-00002. [DOI] [PubMed] [Google Scholar]
- Rasmussen P, Stie H, Nielsen B, Nybo L. Enhanced cerebral CO2 reactivity during strenuous exercise in man. Eur J Appl Physiol. 2006;96:299–304. doi: 10.1007/s00421-005-0079-3. [DOI] [PubMed] [Google Scholar]
- Reinhard M, Waldkircher Z, Timmer J, Weiller C, Hetzel A. Cerebellar autoregulation dynamics in humans. J Cereb Blood Flow Metab. 2008;28:1605–1612. doi: 10.1038/jcbfm.2008.48. [DOI] [PubMed] [Google Scholar]
- Rowell LB. Human Cardiovascular Control: Control of Regional Blood Flow during Dynamic Exercise. New York: Oxford University Press; 1993. [Google Scholar]
- Rutland MD, Lee TY, Nimmon CC, Granowska M, Britton KE. Measurement of the effects of a single dose of prazosin on the cerebral blood flow in hypertensive patients. Postgrad Med J. 1980;56:818–822. doi: 10.1136/pgmj.56.662.818. [DOI] [PMC free article] [PubMed] [Google Scholar]
- Sato K, Moriyama M, Sadamoto T. Influence of central command on cerebral blood flow at the onset of exercise in women. Exp Physiol. 2009;94:1139–1146. doi: 10.1113/expphysiol.2009.048587. [DOI] [PubMed] [Google Scholar]
- Sato K, Sadamoto T. Different blood flow responses to dynamic exercise between internal carotid and vertebral arteries in women. J Appl Physiol. 2010;109:864–869. doi: 10.1152/japplphysiol.01359.2009. [DOI] [PubMed] [Google Scholar]
- Schöning M, Walter J, Scheel P. Estimation of cerebral blood flow through color duplex sonography of the carotid and vertebral arteries in healthy adults. Stroke. 1994;25:17–22. doi: 10.1161/01.str.25.1.17. [DOI] [PubMed] [Google Scholar]
- Secher NH, Seifirt T, Van Lieshout JJ. Cerebral blood flow and metabolism during exercise: implication for fatigue. J Appl Physiol. 2008;104:306–314. doi: 10.1152/japplphysiol.00853.2007. [DOI] [PubMed] [Google Scholar]
- Sorond FA, Khavari R, Serrador JM, Lipsitz LA. Regional cerebral autoregulation during orthostatic stress: age-related differences. J Gerontol A Biol Sci Med Sci. 2005;60:1484–1487. doi: 10.1093/gerona/60.11.1484. [DOI] [PMC free article] [PubMed] [Google Scholar]
- Sugawara J, Tanabe T, Miyachi M, Yamamoto K, Takahashi K, Iemitsu M, Otsuki T, Homma S, Maeda S, Ajisaka R, Matsuda M. Non-invasive assessment of cardiac output during exercise in healthy young humans: comparison between Modelflow method and Doppler echocardiography method. Acta Physiol Scand. 2003;179:361–366. doi: 10.1046/j.0001-6772.2003.01211.x. [DOI] [PubMed] [Google Scholar]
- van Lieshout JJ, Secher NH. Point: Counterpoint: Sympathetic activity does/does not influence cerebral blood flow. J Appl Physiol. 2008;105:1364–1366. doi: 10.1152/japplphysiol.90597.2008. [DOI] [PubMed] [Google Scholar]