

Non-technical summary
During prolonged high-intensity exercise the main fuel for muscular work is glycogen, the storage form of glucose in skeletal muscle. The role of muscle glycogen in muscle function is best demonstrated by the inability to sustain prolonged high-intensity exercise when the glycogen stores are depleted. Despite this knowledge, the reason why muscle function is depressed when glycogen levels are low is still not known. We show that after prolonged exhaustive exercise the depletion of glycogen stores is dependent on its localization within the muscle cells. These results show that consideration of distinct localizations within the muscle cells may advance understanding of how and why low muscle glycogen content impairs muscle function.
Abstract
Abstract
Although glycogen is known to be heterogeneously distributed within skeletal muscle cells, there is presently little information available about the role of fibre types, utilization and resynthesis during and after exercise with respect to glycogen localization. Here, we tested the hypothesis that utilization of glycogen with different subcellular localizations during exhaustive arm and leg exercise differs and examined the influence of fibre type and carbohydrate availability on its subsequent resynthesis. When 10 elite endurance athletes (22 ± 1 years,  = 68 ± 5 ml kg−1 min−1, mean ± SD) performed one hour of exhaustive arm and leg exercise, transmission electron microscopy revealed more pronounced depletion of intramyofibrillar than of intermyofibrillar and subsarcolemmal glycogen. This phenomenon was the same for type I and II fibres, although at rest prior to exercise, the former contained more intramyofibrillar and subsarcolemmal glycogen than the latter. In highly glycogen-depleted fibres, the remaining small intermyofibrillar and subsarcolemmal glycogen particles were often found to cluster in groupings. In the recovery period, when the athletes received either a carbohydrate-rich meal or only water the impaired resynthesis of glycogen with water alone was associated primarily with intramyofibrillar glycogen. In conclusion, after prolonged high-intensity exercise the depletion of glycogen is dependent on subcellular localization. In addition, the localization of glycogen appears to be influenced by fibre type prior to exercise, as well as carbohydrate availability during the subsequent period of recovery. These findings provide insight into the significance of fibre type-specific compartmentalization of glycogen metabolism in skeletal muscle during exercise and subsequent recovery.
Introduction
Glycogen, a branched glucose polymer, is the major reservoir of readily available energy in mammalian skeletal muscle and plays a profound role in muscle function demonstrated by the inability to sustain prolonged high-intensity exercise when the glycogen stores are depleted (Bergström et al. 1967; Hermansen et al. 1967). In spite of this fundamental finding of a temporal association between muscle glycogen content and muscle fatigue more than 40 years ago, the reason why muscle force output is depressed when glycogen levels are low is still not known (Allen et al. 2008). Important steps have been conducted elucidating heterogeneity in glycogen content of individual fibres from fatigued muscles (Essén, 1978) and fibre type-specific glycogen depletion depending on exercise intensity and duration (Vøllestad & Blom, 1985). This has revealed that a major proportion of the recruited fibres are almost completely depleted of glycogen at fatigue suggesting a role of energy deficiency in muscle fatigue.
The energy deficiency theory has been challenged, however, by both in vitro and in vivo studies demonstrating a strong association between low glycogen and muscle performance even after long-term recovery periods, where adenine nucleotide levels may be normalized (Bangsbo et al. 1992; Chin & Allen, 1997; Kabbara et al. 2000; Helander et al. 2002). Furthermore, experiments with amphibian mechanically skinned muscle fibres, where myoplasmic ATP and phosphocreatine are maintained high, have shown a correlation between glycogen content and the capacity to respond to T-system depolarizations (Stephenson et al. 1999), suggesting a mechanistic link between low glycogen and fatigue independent of myoplasmic energy level. Later, using mammalian skeletal muscle, these data have both been confirmed (Barnes et al. 2001) and disproven (Goodman et al. 2005), and moreover, refined by showing that the distribution of glycogen in distinct locations is of importance (Nielsen et al. 2009). The latter study showed that glycogen located inside the myofibrils (intramyofibrillar (Intra) glycogen) is related to the ability to maintain force output during repeated tetanic contractions indicating a role in excitability and/or sarcoplasmic reticulum (SR) Ca2+ release properties and that glycogen located between the myofibrils close to the longitudinal sarcoplasmic reticulum (intermyofibrillar (IMF) glycogen) is related to the half-relaxation time of an unfatigued tetanic contraction indicating a role in SR Ca2+ reuptake. These findings suggest that the role of glycogen in skeletal muscle is not related to bulk energy production.
The existence of a subcellular heterogeneity regarding glycogen storage has been recognized since the early days of electron microscopy (Wanson & Drochmans, 1968; Sjöström et al. 1982b; Fridén et al. 1985, 1989; Marchand et al. 2002). Most are clustered in the intermyofibrillar space close to the sarcoplasmic reticulum and mitochondria (IMF glycogen), while two minor fractions are found, respectively, between the contractile filaments inside the myofibrils (Intra glycogen) and in the subsarcolemmal space just beneath the fibre surface (SS glycogen). The utilization of these subfractions of glycogen during exercise has been examined by three observational studies; however, they report mixed results: while the first study (Sjöström et al. 1982b) described a preferential depletion of SS and IMF glycogen following prolonged exercise, the two later studies (Fridén et al. 1985, 1989) described a preferential depletion of Intra glycogen following sprint or prolonged exercise. This divergence is most likely related to the qualitative methods used. Recently, quantitative investigations have shown that after glycogen-depleting exercise Intra glycogen is preferentially resynthesized (Marchand et al. 2007), 2 weeks of muscle inactivity selectively lowers Intra glycogen by 50% (Nielsen et al. 2010b), and after 10 weeks of endurance training the elevation of SS glycogen is 5-fold greater than that of IMF and Intra glycogen (Nielsen et al. 2010a). Evidently, subfractions of glycogen are affected differently during muscle adaptations implying compartmentalized glycogen metabolism. However, little is known about the role of prolonged exhaustive exercise and muscle fibre phenotype.
The aim of the present study was to quantitatively estimate by unbiased stereological methods the content of glycogen in three subcellular locations (Intra, IMF and SS glycogen) in type I and II fibres of arm and leg skeletal muscle before, immediately after, and during recovery from 1 h of exhaustive arm and leg exercise. Furthermore, the influence of carbohydrate availability during the recovery period on the glycogen content in these three subcellular locations was evaluated. The hypothesis was that Intra glycogen would be preferentially depleted and subsequently resynthesized.
Methods
Ethical approval
The project was approved by the Regional Ethical Review Board in Umeå, Sweden (no. 07-076M). Before giving their written informed consent to participate, the subjects were fully informed about the project, the risks involved, discomfort associated with the experiment, and that they could withdraw from the project at any time. The experiments conformed to the standards set by the Declaration of Helsinki.
Subjects
Ten male elite cross country skiers participated in the study, which was part of a larger project (Ørtenblad et al. 2011). Their mean (± SD) age, height, weight, maximum oxygen uptake ( ), and haemoglobin concentration was 22 ± 1 years, 182 ± 8 cm, 80 ± 9 kg, 68 ± 5 ml kg−1 min−1, and 155 ± 8 g l−1, respectively. The skiers were selected from Norwegian elite skiers and had an average of 11 years of training.
Experimental protocol
The skiers performed a ∼20 km cross country skiing time trial (classic style) in an average finish time of 57 min (range: 52–63 min). Subjects performed individual warm-up and ski preparation before the race. Snow conditions and the race course favoured the diagonal stride technique and a high degree of double poling, i.e. upper body exercise.
After the race, the skiers were randomly divided into two groups: one group received a carbohydrate (CHO)-enriched meal within the first hour after exercise and one group refrained from consuming any calories were not permitted during the first 4 h. Both groups received a CHO-enriched diet in the subsequent 18 h. The CHO-enriched energy intake consisted of both liquid solutions and solid food allowing the skiers to receive at least 1 g CHO kg−1 h−1.
Muscle biopsies were taken from the arm and leg before (Pre), immediately after (Post), 4 h after (4 h) and 22 h after (22 h) the race. The Post biopsy was obtained immediately after (1–2 min) the skier had crossed the finish line. The biopsies were taken in a randomized order from the left- and right-hand side, with two biopsies in each arm and leg. All biopsies from individual subjects were taken by the same person to minimize any variation in the location and depth of the biopsy. After local anaesthesia (2–3 ml 2% lidocaine (lignocaine)), an incision was made through the skin and fascia and the muscle biopsy was taken from m. vastus lateralis (leg) and the distal part of the lateral head of m. triceps brachii (arm), using a modified Bergström needle with suction. These muscles were preferred because they are highly active during cross country skiing (Holmberg et al. 2005). One specimen of the muscle samples was frozen directly in liquid N2 and stored for later biochemical determination of muscle glycogen concentration; another specimen was fixed in glutaraldehyde for transmission electron microscopy analysis. The skiers were  tested in the laboratory within 2 weeks of the performance test, as described in detail elsewhere (Ørtenblad et al. 2011).
Biochemical determination of muscle glycogen
Muscles were frozen and later freeze-dried, dissected free of non-muscle tissue, powdered and extracted with perchloric acid as previously described (Harris et al. 1974). Muscle glycogen was analysed from a separate portion of the freeze-dried muscle according to Lowry & Passonneau(1972).
Transmission electron microscopy
Muscle biopsy specimens were prepared for enhanced glycogen visualization by transmission electron microscopy (TEM) as described previously (Nielsen et al. 2010a). In brief, specimens were fixed with a 2.5% glutaraldehyde in 0.1 m sodium cacodylate buffer (pH 7.3) for 24 h and subsequently rinsed four times in 0.1 m sodium cacodylate buffer. Following rinsing, muscle specimens were post-fixed with 1% osmium tetroxide (OsO4) and 1.5% potassium ferrocyanide (K4Fe(CN)6) in 0.1 m sodium cacodylate buffer for 90 min at 4°C. The use of reduced osmium tetroxide containing potassium ferrocyanide favours a high electron density of glycogen particles (De Bruijn, 1973). After post-fixation, the muscle specimens were rinsed twice in 0.1 m sodium cacodylate buffer at 4°C, dehydrated through a graded series of alcohol at 4–20°C, infiltrated with graded mixtures of propylene oxide and Epon at 20°C, and embedded in 100% Epon at 30°C. To obtain as many fibres as possible, the ultra-thin sections were cut (using a Leica Ultracut UCT ultramicrotome) in three depths separated by 150 μm. The sections were contrasted with uranyl acetate and lead citrate, and examined and photographed in a pre-calibrated Philips EM 208 electron microscope and a Megaview III FW camera.
In the sections from the three depths of each biopsy, all the longitudinally oriented fibres were included obtaining a mean of nine fibres per biopsy (range: 6–12). From each fibre, 24 images were obtained at ×40,000 magnifications in a randomized systematic order, including 12 from the SS region and 6 from both the superficial and central region of the myofibrillar space, as previously described (Nielsen et al. 2010b).
Fibre type differences were evaluated by classifying fibres as type I or II, based on a combination of IMF mitochondrial volume and Z-line width (Sjöström et al. 1982a). IMF mitochondrial volume fraction was plotted against Z-line width for all the fibres (n = 6–12) obtained from each biopsy. The fibres with the highest IMF mitochondrial volume fraction and thickest Z-line width were classified as type I fibres and vice versa for type II fibres. In order to identify the two main fibre types, all intermediate fibres were discarded and only distinct type I and II fibres were included (n = 2–3 fibres of each type per biopsy). Thus, the estimates of distinct localizations of glycogen (see below) are based on 2–3 fibres of each type per biopsy. This procedure generated two distinct groups of fibres, where the IMF mitochondria volume fraction and Z-line (nm) width were (mean ± SD) 0.11 ± 0.03 and 75 ± 6 of type I fibres and 0.05 ± 0.02 and 68 ± 5 of type II fibres, respectively. Thus, when fibres are referred to as type I or II throughout the present study it refers to clear distinctions in mitochondria content and Z-line width, the combination of which have previously been shown to relate to myofibrillar ATPase properties (Sjöström et al. 1982a).
All the analyses were conducted by three blinded investigators, where the images from the different time points and fibre types were distributed equally between investigators. Inter- and intra-investigator variability tests showed no signs of bias and low coefficients of variation (<8%) evaluated as proposed by Bland & Altman(1986).
The method for quantitative content estimation of TEM-defined subfractions of glycogen is described in detail elsewhere (Nielsen et al. 2010b). Briefly, three spatial localizations of glycogen were defined in: (i) the intermyofibrillar (IMF) space, (ii) the intramyofibrillar space (Intra, inside the myofibrils, between the contractile filaments), and (iii) the subsarcolemmal (SS) space (Fig. 4). The glycogen volume fraction (VV) in each location was estimated as proposed by Weibel (1980, their eqn (4.20)), taking the effect of section thickness into account: VV = AA−t((1/π)BA−NA((tH)/(t+H))), where AA is glycogen area fraction, t section thickness (60 nm), BA glycogen boundary length density, NA number of particles per area, and H is the average glycogen profile diameter. It was assumed that the particles were spherical (Melendez-Hevia et al. 1993). The glycogen area fraction was estimated by point counting and the average glycogen profile diameter was directly measured using iTEM (FEI Company, The Netherlands).
Figure 4. Representative TEM images of the subsarcolemmal (A and B) and myofibrillar (C and D) regions pre-exercise (A and C) and post (B and D) approximately 1 h of exhaustive exercise.
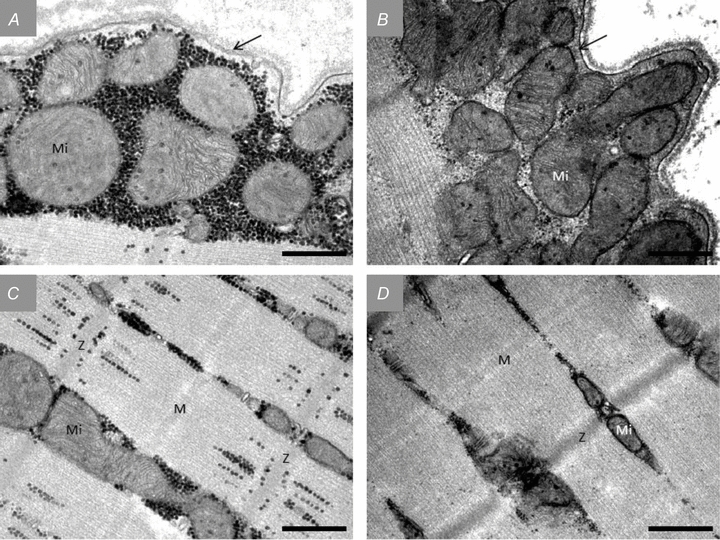
All images originate from an arm type I fibre. Glycogen is visualized as black dots. Mi, mitochondria; Z, Z-line; M, M-band. The arrows indicate the sarcolemma. Scale bar = 0.5 μm.
IMF glycogen content was expressed relative to the myofibrillar space (estimated by point counting), Intra glycogen was expressed relative to the intramyofibrillar space (estimated by point counting), and SS glycogen was expressed relative to the fibre surface (estimated by direct length measurements). The variation in the parameters between images was used to estimate a coefficient of error (CEest) as proposed for stereological ratio-estimates by Howard & Reed (2005). The CEest were 0.10, 0.12 and 0.17 in IMF, Intra and SS glycogen, respectively.
When the distribution of glycogen in IMF, Intra and SS fractions is expressed relative to the total content, the fibres were assumed to be of cylindrical shape with a diameter of 80 μm. Since IMF and Intra glycogen are expressed as volume densities and SS glycogen as volume per fibre surface area, total values were obtained by recalculating the SS glycogen to a volume density by the formula: volume beneath the surface area of a cylindrically shaped fibre (Vb) = R× 0.5 ×A, where R is fibre radius and A is the fibre surface area. There were both significant correlation and concordance between TEM-estimated total glycogen volume fraction and the biochemically determined glycogen concentration (r2 = 0.57, P < 0.0001,  , P < 0.0001).
Statistics
Statistical analyses were performed using Stata 10.1 (StataCorp. 2007; Stata Statistical Software: Release 10; StataCorp LP, College Station, TX, USA). All interactions or main effects were tested using a linear mixed-effects model with subjects, time and fibre as random effects and with time, group, fibre type and location as fixed effects. Variables with skewed distributions were log-transformed before analysis. Non-parametric tests were used as stated. Associations between variables were evaluated using Pearson's correlation coefficient and Lin's concordance correlation coefficient (Lin, 1989, 2000). Regarding glycogen resynthesis data, arm and leg data were pooled and treated as repeated measures. Values are presented as geometric means and 95% confidence intervals (CI), unless stated otherwise. Significance level was set at α = 0.05.
Results
Muscle glycogen concentration pre- and post-prolonged-exercise
The muscle glycogen concentrations can also be found in a companion paper (Ørtenblad et al. 2011). The mean (± SD) concentration (glycosyl units (kg dry wt)−1) decreased following the exercise to lower (P < 0.0001) levels in the arms (Pre: 540 ± 29, Post: 167 ± 27, P < 0.0001) compared to the corresponding values in the legs (Pre: 485 ± 15, Post: 331 ± 47, P < 0.001). After 4 h of recovery, the glycogen concentration increased when CHO was consumed (arm, 283 ± 16; leg, 418 ± 67, P = 0.05 vs. Post values), but remained low if no CHO had been previously consumed (arm, 162 ± 37; leg, 371 ± 51, P = 0.43 vs. Post values). After an additional 18 h of recovery, during which both groups received a CHO-rich diet, the glycogen concentrations were restored to pre-exercise levels and were not different between the CHO group (arm, 448 ± 58; leg, 475 ± 56, P = 0.45 vs. Pre values) and the no-CHO group (arm, 528 ± 44; leg, 468 ± 84, P = 0.48 vs. Pre values).
Fibre type-dependent subcellular glycogen distribution pre-exercise
The distribution of glycogen in distinct subcellular localizations was found to be highly dependent on fibre type, where type I fibres had 82% (46:127) (P < 0.0001) more intramyofibrillar and 31% (9:60) (P = 0.004) more subsarcolemmal glycogen than type II fibres (P < 0.0001). Contrarily, type II fibres showed a tendency to have 11% (−1:25) (P = 0.10) more intermyofibrillar glycogen than type I fibres (Fig. 1A–C). There was no difference in this fibre type-dependent distribution between arm and leg muscles (P = 0.96). Relative to the total glycogen content, the distribution of glycogen in type I fibres was 77% (76:79) in the intermyofibrillar region, 12% (11:13) in the intramyofibrillar region and 11% (9:12) in the subsarcolemmal region, where corresponding values of type II fibres were 84% (82:86), 8% (6:9) and 8% (7:9), respectively (Fig. 1D).
Figure 1. Fibre type-specific subcellular localization of glycogen.
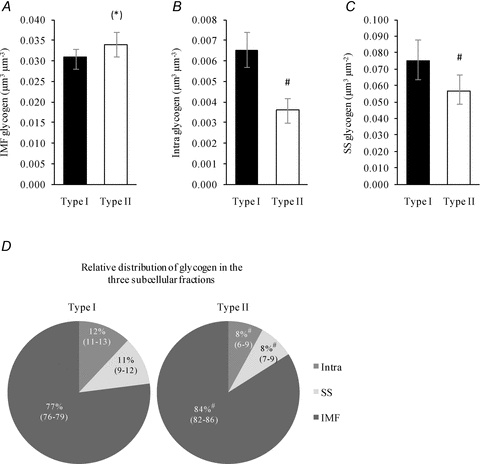
Type I (n = 59) and II fibres (n = 59) were collected from pre-exercise biopsies of skeletal muscles of the arm (m. triceps brachii) and leg (m. vastus lateralis). A, IMF glycogen. B, Intra glycogen. C, SS glycogen. D, relative amounts of IMF, Intra and SS glycogen. Values are geometric means with 95% confidence intervals (CI). #, P < 0.005 vs. Type I. (*), P = 0.10 vs. Type I.
Localization and fibre type-dependent skeletal muscle glycogen content pre- and post-prolonged-exercise
Following the exercise, IMF glycogen of arm type I and II fibres decreased to similar absolute levels (Fig. 2A) and to similar levels expressed relative to Pre values (25 (18:36)% and 31 (22:45)%, respectively; P = 0.97). Intra glycogen also decreased to similar absolute levels in the two fibre types (Fig. 2B). However, due to the previously mentioned pre-exercise fibre type difference, the relative post-exercise value was lower in type I (11% (8:17)) than in type II fibres (17% (11:27)) (P = 0.02). This pattern was also found with SS glycogen, where there were no differences in absolute post-exercise values between fibre types (Fig. 2C) but, when expressed relative to pre-exercise levels, lower values were observed in type I fibres (17% (12:26)) than in type II fibres (38% (24:59)) (P = 0.008).
Figure 2. Glycogen content in three subcellular localizations of arm skeletal muscle (m. triceps brachii) before (Pre) and after (Post) approximately 1 h of exhaustive exercise.
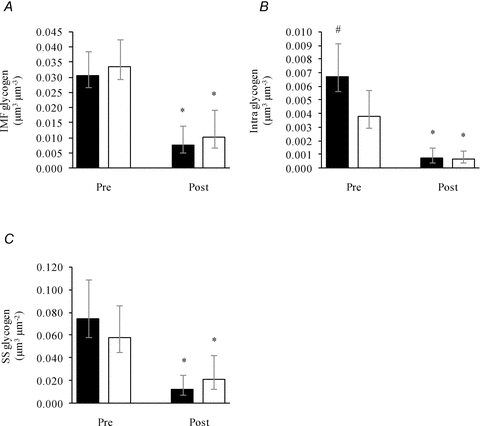
Three subfractions of glycogen, IMF (A), Intra (B) and SS (C), were estimated in type I (filled bars, Pre: n = 29, Post: n = 28) and II fibres (open bars, Pre: n = 30, Post: n = 26) pre- and post-exercise. Bars and vertical lines represent geometric means ± 95% CI, respectively. *, P < 0.0001 vs. Pre. #, P < 0.05 vs. type II fibres.
In the legs, glycogen in the three localizations only decreased in type I fibres following exercise (P≤ 0.01; Fig. 3A–C), where IMF glycogen decreased to 46% (35:60) of Pre values, Intra glycogen to 30% (20:44) and SS glycogen to 39% (27:56). Representative transmission electron microscopy images are shown in Fig. 4.
Figure 3. Glycogen content in three subcellular localizations of leg skeletal muscle (m. vastus lateralis) before (Pre) and after (Post) approximately 1 h of exhaustive exercise.
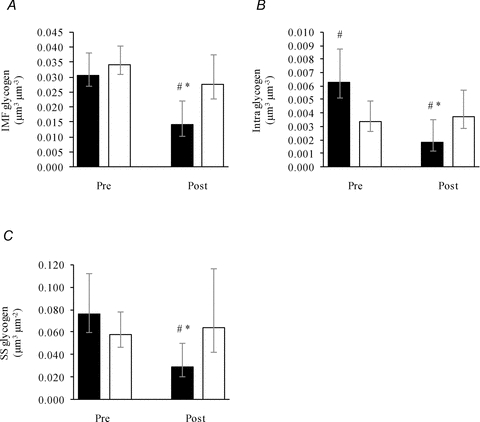
Three subfractions of glycogen, IMF (A), Intra (B) and SS (C), were estimated in type I (filled bars, Pre: n = 30, Post: n = 24) and II fibres (open bars, Pre: n = 29, Post: n = 26) pre- and post-exercise. Bars and vertical lines represent geometric means ± 95% CI, respectively. *, P < 0.0001 vs. Pre. #, P < 0.05 vs. type II fibres.
Interestingly, the relative decrease in glycogen content following the exercise was different between the three localizations, as shown by the relative distribution of glycogen (Table 1). Intra glycogen was preferentially utilized in arm type I and II fibres and leg type I fibres, as indicated by a decreased relative contribution to the total glycogen content. Further, SS was also preferentially utilized in arm type I fibres.
Table 1.
The relative distribution of glycogen at three subcellular locations in human skeletal muscle
| Pre-exercise | Post-exercise | |||||
|---|---|---|---|---|---|---|
| Fibre type | IMF | Intra | SS | IMF | Intra | SS |
| Arm | ||||||
| Type I | 77 (74–80) | 11 (10–14) | 9 (8–11) | 85 (82–88)* | 6 (4–7)* | 7 (6–9)* |
| Type II | 83 (80–86) | 7 (5–9) | 7 (6–8) | 85 (83–88) | 4 (3–5)* | 9 (7–10)* |
| Leg | ||||||
| Type I | 77 (75–80) | 11 (9–13) | 10 (8–11) | 82 (80–84)* | 8 (6–9)* | 9 (7–10) |
| Type II | 84 (81–87) | 6 (5–8) | 7(6–9) | 77 (71–85) | 8 (6–10) | 9 (7–12) |
IMF, intermyofibrillar glycogen; Intra, intramyofibrillar glycogen; SS, subsarcolemmal glycogen. Values are geometric means and 95% CI (n = 24–30 fibres).
P < 0.05 vs. Pre-exercise.
Localization and carbohydrate availability-dependent glycogen resynthesis
In the recovery period after exercise the 10 skiers were divided into two groups: one group received a carbohydrate (CHO)-rich meal within the first hour after exercise and one group was prevented from consuming any calories in the first 4 h. Both groups received a normal diet over the subsequent 18 h. With the limited number of skiers in each group (n = 5) it was necessary to pool arm and leg data to obtain satisfactory statistical power. However, while type I fibres of arm and leg had similar glycogen depletion following exercise and therefore could be pooled, type II fibres of arm and leg showed unequal glycogen depletion (Fig. 2vs.Fig. 3) and therefore were disregarded for further analysis. Thus, the analysis of localization and carbohydrate availability-dependent glycogen resynthesis was only performed on pooled type I fibres obtained from arm and leg muscles.
In these type I fibres, CHO availability during the first 4 h after exercise mediated a higher post-4 h IMF and Intra glycogen compared with no CHO availability (Fig. 5A and B). This role for CHO availability could not be shown for the SS glycogen level (Fig. 5C). Interestingly, with CHO supplies after 4 h post-exercise, post-22 h IMF and Intra glycogen levels were not different between groups (Fig. 5A and B). Furthermore, while IMF and SS glycogen levels post-22 h had reached pre-exercise levels, the Intra glycogen level only increased to 59% of the pre-exercise level (Fig. 5A–C). The relative distribution of glycogen in IMF, Intra and SS localizations were found to be dependent on CHO availability (Table 2), as the relative contribution of Intra glycogen to total glycogen decreases in the absence of CHO intake in the first 4 h of recovery (Table 2). This indicates that reduced glucose uptake in the recovery period impairs the resynthesis of Intra glycogen more than for IMF and SS glycogen.
Figure 5. Resynthesis of type I fibre glycogen in three subcellular localizations during recovery, with and without carbohydrate intake, from approximately 1 h of exhaustive exercise.
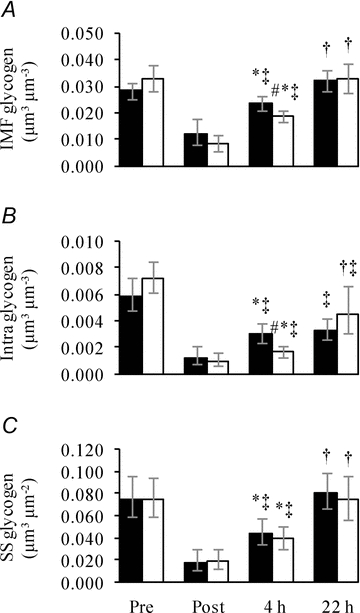
Three subfractions of glycogen, IMF (A), Intra (B) and SS (C), were estimated in type I fibres collected from biopsies obtained before (Pre), immediately after (Post), 4 h after (4 h) and 22 h after (22 h) approximately 1 h of exhaustive exercise. Subjects received either a CHO-rich meal (filled bars) or only water (open bars) during the first 4 h after exercise, after which both groups received CHO-rich meals. Values are geometric means ± 95% CI (n = 23–30). *, P < 0.05 vs. Post. †, P = 0.004 vs. 4 h. ‡, P = 0.03 vs. Pre. #, P = 0.02 vs. CHO group. Differences between time points and groups were tested using Wilcoxon rank-sum test.
Table 2.
Relative distribution of glycogen at three locations in type I fibres pre- and post-exercise, and in the recovery period after 1 h cross country skiing with (CHO group) or without (H2O group) CHO intake during the first 4 h of recovery
| Localization | Pre-exercise | Post-exercise | 4 h recovery | 22 h recovery |
|---|---|---|---|---|
| CHO group | ||||
| IMF | 77 (74:79) | 86 (84:88)# | 82 (79:85)#† | 81 (79:84)#† |
| Intra | 11 (9:13) | 6 (5:8)# | 7 (6:9)# | 6 (4:8)# |
| SS | 10 (9:12) | 6 (5:8)# | 8 (6:10) | 10 (9:12)† |
| H2O group | ||||
| IMF | 77 (75:80) | 81 (79:84)*# | 84 (82:87)# | 80 (76:84) |
| Intra | 11 (10:13) | 7 (5:9)# | 5 (4:6)*# | 8 (6:11)#‡ |
| SS | 9 (7:11) | 9 (8:11)* | 9 (7:11) | 9 (8:11) |
Values are geometric means and 95% CI (n = 23–30 fibres).
P ≤ 0.05vs. CHO group.
P ≤ 0.05 vs. Pre-exercise.
P ≤ 0.05 vs. Post-exercise.
P ≤ 0.05 vs. 4 h.
Groupings of glycogen particles and crystal-like structures in highly glycogen-depleted fibres immediately post-exercise
In the most glycogen-depleted fibres immediately post-exercise, groupings of small glycogen particles were observed in the intermyofibrillar and subsarcolemmal spaces (Fig. 6). This phenomenon was found in 10 of the 12 most glycogen-depleted fibres (4 type I and 6 type II fibres), and in these 10 fibres it appeared in 32 of 240 images. However, relative to all the fibres obtained immediately after exercise, it was in 15 of 54 fibres and 49 of 1296 images. These groupings were only observed in biopsies collected from the arm muscle immediately after the exercise. The size of the groupings was from 0.1 to 0.5 μm, although highly shaped by the presence of other intracellular components such as contractile filaments, mitochondria and sarcoplasmic reticulum. The diameter of the individual glycogen particles in the groupings ranged from approximately 10 to 18 nm. Importantly, this grouping occurred in fibres almost completely depleted of glycogen, which suggests an existence of compartmentalized regulation of glycogen metabolism in the intermyofibrillar and subsarcolemmal locations, respectively.
Figure 6. TEM images of groupings of glycogen particles observed in fibres post-exercise.
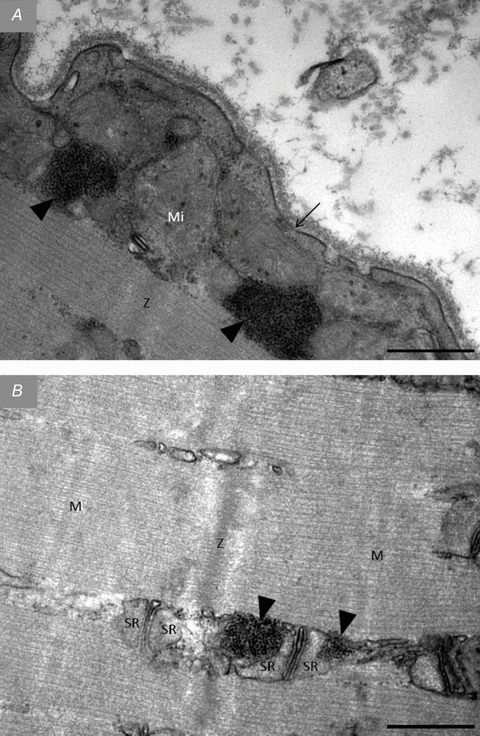
In almost all of the most glycogen-depleted fibres post-exercise groupings of small glycogen particles were observed in the subsarcolemmal space (A) and in the intermyofibrillar space in close proximity to sarcoplasmic reticulum (B). Arrow, sarcolemma. Arrow heads, grouping of glycogen particles. Z, Z-line; M, M-band; Mi, mitochondria. SR, sarcoplasmic reticulum. Scale bar = 0.5 μm.
Another phenomenon found in fibres post-exercise, distinct, at first glance, from the groupings of glycogen particles, is crystal-like structures (0.5–2.0 μm) also observed in the intermyofibrillar and subsarcolemmal spaces (Fig. 7). These crystal-like structures were only found in 3 of the 15 most depleted fibres and all 3 fibres were defined as type II. While the groupings of glycogen particles were found in a relatively high number of images suggesting a relatively homogeneous distribution throughout the cell, the crystal-like structures were only found in one image of each of the three fibres, thus suggesting a much less frequent presence. The time-course for the formation of these structures remains unknown; however, on one occasion we observed a co-localization of the crystal-like structure with the above-mentioned grouping of glycogen particles (Fig. 8), which suggests that grouping of glycogen particles could be an early state of, or a prerequisite for, the crystal-like structure.
Figure 7. TEM images of crystal-like structures observed in fibres post-exercise.
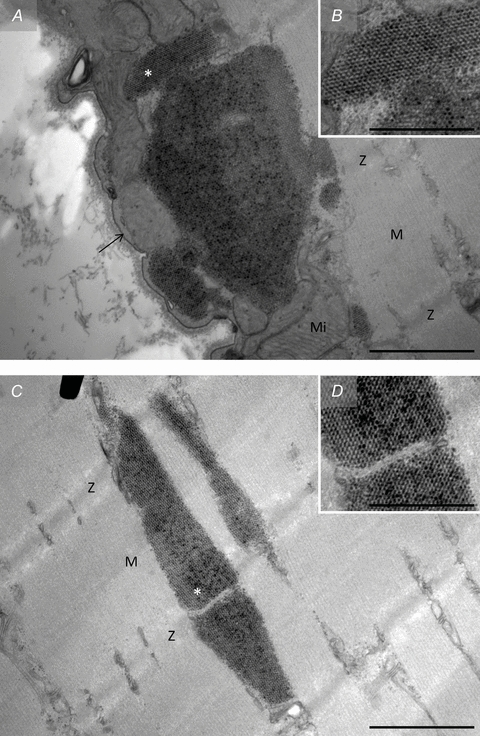
In a few fibres collected from biopsies obtained immediately post-exercise crystal-like structures were observed located both in the subsarcolemmal space (A and B) and in the intermyofibrillar space (C and D). Arrow, sarcolemma. Z, Z-line; M, M-band; Mi, mitochondria. *, position of B and D on A and C, respectively. Scale bar = 1 μm (A and C) or 0.5 μm (B and D).
Figure 8. TEM images of co-localization of groupings of glycogen particles and crystal-like structures observed in fibres post-exercise.
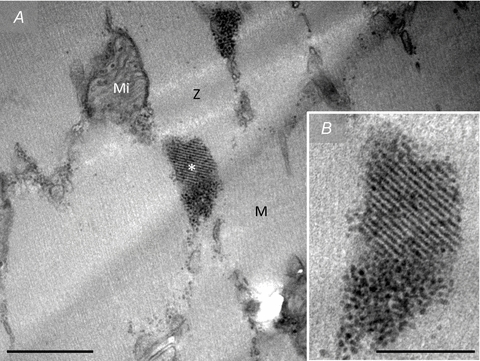
Occasionally co-localization of groupings of glycogen particles and crystal-like structures were observed. Z, Z-line; M, M-band; Mi, mitochondria. *, position of B on A. Scale bar = 0.5 μm (A) or 0.2 μm (B).
Discussion
The main findings of the present study were that in endurance-trained subjects (1) glycogen utilization during prolonged high-intensity exercise was dependent on its subcellular localization characterized by a greater depletion of Intra glycogen than of IMF and SS glycogen in both type I and II fibres; (2) a highly fibre type-specific glycogen distribution exists as type I fibres had both absolutely and relatively more Intra and SS glycogen than type II fibres, which on the contrary had relatively more IMF glycogen; (3) during recovery with either a carbohydrate-rich meal or only water, Intra glycogen was primarily affected by the impaired resynthesis of glycogen with water alone; and (4) immediately post-exercise, almost completely glycogen-depleted fibres displayed groupings of small glycogen particles both in intermyofibrillar and subsarcolemmal localizations. Collectively, these findings indicate strongly that glycogen in distinct subcellular compartments is regulated independently and that the specific localization of glycogen may be important in connection with skeletal muscle function.
Subcellular localization-dependent depletion of glycogen following exercise
The present study is, to our best knowledge, the first investigating by quantitative estimates a subcellular localization- and fibre type-specific utilization of skeletal muscle glycogen during exercise.
Two main findings appeared. Firstly, following the prolonged exhaustive exercise, Intra glycogen was preferentially depleted in arm type I and II and leg type I fibres (Figs 2 and 3). Secondly, SS glycogen was utilized relatively more than IMF glycogen in arm type I fibres (which had the highest glycogen depletion) (Fig. 2). These results suggest that Intra glycogen is preferentially depleted independently of the degree of glycogen depletion and fibre type, whereas SS glycogen is utilized more than IMF glycogen only when a high degree of glycogen depletion occurs (>60%). Since a high degree of depletion only occurred in arm type I fibres, it remains unknown whether or not this higher utilization of SS glycogen than IMF glycogen is fibre type- or limb-specific during cross country skiing.
Intriguingly, we have shown in a companion paper that Intra glycogen correlates with SR Ca2+ release rate (Ørtenblad et al. 2011), suggesting a link between low glycogen and fatigue. A distinct role of Intra glycogen in muscle function is supported by one in vitro study showing that Intra glycogen is related to the fatigue resistance capacity, whereas IMF glycogen is related to the half-relaxation time during an unfatigued tetanic contraction (Nielsen et al. 2009). Collectively, a preferential depletion of Intra glycogen during exercise, as shown in the present study, could mediate a signal to cease forceful muscle contractions during exercise by decreasing SR Ca2+ release rate, which, in turn, could prevent IMF glycogen from complete exhaustion. Whether the saved IMF glycogen serves as a safety store of readily available energy for reuptake of Ca2+ into the SR remains to be elucidated. Since, at present, no experimental data exist on the role of SS glycogen in skeletal muscles, it can only be speculated whether a role of proximity to sarcolemmal or subsarcolemmal-situated processes, which are known to be energy- and/or glycogen-dependent, is of importance.
Fibre type-dependent subcellular glycogen distribution pre-exercise
The subcellular distribution of glycogen in distinct locations was markedly different between fibre types characterized by 80% and 30% more glycogen in the Intra and SS locations in type I fibres than found in type II fibres. On the contrary, IMF glycogen tended to be 10% more abundant in type II fibres compared with type I fibres. This fibre type difference was present in both arm (triceps brachii) and leg (vastus lateralis), and is in conflict with previous qualitative (Sjöström et al. 1982b; Fridén et al. 1989) and quantitative studies (Nielsen et al. 2010a,b;) reporting equal amounts of IMF and SS glycogen in type I and II fibres from untrained or recreationally active subjects. Regarding Intra glycogen, the two qualitative studies (Sjöström et al. 1982b; Fridén et al. 1989) reported that glycogen particles were more frequently seen in the A-band in type II fibres, whereas the opposite, a more frequent appearance in the I-band, was found in type I fibres. In our recent studies and in the present study, we did not distinguish between I- and A-bands in the intramyofibrillar space, because preliminary results indicated that the distribution of Intra glycogen in the I- and A-bands, respectively, was partly dependent on the sarcomere length (J. Nielsen, unpublished observations). However, a subfraction of Intra glycogen could be fixed close to the Z-line in the I-band, independent of the sarcomere length, but dependent on fibre type, explaining their observations. Nevertheless, Intra glycogen content estimated as one entity did not show any fibre type difference in the untrained obese or recreationally active lean (Nielsen et al. 2010a,b;). Further, we have shown that 10 weeks of endurance training in previous sedentary obese subjects preferentially increased SS glycogen independently of fibre type (Nielsen et al. 2010a), indicating no short-term fibre type-dependent training adaptations in the distribution of glycogen in distinct localizations. Interestingly, the absolute amount of Intra glycogen in type I fibres was 50% higher than reported previously even after 10 weeks of endurance training (Nielsen et al. 2010a), whereas the absolute amounts of SS and IMF glycogen in the present study were no higher than reported previously after short-term endurance training (Nielsen et al. 2010a). This indicates that the accumulation of Intra glycogen exclusively in type I fibres of the athletes is a long-term training adaptation or only found in highly trained subjects, whereas SS and IMF glycogen content can be up-regulated after a few weeks of training. Importantly, physical activity levels and CHO intake in the days preceding the Pre biopsies were not controlled or registered in any of the populations investigated. Therefore, a higher activity level and/or higher CHO intake in the days before the biopsy by the endurance-trained athletes compared with the sedentary subjects could have influenced the results.
It was noteworthy, in terms of fibre type-specific glycogen content and localization, that there were no differences between triceps brachii and vastus lateralis of the elite cross country skiers enrolled in the present study, indicating a tight relationship to the muscle fibre phenotype. Thus, joint relationships or common regulatory pathways of subfractions of glycogen with other fibre type-specific proteins could exist (see Plomgaard et al. 2006).
Previously, it has been shown in arm-trained subjects that arm exercise is associated with larger lactate release compared to leg exercise (Jensen-Urstad & Ahlborg, 1992), and recently it has been shown in recreationally active subjects that while pre-exercise glycogen content and utilization during exercise were similar in triceps brachii and vastus lateralis muscle, lactate accumulation during limb-specific exercise was 55% higher in triceps brachii than in vastus lateralis (Kiilerich et al. 2008). This limb disparity could in the latter study be explained partly by lower pyruvate dehydrogenase capacity in triceps brachii than in vastus lateralis (Kiilerich et al. 2008), which seems in line with a lower oxygen extraction capacity in arms compared with legs (Calbet et al. 2005). In the latter study, data are from highly endurance-trained cross country skiers as in the present study, which suggests that the distribution of glycogen in distinct subcellular localizations in triceps brachii and vastus lateralis are not influenced by oxygen extraction capacity.
Localization and carbohydrate availability-dependent glycogen resynthesis
The main findings in the recovery period were that (1) omission of CHO intake during the first 4 h of recovery impaired Intra glycogen resynthesis more than for IMF and SS glycogen resynthesis, and (2) while IMF and SS glycogen were fully recovered after 22 h of recovery, Intra glycogen only recovered to 60% of pre-exercise levels independent of CHO availability during the first 4 h.
The first finding suggests that resynthesis of glycogen in the Intra localization depends more on blood-borne CHO availability than that in the IMF and SS localizations during recovery from approximately 1 h exhaustive exercise. In this regard, it is important to keep in mind that CHO provision in the recovery period is accompanied by increased serum insulin levels and that increased glucose uptake after the initial 1–2 h of recovery is only observed in the presence of insulin (Frøsig & Richter, 2009). Intriguingly, the T-system has been shown to be the major site of insulin-mediated glucose uptake (Lauritzen et al. 2006); decreased insulin sensitivity impairs GLUT4 translocation primarily to the T-system and not to the sarcolemma (Lauritzen et al. 2008). Thus, a characterization of compartmentalized glucose uptake in connection with the resynthesis of distinct localizations of glycogen may develop an understanding of the regulation and role of distinct localizations of glycogen.
The second finding indicates that complete resynthesis of Intra glycogen to pre-exercise levels is delayed compared with the resynthesis of IMF and SS glycogen. Here it is important that Intra glycogen was utilized relatively more than IMF and SS glycogen during exercise, which might partly explain the longer time for complete resynthesis. However, these results are in contrast with the study by Marchand et al. which shows a preferential resynthesis of Intra glycogen following prolonged exercise (Marchand et al. 2007). One explanation for this discrepancy could be that glycogen decreased to a lower level in the study by Marchand et al. in comparison with the present study (37 and 170 mmol (kg dw)−1, respectively) and that the relative contribution of Intra glycogen was also lower in the former study (3 and 6%, respectively). Thus, a high depletion could be a requirement for a preferential replenishment of Intra glycogen.
Groupings of glycogen particles and crystal-like structures in highly glycogen-depleted fibres immediately post-exercise
A qualitative finding in the present study was that immediately post-exercise in the almost completely glycogen-depleted fibres noticeable groupings (0.1–0.5 μm) of glycogen particles occurred. Since the presence of these groupings is biased towards the most depleted fibres and the area around the groupings is devoid of particles, it is likely that it reflects a novel compartmentalized retention of glycogen breakdown at exhaustion. While the physiological significance of these groupings at present is unknown, the existence is supported by a cell culture study, which showed that degradation of glycogen particles occurs sequentially, where some particles are completely degraded while others are only modestly degraded (Elsner et al. 2002). The grouping nature of these remaining particles in highly glycogen-depleted fibres suggests that interaction with cytoskeleton proteins takes place – directly through binding sites on the glycogen molecule or via some of the many glycogen-associated proteins (Graham, 2010). In this regard, another interesting phenomenon was found in the present study: the appearance of crystal-like structures (0.5–2 μm) in some of the highly glycogen-depleted fibres. Similar structures have been found by post-mortem examination of human skeletal muscle (Schmalbruch, 1967; Burch et al. 1968; Caulfield et al. 1968) and recently after chronic low frequency stimulation of rabbit skeletal muscles (Prats et al. 2005). The latter study conducted detailed analysis of these structures and could demonstrate the presence of β-actin, α-actinin and smooth muscle tropomyosin in conjunction with glycogen, glycogen synthase and glycogen phosphorylase (Prats et al. 2005). The presence of glycogen synthase associated with crystal-like structures has subsequently been confirmed in exercise-induced glycogen-depleted human skeletal muscle (Prats et al. 2009). Intriguingly, it was further demonstrated that glycogen synthase translocates to Intra, IMF and SS glycogen particles by a phosphorylation site-dependent mechanism (Prats et al. 2009). The translocation of glycogen synthase has also been found to be dependent on cytoskeleton in hepatocytes (Garcia-Rocha et al. 2001), which may explain the appearance of the crystal-like structures. Thus, it is intriguing that the groupings of glycogen particles occasionally co-localized with these crystal-like structures (Fig. 8); however, any similarities regarding involvement of cytoskeleton proteins, time-course of formation and role of energy metabolism remain elusive.
Summary
Our findings indicate, by quantitative estimates, that glycogen utilization during prolonged high-intensity exercise is dependent on its subcellular localization, with more pronounced depletion of intramyofibrillar than of intermyofibrillar or subsarcolemmal glycogen. A discrimination between fibre types revealed (i) that this preferential depletion of intramyofibrillar glycogen occurs in both type I and II fibres, and (ii) that, prior to exercise, type I fibres have 80% more intramyofibrillar and 30% more subsarcolemmal glycogen than do type II fibres, which contrarily tend to have 10% more intermyofibrillar glycogen. In highly glycogen-depleted fibres, the remaining small intermyofibrillar and subsarcolemmal glycogen particles are often found to cluster in groupings. Collectively, these findings suggest that a preferential depletion of Intra glycogen, constituting 6–13% of total glycogen, may occur during exercise. This could be a signal originating from energy transfer or signal transduction from intramyofibrillar glycogen to events of excitation–contraction coupling (Nielsen et al. 2009; Ørtenblad et al. 2011). Such a signal could either be spatially co-localized inside the myofibrils (Z-line proteins) or remote functionally coupled energy-sensing or -requiring processes (ion pumps or channels).
Acknowledgments
We thank Kirsten Hansen, Karin Trampedach and Benthe Jørgensen for excellent skilful technical assistance. This study was supported by grants from The Lundbeck Foundation, Team Denmark elite association and the Ministry of Culture Committee on Sports Research.
Glossary
Abbreviations
- CHO
carbohydrate
- IMF
intermyofibrillar
- Intra
intramyofibrillar
- SR
sarcoplasmic reticulum
- SS
subsarcolemmal
- TEM
transmission electron microscopy

maximum oxygen uptake
Author contributions
The experiments were performed at the Institute of Sports Science and Clinical Biomechanics (muscle analysis) and Institute of Pathology, Faculty of Health Science (electron microscopy pictures), University of Southern Denmark, DK-5230 M, Denmark, and the Swedish Winter Sports Research Centre, Department of Health Sciences, Mid Sweden University, Östersund, Sweden (exercise and testing). All authors contributed to the conception and design of the experiments, collection, analysis and interpretation of data, and drafting the article or revising it critically for important intellectual content. All authors approved the final version of the manuscript.
References
- Allen DG, Lamb GD, Westerblad H. Skeletal muscle fatigue: cellular mechanisms. Physiol Rev. 2008;88:287–332. doi: 10.1152/physrev.00015.2007. [DOI] [PubMed] [Google Scholar]
- Bangsbo J, Graham TE, Kiens B, Saltin B. Elevated muscle glycogen and anaerobic energy production during exhaustive exercise in man. J Physiol. 1992;451:205–227. doi: 10.1113/jphysiol.1992.sp019161. [DOI] [PMC free article] [PubMed] [Google Scholar]
- Barnes M, Gibson LM, Stephenson DG. Increased muscle glycogen content is associated with increased capacity to respond to T-system depolarisation in mechanically skinned skeletal muscle fibres from the rat. Pflugers Arch. 2001;442:101–106. doi: 10.1007/s004240000510. [DOI] [PubMed] [Google Scholar]
- Bergström J, Hermansen L, Hultman E, Saltin B. Diet, muscle glycogen and physical performance. Acta Physiol Scand. 1967;71:140–150. doi: 10.1111/j.1748-1716.1967.tb03720.x. [DOI] [PubMed] [Google Scholar]
- Bland JM, Altman DG. Statistical methods for assessing agreement between two methods of clinical measurement. Lancet. 1986;1:307–310. [PubMed] [Google Scholar]
- Burch GE, Sohal RS, Cololough HL, Sun SC. Virus-like particles in skeletal muscle of a heat stroke victim. Arch Environ Health. 1968;17:984–985. doi: 10.1080/00039896.1968.10665356. [DOI] [PubMed] [Google Scholar]
- Calbet JAL, Holmberg H-C, Rosdahl H, van Hall G, Jensen-Urstad M, Saltin B. Why do arms extract less oxygen than legs during exercise? Am J Physiol Regul Integr Comp Physiol. 2005;289:R1448–R1458. doi: 10.1152/ajpregu.00824.2004. [DOI] [PubMed] [Google Scholar]
- Caulfield JB, Rebeiz J, Adams RD. Viral involvement of human muscle. J Pathol Bacteriol. 1968;96:232–234. doi: 10.1002/path.1700960128. [DOI] [PubMed] [Google Scholar]
- Chin ER, Allen DG. Effects of reduced muscle glycogen concentration on force, Ca2+ release and contractile protein function in intact mouse skeletal muscle. J Physiol. 1997;498:17–29. doi: 10.1113/jphysiol.1997.sp021838. [DOI] [PMC free article] [PubMed] [Google Scholar]
- De Bruijn WC. Glycogen, its chemistry and morphologic appearance in the electron microscope. I. A modified OsO4 fixative which selectively contrasts glycogen. J Ultrastruct Res. 1973;42:29–50. doi: 10.1016/s0022-5320(73)80004-8. [DOI] [PubMed] [Google Scholar]
- Elsner P, Quistorff B, Hansen GH, Grunnet N. Partly ordered synthesis and degradation of glycogen in cultured rat myotubes. J Biol Chem. 2002;277:4831–4838. doi: 10.1074/jbc.M108226200. [DOI] [PubMed] [Google Scholar]
- Essén B. Glycogen depletion of different fibre types in human skeletal muscle during intermittent and continuous exercise. Acta Physiol Scand. 1978;103:446–455. doi: 10.1111/j.1748-1716.1978.tb06239.x. [DOI] [PubMed] [Google Scholar]
- Fridén J, Seger J, Ekblom B. Implementation of periodic acid-thiosemicarbazide-silver proteinate staining for ultrastructural assessment of muscle glycogen utilization during exercise. Cell Tissue Res. 1985;242:229–232. doi: 10.1007/BF00225582. [DOI] [PubMed] [Google Scholar]
- Fridén J, Seger J, Ekblom B. Topographical localization of muscle glycogen: an ultrahistochemical study in the human vastus lateralis. Acta Physiol Scand. 1989;135:381–391. doi: 10.1111/j.1748-1716.1989.tb08591.x. [DOI] [PubMed] [Google Scholar]
- Frøsig C, Richter EA. Improved insulin sensitivity after exercise: Focus on insulin signaling. Obesity. 2009;17:S15–S20. doi: 10.1038/oby.2009.383. [DOI] [PubMed] [Google Scholar]
- Garcia-Rocha M, Roca A, De La Iglesia N, Baba O, Fernández-Novell JM, Ferrer JC, Guinovart JJ. Intracellular distribution of glycogen synthase and glycogen in primary cultured rat hepatocytes. Biochem J. 2001;357:17–24. doi: 10.1042/0264-6021:3570017. [DOI] [PMC free article] [PubMed] [Google Scholar]
- Goodman C, Blazev R, Stephenson G. Glycogen content and contractile responsiveness to T-system depolarization in skinned muscle fibres of the rat. Clin Exp Pharmacol Physiol. 2005;32:749–756. doi: 10.1111/j.1440-1681.2005.04260.x. [DOI] [PubMed] [Google Scholar]
- Graham TE, Yuan Z, Hill AK, Wilson RJ. The regulation of muscle glycogen: the granule and its proteins. Acta Physiol (Oxf) 2010;199:489–498. doi: 10.1111/j.1748-1716.2010.02131.x. [DOI] [PubMed] [Google Scholar]
- Harris RC, Hultman E, Nordesjo LO. Glycogen, glycolytic intermediates and high-energy phosphates determined in biopsy samples of musculus quadriceps femoris of man at rest. Methods and variance of values. Scand J Clin Lab Invest. 1974;33:109–120. [PubMed] [Google Scholar]
- Helander I, Westerblad H, Katz A. Effects of glucose on contractile function, [Ca2+]i, and glycogen in isolated mouse skeletal muscle. Am J Physiol Cell Physiol. 2002;282:C1306–C1312. doi: 10.1152/ajpcell.00490.2001. [DOI] [PubMed] [Google Scholar]
- Hermansen L, Hultman E, Saltin B. Muscle glycogen during prolonged severe exercise. Acta Physiol Scand. 1967;71:129–139. doi: 10.1111/j.1748-1716.1967.tb03719.x. [DOI] [PubMed] [Google Scholar]
- Holmberg HC, Lindinger S, Stoggl T, Eitzlmair E, Muller E. Biomechanical analysis of double poling in elite cross-country skiers. Med Sci Sports Exerc. 2005;37:807–818. doi: 10.1249/01.mss.0000162615.47763.c8. [DOI] [PubMed] [Google Scholar]
- Howard CV, Reed MG. Unbiased Stereology. Three-dimensional Measurement in Microscopy. Oxford, UK: Bios Scientific Publishers; 2005. [Google Scholar]
- Jensen-Urstad M, Ahlnorg G. Is the high lactate release during arm exercise due to low training status? Clin Physiol. 1992;12:487–496. doi: 10.1111/j.1475-097x.1992.tb00352.x. [DOI] [PubMed] [Google Scholar]
- Kabbara AA, Nguyen LT, Stephenson GM, Allen DG. Intracellular calcium during fatigue of cane toad skeletal muscle in the absence of glucose. J Muscle Res Cell Motil. 2000;21:481–489. doi: 10.1023/a:1005650425513. [DOI] [PubMed] [Google Scholar]
- Kiilerich K, Birk JB, Damsgaard R, Wojtaszewski JFP, Pilegaard H. Regulation of PDH in human arm and leg muscles at rest and during intense exercise. Am J Physiol Endocrinol Metab. 2008;294:E36–E42. doi: 10.1152/ajpendo.00352.2007. [DOI] [PubMed] [Google Scholar]
- Lauritzen HPMM, Ploug T, Ai H, Donsmark M, Prats C, Galbo H. Denervation and high-fat diet reduce insulin signaling in T-tubules in skeletal muscle of living mice. Diabetes. 2008;57:13–23. doi: 10.2337/db07-0516. [DOI] [PubMed] [Google Scholar]
- Lauritzen HPMM, Ploug T, Prats C, Tavare JM, Galbo H. Imaging of insulin signaling in skeletal muscle of living mice show a major role of t-tubules. Diabetes. 2006;55:1300–1306. doi: 10.2337/db05-1216. [DOI] [PubMed] [Google Scholar]
- Lin LI-K. A concordance correlation coefficient to evaluate reproducibility. Biometrics. 1989;45:255–268. [PubMed] [Google Scholar]
- Lin LI-K. A note on the concordance correlation coefficient. Biometrics. 2000;56:324–325. [Google Scholar]
- Lowry OH, Passonneau JV. A Flexible System on Enzymatic Analysis. New York: Academic Press; 1972. [Google Scholar]
- Marchand I, Chorneyko K, Tarnopolsky M, Hamilton S, Shearer J, Potvin J, Graham TE. Quantification of subcellular glycogen in resting human muscle: granule size, number, and location. J Appl Physiol. 2002;93:1598–1607. doi: 10.1152/japplphysiol.00585.2001. [DOI] [PubMed] [Google Scholar]
- Marchand I, Tarnopolsky M, Adamo KB, Bourgeois JM, Chorneyko K, Graham TE. Quantitative assessment of human muscle glycogen granules size and number in subcellular locations during recovery from prolonged exercise. J Physiol. 2007;580:617–628. doi: 10.1113/jphysiol.2006.122457. [DOI] [PMC free article] [PubMed] [Google Scholar]
- Melendez-Hevia E, Waddell TG, Shelton ED. Optimization of molecular design in the evolution of metabolism: the glycogen molecule. Biochem J. 1993;295:477–483. doi: 10.1042/bj2950477. [DOI] [PMC free article] [PubMed] [Google Scholar]
- Nielsen J, Mogensen M, Vind BF, Sahlin K, Hojlund K, Schrøder HD, Ørtenblad N. Increased subsarcolemmal lipids in type 2 diabetes: effect of training on localization of lipids, mitochondria, and glycogen in sedentary human skeletal muscle. Am J Physiol Endocrinol Metab. 2010a;298:E706–E713. doi: 10.1152/ajpendo.00692.2009. [DOI] [PubMed] [Google Scholar]
- Nielsen J, Schrøder HD, Rix CG, Ørtenblad N. Distinct effects of subcellular glycogen localization on tetanic relaxation time and endurance in mechanically skinned rat skeletal muscle fibres. J Physiol. 2009;587:3679–3690. doi: 10.1113/jphysiol.2009.174862. [DOI] [PMC free article] [PubMed] [Google Scholar]
- Nielsen J, Suetta C, Hvid LG, Schrøder HD, Aagaard P, Ørtenblad N. Subcellular localization dependent decrements in skeletal muscle glycogen and mitochondria content following short-term disuse in young and old men. Am J Physiol Endocrinol Metab. 2010b;299:E1053–E1060. doi: 10.1152/ajpendo.00324.2010. [DOI] [PubMed] [Google Scholar]
- Ørtenblad N, Nielsen J, Saltin B, Holmberg HC. Role of glycogen availability on SR Ca2+ kinetics in human skeletal muscle. J Physiol. 2011;589:711–725. doi: 10.1113/jphysiol.2010.195982. [DOI] [PMC free article] [PubMed] [Google Scholar]
- Plomgaard P, Penkowa M, Leick L, Pedersen BK, Saltin B, Pilegaard H. The mRNA expression profile of metabolic genes relative to MHC isoforms pattern in human skeletal muscles. J Appl Physiol. 2006;101:817–825. doi: 10.1152/japplphysiol.00183.2006. [DOI] [PubMed] [Google Scholar]
- Prats C, Cadefau JA, Cussó R, Qvortrup K, Nielsen JN, Wojtaszewski JFP, Hardie DG, Stewart G, Hansen BF, Ploug T. Phosphorylation-dependent translocation of glycogen synthase to a novel structure during glycogen resynthesis. J Biol Chem. 2005;280:23165–23172. doi: 10.1074/jbc.M502713200. [DOI] [PubMed] [Google Scholar]
- Prats C, Helge JW, Nordby P, Qvortrup K, Ploug T, Dela F, Wojtaszewski JF. Dual regulation of muscle glycogen synthase during exercise by activation and compartmentalization. J Biol Chem. 2009;284:15692–15700. doi: 10.1074/jbc.M900845200. [DOI] [PMC free article] [PubMed] [Google Scholar]
- Schmalbruch H. Kristalloide in menschlichen skelettmuskelfasern. Naturwissenschaften. 1967;54:519. doi: 10.1007/BF01129379. [DOI] [PubMed] [Google Scholar]
- Sjöström M, Ängquist KA, Bylund AC, Fridén J, Gustavsson L, Schersten T. Morphometric analyses of human muscle fiber types. Muscle Nerve. 1982a;5:538–553. doi: 10.1002/mus.880050708. [DOI] [PubMed] [Google Scholar]
- Sjöström M, Fridén J, Ekblom B. Fine structural details of human muscle fibres after fibre type specific glycogen depletion. Histochemistry. 1982b;76:425–438. doi: 10.1007/BF00489899. [DOI] [PubMed] [Google Scholar]
- Stephenson DG, Nguyen LT, Stephenson GM. Glycogen content and excitation–contraction coupling in mechanically skinned muscle fibres of the cane toad. J Physiol. 1999;519:177–187. doi: 10.1111/j.1469-7793.1999.0177o.x. [DOI] [PMC free article] [PubMed] [Google Scholar]
- Vøllestad NK, Blom PC. Effect of varying exercise intensity on glycogen depletion in human muscle fibres. Acta Physiol Scand. 1985;125:395–405. doi: 10.1111/j.1748-1716.1985.tb07735.x. [DOI] [PubMed] [Google Scholar]
- Wanson JC, Drochmans P. Rabbit skeletal muscle glycogen. A morphological and biochemical study of glycogen β-particles isolated by the precipitation-centrifugation method. J Cell Biol. 1968;38:130–150. doi: 10.1083/jcb.38.1.130. [DOI] [PMC free article] [PubMed] [Google Scholar]
- Weibel ER. Stereological Methods. Vol. 2: Theoretical Foundations. London: Academic Press; 1980. [Google Scholar]