

Non-technical summary
The neural control of muscle activity differs during voluntary shortening and lengthening contractions. In this paper, we show that the relative contribution of both cortical and spinal mechanisms to the modulation of neural activation is specific during lengthening contraction and differs between synergist muscles. Knowledge of spinal and corticospinal excitabilities modulations during shortening and lengthening muscle contraction improves our understanding of the processes that underlies the neural control of muscles during dynamic contractions.
Abstract
Abstract
This study was designed to investigate the cortical and spinal mechanisms involved in the modulations of neural activation during lengthening compared with isometric and shortening maximal voluntary contractions (MVCs). Two muscles susceptible to different neural adjustments at the spinal level, the soleus (SOL) and medial gastrocnemius (MG), were compared. Twelve healthy males participated in at least two experimental sessions designed to assess corticospinal and spinal excitabilities. We compared the modulation of motor evoked potentials (MEPs) in response to transcranial magnetic stimulation and Hoffmann reflexes (H-reflexes) during isometric and anisometric MVCs. The H-reflex and MEP responses, recorded during lengthening and shortening MVCs, were compared with those obtained during isometric MVCs. The results indicate that the maximal amplitude of both MEP and H-reflex in the SOL were smaller (P < 0.01) during lengthening MVCs compared with isometric and shortening MVCs but similar (P > 0.05) in MG for all three muscle contraction types. The silent period that follows maximal MEPs was reduced (P < 0.01) during lengthening MVCs in the SOL but not the MG. Similar observations were obtained regardless of the initial length of the MG muscle. Collectively, the current results indicate that the relative contribution of both cortical and spinal mechanisms to the modulation of neural activation differs during lengthening MVCs and between two synergist muscles. The comparison of SOL and MG responses further suggests that the specific modulation of the corticospinal excitability during lengthening MVCs depends mainly on pre- and postsynaptic inhibitory mechanisms acting at the spinal level.
Introduction
The control strategy of lengthening contractions may differ from that used with other types of muscle contractions (Enoka, 1996). Consistent with this hypothesis, the electromyographic (EMG) activity of the involved muscles is often lower during lengthening maximal voluntary contractions (MVCs) than shortening MVCs (Westing et al. 1991; Amiridis et al. 1996; Aagaard et al. 2000; Komi et al. 2000; Pasquet et al. 2000), although not when the anisometric contraction departs from a maximal isometric contraction (Linnamo et al. 2000, 2003; Duclay & Martin, 2005; Garner et al. 2008; Altenburg et al. 2009). Such differences in EMG activity may be due to changes located at supraspinal and/or spinal levels. For example, we showed recently that the amplitude of the Hoffmann reflex (H-reflex) in the soleus (SOL) muscle was reduced during lengthening compared with isometric and shortening MVCs despite similar EMG activity in the three contraction types (Duclay & Martin, 2005). In contrast, the V-wave response, a variant of the H-reflex, which depends on the level of efferent and descending neural drive (Upton et al. 1971; Aagaard et al. 2000), remained unchanged (Duclay & Martin, 2005). The contrasting behaviour between the H-reflex and V-wave led us to suggest that spinal excitability may be specifically modulated during lengthening contractions by the supraspinal centres and/or neural mechanisms located at the spinal level. Consistent with these results, other research groups have hypothesized that the specific neural drive, also observed for lengthening contractions, mostly acts at the spinal level (Romano & Schieppati, 1987; Abbruzzese et al. 1994; Löscher & Nordlund, 2002; Sekiguchi et al. 2003; Duclay & Martin, 2005). However, the decrease in spinal excitability observed during passive lengthening actions was less when subjects performed voluntary lengthening contractions, suggesting that the neural control of the spinal excitability by the supraspinal centres can be specifically modulated (Nordlund et al. 2002; Duclay et al. 2009). Taken together, the results suggest that the unique modulation of the activation signal during lengthening contractions seems to involve both supraspinal and spinal mechanisms (see Duchateau & Enoka, 2008).
To differentiate the specific modulation in excitability of cortical and motor neurones during lengthening and isometric MVCs, Gruber et al. (2009) compared motor evoked potentials (MEPs) elicited in biceps brachii and brachioradialis by transcranial magnetic stimulation (TMS) of the motor cortex and cervicomedullary motor–evoked potential (CMEP) obtained by electrical stimulation of the corticospinal tract. Variations in MEP size reflect changes that can occur at both cortical and spinal levels (corticospinal pathway; Rothwell et al. 1991), whereas the CMEPs were used to probe motor neurone excitability (Ugawa et al. 1991; Martin et al. 2006; Taylor, 2006). The interesting finding of this study was that lengthening MVCs were associated with reduced amplitudes of MEPs and CMEPs but the decrease was significantly greater for the CMEP, in both biceps brachii and brachioradialis, reflecting greater inhibition at the spinal level. Furthermore, the MEP/CMEP ratio, which can be considered as an index of cortical excitability (Taylor & Gandevia, 2004), was significantly increased during lengthening MVCs. It was therefore suggested by Gruber and colleagues (2009) that the increase in cortical excitability could partially counteract spinal inhibition, which is consistent with the observation that the amplitude of the movement-related cortical potential derived from the electroencephalogram was greater during lengthening than shortening MVCs for the elbow flexors (Fang et al. 2004).
To obtain a more complete picture of the mechanisms that might modulate specifically cortical and spinal excitability during lengthening contractions, it is necessary to record both MEPs and H-reflexes. Because H-reflex responses are modulated by motor neurone excitability and Ia synaptic transmission (Schieppati, 1987), the amount of peripheral inhibition attributable to the lengthening action can be assessed by measuring the change at rest, whereas the interaction between the modulation of spinal and cortical excitabilities can be analysed by comparing concurrent changes in MEP and H-reflex amplitudes during MVCs. Furthermore, the silent period, which corresponds to the suppression of the ongoing voluntary EMG activity following TMS, provides an index of the amount of inhibition at the cortical level (Inghilleri et al. 1993; Nakamura et al. 1997; Chen et al. 1999). Another interesting aspect is that neural adjustments at cortical and spinal levels and their interaction during lengthening MVCs differ between upper and lower limb muscles because the amount of peripheral inhibitory mechanisms seems to be greater in the latter (Aymard et al. 2000). This suggestion is consistent with the observation that during lengthening MVCs, neural adjustments at the spinal level differ for two synergist muscles of the triceps surae, the SOL and the medial gastrocnemius (MG), known to receive different spindle feedback (Tucker & Türker, 2004).
The aim of the current study was to investigate the interaction between cortical and spinal mechanisms involved in the modulation of the neural activation during lengthening compared with isometric and shortening MVCs. We hypothesized that the relative contribution of both cortical and spinal mechanisms to the modulation of activation would differ during lengthening MVCs compared with isometric and shortening MVCs, and that this modulation would differ between the SOL and the MG muscles. To this end, we compared the modulations of MEP and H-reflex size and the duration of the silent period during isometric, shortening and lengthening MVCs with the anisometric contractions performed at constant velocity.
Methods
Subjects
Twelve healthy males (age 31.4 ± 9.3 years, means ± SD), with no history of neurological injuries or diseases, gave written informed consent to participate in this study. Approval for the project was obtained from the Ethics Committee of the Centre Hospitalier Universitaire Brugmann. All procedures used in this study were in conformity with the Declaration of Helsinki.
Study design
Two main series of experiments were performed to assess the modulation of (i) corticospinal excitability (experiment A) and (ii) spinal excitability (experiment B) during isometric, shortening and lengthening MVC. The two experimental sessions were separated by at least 3 days and the order of experiments was randomized among subjects. A complementary study (experiment C) investigated the modulation of the corticospinal and spinal excitabilities for the three contraction types when the angle of knee joint was increased, placing the MG in a more lengthened initial position. All subjects were asked to not perform any strenuous exercise for 48 h before testing sessions.
Mechanical data
Subjects were seated with the knee joint flexed at 60 deg (0 deg = full extension) in experiments A and B and with the knee fully extended in experiment C. Measurements were made on the right foot, which was attached to the footplate of a motor-driven computer-controlled ergometer (Type HDX 115C6; Hauser Compax 0260M-E2; Offenburg, Germany). The ergometer enabled instantaneous recording of muscle torque at constant angular velocity (20 deg.s-1). The force signal was amplified and filtered (AM 502; Tektronix, Beaverton, OR, USA; bandwidth DC–300 Hz). The ankle joint was aligned with the motor axis. Subjects were securely stabilized by a belt across the abdomen. To avoid changes in MEP (Lewis et al. 2001) or H-reflex (Gerilovsky et al. 1989) size due to changes in muscle length, stimulation was always delivered at an ankle angle of 0 deg in both isometric and isokinetic conditions. The range of motion was 30 deg, from −15 deg (dorsiflexion) to +15 deg (plantar-flexion) ankle angle. Each contraction type was performed separately.
Stimulation
Transcranial magnetic stimulation
A circular coil (130 mm OD) was positioned over the motor cortex to elicit MEPs in SOL and MG in response to TMS (Magstim 200 stimulator, Dyfed, UK). As a first step, the stimulus site providing the greatest amplitude for the SOL evoked response was identified. Secondly, the coil was secured in place throughout the experiment and orientated to deliver anterior–posterior directed current to the brain. The head of the subjects was secured in a custom-made headrest that ensured stable positioning of the coil during the experiment.
Tibial nerve stimulation
H-reflex and M-wave were evoked in SOL and MG by percutaneous stimulation of the posterior tibial nerve with single rectangular pulses (1 ms) delivered by a stimulator (model DS7, Digitimer, Welwyn Garden City, UK). Two silver disk electrodes of 8 mm diameter were used. The cathode was placed in the popliteal fossa and the anode was located over the patella. The stimulation site providing the greatest amplitude of the evoked response was first located by a hand-held cathode ball electrode (0.5 cm diameter). Once determined, the stimulation electrode was firmly fixed to this site with straps and tape.
Electromyography
Pairs of silver disk electrodes of 8 mm diameter (3 cm interelectrode distance) were used for EMG recordings. For the SOL, the electrodes were placed along the mid-dorsal line of the lower leg, about 5 cm distal from where the two heads of the gastrocnemius join the Achilles tendon. MG electrodes were fixed lengthwise over the middle of the muscle belly. To avoid the innervation zone and therefore to obtain an EMG response of maximal amplitude (Merletti et al. 2001), SOL and MG sites were determined in pilot testing by eliciting, for a given intensity, the greatest M-wave amplitude, through tibial nerve stimulation. Because the EMG responses of the plantar-flexors could be affected by concurrent activation of the tibialis anterior (TA), its EMG activity was also recorded (Schieppati, 1987). For the TA muscle, the electrodes were positioned at one-third of the line between the fibula and the tip of the medial malleolus (Hermens et al. 2000). The location of each electrode was marked on the skin with indelible ink, so that it was replaced in the same position from session to session. All EMG signals were amplified (×1000) and filtered (10 Hz to 1 kHz) by a custom-made differential amplifier. The signals were acquired on a personal computer at a sampling rate of 5 kHz with a data-acquisition system and analysed off-line by using the AcqKnowledge analysis software (Model MP 150, Biopac Systems, Santa Barbara, CA, USA).
Experimental protocol
Experiment A
To investigate corticospinal excitability modulations, input–output curves (Devanne et al. 1997) for MEP evoked in both SOL and MG were constructed when subjects performed isometric, shortening and lengthening MVCs. For anisometric contractions, each trial began with a maximal isometric preactivation of ∼1 s and the subjects were instructed to maintain maximal force throughout the whole range of motion. Threshold was defined as the intensity at which three of four evoked responses were detected above background EMG levels while the subject maintained a contraction at 30% MVC torque of the plantarflexor muscles (Sacco et al. 1997). The stimulus intensity was increased in steps of 10% of motor threshold intensity (MTintensity) (from threshold to an intensity corresponding to 50–70% above MTintensity according to subject) and was expressed as a percentage of MTintensity. At each stimulus intensity, subjects were asked to perform four isometric, shortening or lengthening MVCs with at least 1 min between each trial. If the MEP amplitudes varied excessively (coefficient of variation >5%), additional contractions were performed.
Experiment B
To investigate spinal excitability modulations, the following experimental protocol, which has been presented elsewhere (Duclay et al. 2008), was conducted. Briefly, passive isometric, shortening and lengthening recruitment curves were first performed to carefully search for stimulus intensities inducing a maximal SOL H-reflex (Hmax) or H-reflex corresponding to 80% of the maximal SOL H-reflex (H80). Submaximal H-reflex (H80) was investigated during isometric and anisometric MVCs because it lies in the ascending part of the H-reflex recruitment curve and could thus be more sensitive to increase or decrease than maximal H-reflex (Hmax) (see Pierrot–Deseilligny & Burke, 2005). For each muscle action type, four stimuli at supra-maximal intensity (1.5× maximum M-wave stimulus intensity) were delivered at rest and the averaged value of the four recorded M-waves was considered as the Mmax value. These stimulus intensities (H80, Hmax and Mmax) were subsequently used to evoke H-reflex and M-wave during maximal isometric, shortening and lengthening voluntary contractions. As for experiment A, each anisometric contraction departed from an isometric MVC at the corresponding starting joint angle. For each muscle action type, subjects were asked to perform 12 MVCs (four for each of the following recordings: H80, Hmax and Mmax). If the H80, Hmax or Mmax amplitudes varied excessively (coefficient of variation >5%), additional contraction(s) were performed. Two maximal voluntary isometric, shortening and lengthening dorsiflexions were performed to measure the magnitude of antagonist TA coactivation.
Experiments C
In an additional set of experiments that was designed to examine the modulation of the corticospinal and spinal excitabilities during isometric and anisometric actions when the MG was in a more lengthened position, six of the 12 subjects performed the same protocol as described above, except that the knee was placed in a fully extended position. The M-wave elicited concomitantly with the Hmax (MHmax), which represented a small fraction of the M max, was measured to control the stability of the stimulus intensity (Schieppati, 1987). The following evoked responses were recorded in these conditions: (i) Hmax, MHmax and Mmax during passive and active contraction and (ii) the MEP during MVC.
Data analysis
Muscle torque
For all experiments, isometric, shortening and lengthening torques were recorded at 0 deg prior to the superimposed stimulation. The MVC torque was computed as the mean value recorded over all trials for each contraction type of a given experimental session.
EMG activity
SOL and MG EMG activities were quantified with root mean square (RMS) values of the EMG signal over a 500 ms period prior to the stimulation and were normalized to the corresponding amplitude of maximal superimposed M-wave (RMS/Mmax) obtained during MVC. For each experiment, the mean over all trials was considered for each muscle contraction type to represent maximal SOL and MG EMG activities. The EMG RMS for SOL and MG were also analysed over the 500 ms of the isometric preactivation that preceded the beginning of the anisometric MVCs. During the same period of time, TA RMS prior to the stimulation was also analysed for the three contraction types. To quantify the level of coactivation during the isometric contractions, TA RMS was expressed as a fraction of its value determined during MVC dorsiflexions. To quantify coactivation during shortening trials, TA RMS obtained during shortening plantar flexions was normalized to its value determined during maximal voluntary lengthening dorsiflexions whereas to quantify coactivation during lengthening trials, TA RMS recorded during lengthening plantar flexions was normalized to its value measured during maximal voluntary shortening dorsiflexion (Hagood et al. 1990). For each experiment, a mean value of coactivation was computed over all trials for each contraction type.
Evoked potentials: MEP
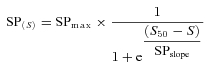
Input–output curves were generated from MEP responses recorded in both the SOL and MG when subjects performed isometric, shortening and lengthening MVCs. For each muscle, the peak-to-peak amplitude and the area of MEPs were measured. Area was determined between cursors that encompassed the MEP. Because peak-to-peak amplitude and area showed similar change for these parameters, only peak-to-peak amplitudes are reported. For each contraction type, the size of the SOL and MG MEP were normalized to the corresponding M-wave obtained in the same condition. Because no muscle action type effect on the amplitude of the MEP at threshold was observed, the following equation of Boltzmann sigmoidal function was used to fit the data points:
 |
where MEPmax is the maximum MEP defined by the function; S, the stimulus intensity; and S50, the stimulus intensity at which the MEP size is 50% of the maximal MEP. The MEPslope parameter was calculated by differentiating the input–output equation. Because the threshold (MEPthreshold) is not an explicit parameter of the Boltzmann equation, it was estimated by fitting the data points on the steepest part of the input–output relation by a straight line and was calculated as the x-intercept of this line. As suggested by Devanne et al. (1997), these parameters need to be assessed to investigate a task-dependent change in the involvement of the motor cortex.
The duration of the silent period following TMS was taken as the time interval from the stimulus artefact to the return of continuous EMG. The end of the silent period for SOL and MG was determined when the corresponding rectified EMG activity reached the mean value extended by two standard deviations of the rectified EMG signal recorded during ∼1 s when subject was at rest before the contraction. For both SOL and MG, the relations between the duration of the silent period and the stimulus intensity were constructed from the average value of four responses. The following equation of Boltzmann sigmoidal function was used to fit the data points:
 |
where SPmax is the maximum silent period defined by the function; S, the stimulus intensity; and S50, the stimulus intensity at which the duration of the silent period is 50% of its maximal. Only the maximal silent period values (SPmax) are reported.
Evoked potentials: H-reflex and Mmax
The average values from four responses were calculated to determine the following parameters at rest and during MVC: peak–to-peak amplitude of submaximal and maximal H-reflex (H80 and Hmax, respectively), submaximal M-wave evoked at H80 and Hmax (MH80 and MHmax, respectively), maximal M-wave (Mmax). The H80/Mmax and Hmax/Mmax, ratios were computed.
Reliability of measurements
Due to the number of contractions required to obtain the complete input–output curve during isometric, shortening and lengthening contractions in experiment A (from 60 to 84 MVCs depending of subject's motor threshold intensity and the number of steps necessary to reach maximal MEP), fatigue may have affected the results. To minimize this potential effect, stimuli were delivered in randomized order across subjects and muscle contraction types. Furthermore, when we compared the isometric MVC torques recorded in 7 of the 12 subjects that performed such contractions at the beginning (MEP recording) and at the end (Mmax recording) of the session in experiment A, no significant difference (P > 0.05) was found (105.6 ± 8.6 vs. 99.2 ± 10.2 N m, respectively). Additional analyses using the coefficient of variation (CV) and the intraclass correlation coefficient (ICC) were used to test, for each contraction type, the variability and the reproducibility of MVC torques, SOL and MG EMG activities. The ICC (2, 1) is a two-way random-effects model with single-measure reliability in which variance over the repeated sessions is considered. SPSS software (v. 9; SPSS, Inc., Chicago, IL, USA) was used to calculate the ICC. Variables considered in the present study demonstrate a low variability (CV < 12.50%) and a high degree of reproducibility (ranging from 0.79 to 0.95) between trials (Table 1). Furthermore, because data were collected during two experimental sessions, it was important to verify the reproducibility of maximal torque and EMG-related parameters. Table 1 shows the intraclass reproducibility and variability of dependent variables with regard to MVC torque and EMG activity for both SOL and MG muscles. For MVC torque, ICC ranged from 0.92 to 0.93 and from 0.89 to 0.92 for experiments A and B, respectively. For SOL RMS/Mmax ratios, ICC ranged from 0.81 to 0.89 in experiment A and from 0.86 to 0.91 in experiment B. For the MG RMS/Mmax ratios, ICC ranged from 0.79 to 0.94 and from 0.86 to 0.95 in experiments A and B, respectively. Regardless of the experiment, CV was lower than 4.5% for MVC torque and lower than 11.7% and 12.5% for SOL and MG EMG activity, respectively (Table 1). Furthermore, no session effect was observed for these two parameters (Table 2).
Table 1.
Intraclass correlation coefficient (ICC) and variability (CV) between the two testing sessions for the respective variables
| CV (%) | ICC (95% CI) | ||||||
|---|---|---|---|---|---|---|---|
| Variables | Len | Iso | Sho | Len | Iso | Sho | |
| Experiment A | Torque (N.m) | 4.39 | 5.60 | 4.99 | 0.92 (0.82–0.98)* | 0.93 (0.83–0.98)* | 0.93 (0.82–0.98)* |
| RMS/Mmax (a.u.) | |||||||
| SOL | 7.47 | 8.59 | 8.72 | 0.81 (0.58–0.96)* | 0.89 (0.74–0.98)* | 0.87 (0.68–0.98)* | |
| MG | 10.74 | 12.50 | 12.42 | 0.94 (0.84–0.99)* | 0.92 (0.81–0.98)* | 0.79 (0.54–0.96)* | |
| Experiment B | Torque (N.m) | 5.31 | 4.33 | 5.50 | 0.92 (0.84–0.97)* | 0.89 (0.79–0.96)* | 0.91 (0.82–0.97)* |
| RMS/Mmax (a.u.) | |||||||
| SOL | 11.74 | 11.16 | 10.41 | 0.86 (0.71–0.96)* | 0.86 (0.73–0.95)* | 0.91 (0.81–0.97)* | |
| MG | 11.87 | 11.54 | 11.46 | 0.86 (0.46–0.99)* | 0.93 (0.85–0.98)* | 0.95 (0.88–0.98)* | |
CV, coefficient of variation; 95% CI, lower and upper confidence interval.
Significant at P < 0.001. Len: lengthening; Iso: isometric; Sho: shortening.
Table 2.
Effect of contraction type on maximal voluntary torque, plantarflexor EMG activity, amplitudes of Soleus (SOL) and medial gastrocnemius (MG) evoked potentials and coactivation
| Lengthening | Isometric | Shortening | ||
|---|---|---|---|---|
| Experiment A | Torque (N.m) | 109.6 ± 6.3 | 105.9 ± 6.2 | 85.7 ± 6.9* |
| Sol | ||||
| Passive | ||||
| Mmax (mV) | 8.5 ± 0.9 | 8.6 ± 0.9 | 8.7 ± 0.9 | |
| MVC | ||||
| Mmax (mV) | 12.8 ± 1.0 | 12.6 ± 0.9 | 12.8 ± 1.0 | |
| RMS/Mmax (a.u.) | 0.035 ± 0.002 | 0.036 ± 0.002 | 0.036 ± 0.004 | |
| MG | ||||
| Passive | ||||
| Mmax (mV) | 7.2 ± 1.2 | 7.0 ± 1.2 | 7.3 ± 1.2 | |
| MVC | ||||
| Mmax (mV) | 9.1 ± 1.2 | 9.5 ± 1.3 | 9.2 ± 1.3 | |
| RMS/Mmax (a.u.) | 0.048 ± 0.007 | 0.044 ± 0.006 | 0.040 ± 0.006 | |
| Coactivation (%) | 10.82 ± 2.63 | 11.12 ± 2.44 | 10.44 ± 1.84 | |
| Experiment B | Torque (N.m) | 113.1 ± 8.5 | 110.8 ± 7.5 | 89.75 ± 7.4* |
| Sol | ||||
| Passive | ||||
| Mmax (mV) | 8.2 ± 0.9 | 8.4 ± 0.9 | 8.3 ± 0.8 | |
| MHmax/Mmax (a.u.) | 0.18 ± 0.05 | 0.15 ± 0.05 | 0.13 ± 0.05 | |
| MVC | ||||
| Mmax (mV) | 11.7 ± 0.9 | 11.4 ± 1.0 | 11.3 ± 1.0 | |
| RMS/Mmax (a.u.) | 0.041 ± 0.002 | 0.044 ± 0.003 | 0.041 ± 0.003 | |
| MHmax/Mmax (a.u.) | 0.21 ± 0.06 | 0.19 ± 0.05 | 0.19 ± 0.03 | |
| MG | ||||
| Passive | ||||
| Mmax (mV) | 7.1 ± 1.2 | 6.6 ± 1.1 | 6.9 ± 1.2 | |
| MHmax/Mmax (a.u.) | 0.36 ± 0.08 | 0.36 ± 0.09 | 0.30 ± 0.08 | |
| MVC | ||||
| Mmax (mV) | 9.4 ± 0.9 | 10.7 ± 1.1 | 9.7 ± 0.9 | |
| RMS/Mmax (a.u.) | 0.044 ± 0.006 | 0.042 ± 0.008 | 0.038 ± 0.008 | |
| MHmax/Mmax (a.u.) | 0.42 ± 0.07 | 0.37 ± 0.08 | 0.36 ± 0.08 | |
| Coactivation (%) | 13.72 ± 1.26 | 14.99 ± 1.98 | 13.74 ± 1.63 |
Data are mean ± SEM (n = 12).
Significant at P < 0.001: Shortening vs. Isometric and Lengthening
Statistical analysis
All data are presented as means ± standard error of the mean (SEM). The normality of the data was tested using the Shapiro–Wilks W test. Separate two-factors (session (experiment A vs. experiment B) × muscle action type (isometric vs. shortening vs. lengthening)) ANOVAs with repeated measures on session and muscle action type were used to compare MVC torque, maximal M-wave amplitude, level of coactivation and RMS/Mmax ratios for both SOL and MG. Separate one-way repeated measures ANOVAs were used to test differences between muscle contraction type (isometric, shortening, lengthening) for MEPmax/Mmax, MEPthreshold, MEPslope and silent period. Separate two-factors (muscle activity (rest vs. MVC) × muscle action type (isometric vs. shortening vs. lengthening)) ANOVAs with repeated measures on activity and muscle contraction type were used to compare the H80/Mmax, MH80/Mmax Hmax/Mmax, MHmax/Mmax ratios for both SOL and MG. In experiment A, the relation between MEP amplitude and duration of the corresponding silent period was computed using linear regression analysis (Pearson's product–moment correlation) for each muscle contraction type and for both SOL and MG muscles. The slopes of these relations were compared by separate ANOVAs with repeated measure on muscle contraction type. When a main effect or an interaction was found, a post hoc analysis was made using Scheffe's test. ANOVAs and post hoc tests were performed using STATISTICA (v. 6.0, Statsoft, Tulsa, OK, USA). Significance was accepted at P < 0.05.
Results
Torque and EMG activity
As illustrated for one subject in Fig. 1, the MVC torque produced at 0 deg prior to the superimposed stimulation was lower during shortening contractions, compared with isometric and lengthening contractions. When data from the two sessions (experiments A and B) were collapsed, the average MVC torque exerted in shortening actions by the subjects was 21.2% and 19.0% lower (P < 0.001) than in isometric and lengthening contractions, respectively.
Figure 1. Representative recordings of force and EMG during isometric and anisometric contractions.

Illustration of the angular ankle displacement (A), the torque produced during plantar flexion (B) and the corresponding EMG activity of the soleus (SOL; C), medial gastrocnemius (MG, D) and tibialis anterior (TA, E) during lengthening, isometric and shortening MVCs. Anisometric contractions were performed at a constant angular velocity of 20 deg.s-1 and departed from an initial isometric MVC.
However, no difference was observed between isometric and lengthening torque (P > 0.05) (Table 2). In contrast, both SOL and MG EMG activities (RMS/Mmax) were not significantly different between isometric, shortening and lengthening MVCs (Tables 2 and 3). Similarly, no muscle action type and session effect was obtained for muscle coactivation (Table 2). Furthermore, for both SOL and MG, the EMG activity during the isometric contraction (preactivation) that preceded the shortening and lengthening contractions was similar (P > 0.05).
Table 3.
Effect of contraction type on plantarflexor EMG activity, silent period duration, spinal and corticospinal excitabilities of soleus (SOL) and medial gastrocnemius (MG) with the knee fully extended
| Lengthening | Isometric | Shortening | ||
|---|---|---|---|---|
| Experiments C | Sol | |||
| Passive | ||||
| Hmax/Mmax (a.u) | 0.44 ± 0.11* | 0.60 ± 0.09 | 0.57 ± 0.09 | |
| MVC | ||||
| MEP/Mmax (a.u) | 0.10 ± 0.01* | 0.14 ± 0.01 | 0.14 ± 0.01 | |
| Silent Period (ms) | 103.14 ± 6.67* | 113.86 ± 6.69 | 113.19 ± 8.69 | |
| Hmax/Mmax (a.u) | 0.46 ± 0.08* | 0.52 ± 0.09 | 0.52 ± 0.08 | |
| RMS/Mmax (a.u.) | 0.034 ± 0.003 | 0.035 ± 0.004 | 0.038 ± 0.004 | |
| MG | ||||
| Passive | ||||
| Hmax/Mmax (a.u) | 0.13 ± 0.06* | 0.18 ± 0.06 | 0.22 ± 0.06 | |
| MVC | ||||
| MEP/Mmax (a.u) | 0.23 ± 0.04 | 0.19 ± 0.02 | 0.25 ± 0.03 | |
| Silent Period (ms) | 106.49 ± 6.60 | 111.26 ± 7.35 | 112.71 ± 8.91 | |
| Hmax/Mmax (a.u) | 0.29 ± 0.06 | 0.31 ± 0.06 | 0.31 ± 0.05 | |
| RMS/Mmax (a.u.) | 0.059 ± 0.007 | 0.050 ± 0.006 | 0.053 ± 0.006 |
Data are means ± SEM (n = 6).
Significant at P < 0.01: Lengthening vs. Isometric and Shortening.
Motor evoked potential
As illustrated for one subject in Fig. 2, the maximal amplitude of the SOL MEP was lower during lengthening than during isometric and shortening MVCs. Average values were 2.7 ± 0.2 mV, 2.6 ± 0.2 mV and 2.2 ± 0.3 mV during isometric, shortening and lengthening MVCs, respectively. While this value is significantly smaller (P < 0.01) during lengthening contraction, the amplitude of the MEPmax did not differ significantly (P > 0.05) between isometric and shortening MVCs. For MG, no contraction type effect (P > 0.05) was obtained (average value was 2.3 ± 0.3 mV).
Figure 2. EMG responses to transcranial magnetic stimulation and electrical stimulation during isometric and anisometric contractions.

The maximal motor-evoked potentials (MEPs) and maximal H-reflex recorded in the Soleus (SOL, traces A and B) and medial gastrocnemius (MG, traces C and D) during lengthening, isometric and shortening MVCs of one representative subject are illustrated. The vertical arrows indicate the time at which the stimulus was delivered (stimulus artefact).
Input–output curves for the SOL and MG are shown in Fig. 3A and B, respectively. The average SOL MEPthreshold was similar (P > 0.05) for all contraction types, whereas the MEPmax/Mmax was significantly (P < 0.01) reduced by 21.8% and 20.0% during lengthening MVCs compared with isometric and shortening MVCs, respectively (Fig. 3D). For MG, both MEPmax/Mmax and MEPthreshold did not differ significantly (P > 0.05) for the three types of contraction. Furthermore, MEPslope for both SOL and MG were significantly lower (P < 0.05) during lengthening than during isometric MVCs (Fig. 3C).
Figure 3. Input–output relation to transcranial magnetic stimulation during isometric and anisometric contractions.
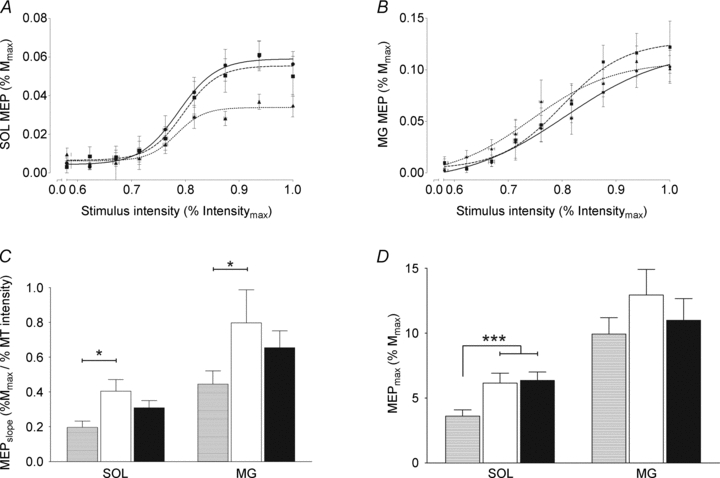
The input–output curves of motor-evoked potential (MEP), expressed as a function of stimulus intensity (% of maximal stimulus intensity), during isometric (circles), shortening (squares) and lengthening (triangles) MVCs are illustrated for the group (means ± SEM) for the soleus (SOL) and medial gastrocnemius (MG) in panel A and B, respectively. Modulations of the input–output parameters during lengthening (hatched bars), isometric (open bars) and shortening (filled bars) MVCs are shown for the group of subjects (n = 12; means ± SEM) for both the SOL and MG in panels C and D, respectively. ***Significant difference at P < 0.001: lengthening vs. isometric and shortening. *Significant difference at P < 0.05: lengthening vs. isometric.
The effect of contraction type on the SOL and MG MEPmax/Mmax ratios did not differ when the knee position was changed. Indeed, when the knee was fully extended (experiment C), the SOL MEPmax/Mmax ratio was significantly (P < 0.05) reduced during lengthening MVCs compared with isometric and shortening MVCs. In contrast, no muscle contraction type effect was observed for the MG MEPmax/Mmax ratio during MVCs (P > 0.05) (Table 3).
Silent period
The silent period input–output curves for the SOL and MG are shown in Fig. 4C and D, respectively. For maximal MEP amplitude, the average silent period duration for the SOL was significantly (P < 0.01) shorter by 11.4% and 8.7 % during lengthening (118.3 ± 3.8 ms) compared with isometric (134.8 ± 5.2 ms) and shortening (129.9 ± 3.0 ms) MVCs, respectively. In contrast, the silent period duration for MG did not differ (P > 0.05) between contraction types (Fig. 4B).
Figure 4. Changes in silent period during isometric and anisometric contractions.

The silent period was measured from the stimulus artefact (vertical arrow) to the resumption of voluntary EMG activity (panel A). The end of the silent period was determined when rectified EMG activity reached the mean value extended by 2 standard deviations of the rectified EMG signal recorded during ∼1 s when subject was at rest before the contraction (Resting EMG). The relations between the duration of the silent period following transcranial magnetic stimulation and stimulus intensity for the soleus (SOL) (panel C) and medial gastrocnemius (MG) (panel D) during isometric (circles), shortening (squares) and lengthening (triangles) maximal voluntary contractions (MVCs) are illustrated for the group (means ± SEM). The duration of the silent period, recorded for the greatest stimulus intensity, is compared for lengthening (hatched bars), isometric (open bars) and shortening (filled bars) MVCs (panel B). For each contraction type, data represent means ± SEM for 12 subjects. ***Significant difference at P < 0.001: lengthening vs. isometric and shortening.
Because the duration of the silent period can be influenced by the size of the MEP, we computed the relations between these two parameters for the three contraction types (Fig. 5). Regardless the contraction type, the decrease of the silent period duration was significantly correlated with the decrease of the MEP amplitude (0.82 < r < 0.99; P < 0.01) for both SOL and MG. As illustrated in Fig. 5, the slope of this relation was, however, significantly (P < 0.01) greater during lengthening (90.82 ± 12.04 ms.mV-1) than during isometric (61.53 ± 6.94 ms.mV-1) and shortening (65.27 ± 6.78 ms.mV-1) MVCs for the SOL. No significant contraction type effect (P > 0.05) was observed for the MG (mean slope value: 58.68 ± 6.22 ms.mV-1).
Figure 5. Changes in the relation between the amplitude of the motor-evoked potential and the duration of the silent period during isometric and anisometric contractions.
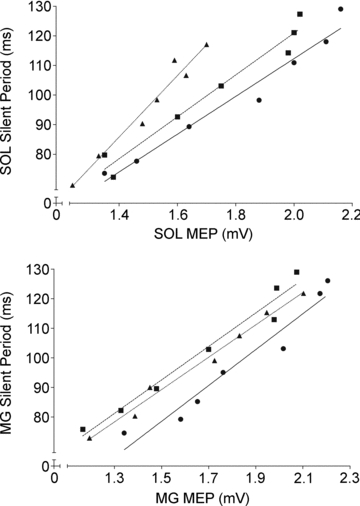
Motor-evoked potential (MEP) amplitude was compared to their corresponding silent period during isometric (circles), shortening (squares) and lengthening (triangles). For the group, relations between the MEP and the silent period are illustrated for the soleus (SOL) muscle (top panel) and for the medial gastrocnemius (MG) (bottom panel). The two parameters are positively correlated regardless of the muscle contraction type (0.82 < r < 0.99; P < 0.01) for both SOL and MG. The slope of this relation was significantly (P < 0.01) greater during lengthening than during isometric and shorteniong contractions for SOL but not for MG.
H-reflex
During passive ankle movement, the maximal (Hmax/Mmax) and submaximal (H80/Mmax) H-reflex amplitudes were significantly lower (P < 0.05) during lengthening than during isometric and shortening actions for both SOL and MG (Fig. 6). During MVC, the SOL Hmax/Mmax and H80/Mmax ratios were significantly (P < 0.01) reduced on average by 23.1% and 28.6% during lengthening contractions compared with isometric and shortening contractions (Fig. 6A and C). In contrast, no significant difference (P > 0.05) between contraction types was observed for the corresponding MG ratios (Fig. 6B and D). For both SOL and MG, the MHmax/Mmax ratios were similar (P > 0.05) between contraction types during MVCs and did not differ significantly (P > 0.05) between passive ankle movement and MVCs (Table 2). When the knee was fully extended (experiment C), the SOL Hmax/Mmax ratio was still lower during lengthening MVCs than during isometric and shortening MVCs (P < 0.05). For this position, no contraction type effect was observed for the corresponding MG ratio (P > 0.05) (Table 3).
Figure 6. Changes in spinal excitability during isometric and anisometric contractions.

The mean ± SEM (n = 12) of submaximal (H80) (top panels, A and B) and maximal (Hmax and Hmax) (bottom panels, C and D) H-reflex normalized to the corresponding maximal M-wave for the soleus (SOL, left panels) and medial gastrocnemius (MG, right panels) during lengthening (hatched bars) isometric (open bars) and shortening (filled bars) contractions. Modulations of these ratios were investigated during passive actions (REST) and during maximal voluntary contraction (MVC). ***Significant difference at P < 0.001: lengthening vs. isometric and shortening.
Discussion
To investigate the respective contribution of cortical and spinal mechanisms in the unique neural control of lengthening MVCs, the modulations of MEP and H-reflex size and the duration of the silent period following TMS were compared with those of isometric and shortening MVCs. The main finding was that maximal amplitude of both MEP and H-reflex and the duration of the silent period were reduced during lengthening MVCs for the SOL, but not for the MG. Furthermore, the contrasting corticospinal and spinal modulation between SOL and MG during lengthening MVCs was not related to the initial length of the MG muscle.
MEP input–output curves during isometric and anisometric MVCs
In contrast to isolated muscle in animal where a greater force is usually recorded during lengthening than during isometric contractions when the muscle length is on the plateau and on the descending limb of the length–tension curve (Katz, 1939; Edman et al. 1978; Morgan et al. 2000), our study showed a similar MVC torque for isometric and lengthening contractions but a reduced MVC torque during shortening contractions. This finding, previously reported in some publications (Pinniger et al. 2000; Duclay & Martin, 2005), may be related either to a specific neural activation strategy (Enoka, 1996) or an incomplete activation of the plantarflexor muscles during lengthening contraction (Westing et al. 1991; Ekblom, 2010; see below). However, in our experimental conditions, two main muscle groups were involved, the SOL and the gastrocnemius. The first muscle group is mono-articular, whereas the second one is biarticular meaning that, at least for experiments A and B, the gastrocnemius was at a shorter length compared with the SOL. This may explain why the torque produced by the plantarflexors during the lengthening MVCs was not greater than in isometric contraction. In contrast, when the knee was extended (experiment C), the torque produced during lengthening MVCs tends to be greater (P = 0.08) than during isometric condition (124.6 ± 13.1 vs. 112.1 ± 14.1 N.m). Therefore, the similar torque produced by the plantarflexor muscles during lengthening and isometric MVCs when the knee is flexed must be partly due to the reduced contribution of passive force during lengthening MVC in that condition.
The stimulus intensity necessary to obtain an MEP on the ascending linear part of the input–output curve is generally used to assess corticospinal excitability because it allows an MEP to be either facilitated or depressed (Taylor et al. 1997; Klass et al. 2008; Oya et al. 2008). Nevertheless, at comparable levels of EMG activity, knowledge of the input–output parameters is useful to understand the neural mechanisms involved in task-dependent modulation of the motor cortex (Devanne et al. 1997). In the present study, the influence of muscle contraction type on the size of the SOL MEPs was mainly significant at high stimulus intensities (Fig. 3A), which induce MEPs on or close to the plateau of the input–output curve. This finding justifies the need to record the entire input–output relation in studies on motor cortical task dependence.
Relative modulation of cortical and spinal excitabilities
According to Devanne et al. (1997), the plateau value of the input–output curve reflects the balance between excitatory and inhibitory components of the corticospinal volley. Therefore, our observation of a decrease in MEPmax/Mmax ratio in the SOL during lengthening contractions can be explained by inhibitory mechanisms located at both spinal and cortical levels. As already evoked, this decrease in corticospinal excitability could be associated with a lower level of voluntary activation during the lengthening MVCs. Although voluntary activation may be incomplete because electrical stimulation can sometimes increase muscle torque (Fig. 1), our results do not support this hypothesis because the increment in torque appeared as frequently in shortening as in lengthening contractions. Furthermore, the SOL MEPslope and MEPmax/Mmax ratio were significantly reduced during lengthening MVCs compared with shortening MVCs, despite similar RMS/Mmax ratios during isometric and anisometric contractions.
In contrast to SOL, the MG MEPmax/Mmax ratio was not significantly different during isometric, shortening and lengthening MVCs. The same behaviour was observed regardless of the knee angle, indicating that the difference in corticospinal excitability between the two synergistic muscles was not due to a difference in the initial length of the MG muscle. Therefore, the balance between excitatory and inhibitory components of the corticospinal volley (Devanne et al. 1997) and the responsiveness of the motor neurone pools appear to differ between SOL and MG during anisometric MVCs. Differences between lower and upper limb muscles have previously been reported by Sekiguchi et al. (2007), who compared the modulation of MEP amplitude of the SOL and first dorsal interosseus during anisometric contraction. Therefore, our results indicate that the specific modulation of corticospinal excitability for synergistic muscles could be linked to mechanisms located at both spinal and cortical levels that depend on the muscle being investigated.
To assess potential changes in intracortical inhibition, the silent period was analysed during anisometric and isometric MVCs. The SOL silent period after a maximal MEP was longer than 110 ms, regardless of the contraction type, and was significantly reduced during lengthening compared with isometric and shortening MVCs. As suggested by Inghilleri et al. (1993), silent periods longer than 100 ms are mainly produced by cortical inhibitory mechanisms. As a result, the shorter silent period obtained for SOL during lengthening MVCs may be associated with lower amounts of intracortical inhibition (Orth & Rothwell, 2004). Because the duration of the silent period is correlated with the MEP amplitude during isometric (Orth & Rothwell, 2004) and anisometric contractions (Fig. 5), the shorter silent period during lengthening MVCs may be due to the lower MEP amplitude. However, the shortening of the silent period duration was significantly greater during lengthening than during isometric and shortening MVCs for a similar decrease in MEP amplitude, suggesting that the balance between cortical facilitation and inhibition differs during lengthening contractions. Therefore, our data suggest that cortical excitability was enhanced during lengthening MVCs. This hypothesis agrees with findings of Fang et al. (2004), who found a greater brain area involved in the control process for lengthening compared with shortening contractions. Similarly, Gruber et al. (2009) recently suggested that increased cortical excitability results in extra excitatory descending drive during muscle lengthening to compensate for spinal inhibition. Despite this potential increase in cortical excitability, the responsiveness of the SOL corticospinal pathway, however, was less during lengthening MVCs in our study. This observation suggests that the reduced MEP amplitude in SOL during lengthening contractions is mainly due to the balance between inhibitory and excitatory mechanisms located at the spinal level. Furthermore, changes in the MG MEPmax/Mmax ratios seemed to depend more on the amount of muscle lengthening than initial muscle length due to similar changes in MEP amplitude across knee positions.
Peripheral mechanisms for the decreased spinal excitability during lengthening MVC
It has been reported that spinal pathways to the motoneuronal pools innervating SOL and MG may be organized differently (Schieppati et al. 1990; Nielsen & Kagamihara, 1993), which includes a greater amount of spindle feedback for the SOL than the MG (Tucker & Türker, 2004), which results in different sensitivity to spinal inhibitory mechanisms and greater peripheral inhibition for SOL (Duclay et al. 2009). Although, spinal inhibitory mechanisms involved in MEP and H-reflex modulations differ (Nielsen & Petersen, 1994), the two primary mechanisms that could explain the lower spinal excitability during lengthening MVCs operate at both pre- and postsynaptic levels (Abbruzzese et al. 1994; Petersen et al. 2007). Because the corticospinal synapses appear to lack presynaptic inhibition (Nielsen & Petersen, 1994), the lower recruitment gain of the MEP observed during lengthening MVCs could be due to a reduced responsiveness of the motor neurone pool to the descending input (Gruber et al. 2009). Since the MG MEPslope was significantly lower during lengthening than during isometric MVCs despite a similar H-reflex during both contraction types, we hypothesize that spinal excitability is partly controlled by postsynaptic inhibitory mechanisms (Petersen et al. 2007).
As classically described (Pinniger et al. 2001; Nordlund et al. 2002; Duclay & Martin, 2005), the SOL H-reflex amplitude is reduced during passive muscle lengthening, thus reinforcing the proposal that peripheral inhibitory mechanisms are involved during such action. At rest, this reduced spinal excitability is mainly attributed to presynaptic inhibitory mechanisms (Pinniger et al. 2001; Duclay et al. 2009), which can be induced by enhanced activity of the Ia afferents themselves (Burke et al. 1978), to lower spinal efficacy (homosynaptic post-activation depression; Hultborn et al. 1987) or associated with primary afferent depolarizing interneurones (Rudomin & Schmidt, 1999). In the current study, submaximal H-reflex (H80) was investigated during isometric and anisometric MVCs because it lies on the ascending part of the H-reflex recruitment curve and is thus more sensitive to increases or decreases than maximal H-reflex (Hmax) (see Pierrot-Deseilligny & Burke, 2005). However, similar adjustments were observed for submaximal and maximal SOL H-reflex suggesting that Hmax was not saturated and can be used to investigate changes in spinal excitability during MVCs.
When subjects performed an MVC, the decrease in spinal excitability observed during passive lengthening actions was reduced, but for the SOL it was still lower during lengthening than during isometric and shortening MVCs. As axons threshold to electrical stimulation is known to increase after voluntary MVCs of 15–60 s (Vagg et al. 1998), it can be argued that this effect may have influenced the results. However, in the current study the duration of the MVC was much briefer (∼2 s before H-reflex was evoked) and, the MHmax/Mmax ratio remained constant across contraction types and did not differ significantly between passive ankle movement and MVCs. These observations, in addition to the fact that sensory axons are less susceptible to activity-dependent hyperpolarization than motor axons (Vagg et al. 1998), indicate that the decreased H-reflex response during lengthening MVC is due to a specific neural control. Because the amount of coactivation was similar for all contraction types (∼14%), reciprocal inhibition cannot be responsible for the lower spinal excitability of SOL during lengthening MVCs. Despite presynaptic inhibition of Ia terminals being depressed by the descending neural drive during muscle contractions (Meunier & Pierrot-Deseilligny, 1998; Stein et al. 2007), this modulation was not sufficient to outweigh the inhibition caused by the lengthening of the SOL muscle. In contrast, the lack of modulation of the MG Hmax/Mmax ratio, for all contraction types, suggests that the reduction in peripheral inhibition can be compensated by the action of the descending neural drive on the spinal loop. Nevertheless, this regulation of the spinal excitability does not appear to be associated with change in cortical inhibition because the silent period did not differ significantly between isometric and anisometric MVCs. Although our data do not shed light on the precise control mechanisms, the comparison of the MEP and H-reflex modulation between SOL and MG confirms the hypothesis that the change in corticospinal excitability depends mainly on the amount of peripheral inhibition induced by muscle lengthening. Both pre- and postsynaptic inhibitory mechanisms appear to be involved in the specific neural control of lengthening MVCs.
The absence of specific modulation for MG was not due to the muscle being in a slack length at a knee angle of 60 deg, which could have reduced its length-dependent modulation during movement, as the results did not depend on the initial length of MG. Indeed, the changes in MEP and H-reflex ratios during anisometric MVCs were similar for the two knee angles for both SOL and MG. Furthermore, De Luca & Erim, (2002) suggested that synergistic muscles receive a common drive during isometric contractions, which comprises two parts, one that is shared between the two muscles and one that is specific to the given muscle. Findings from the present study show that plantarflexor muscles (SOL and MG) are not controlled as a single functional unit during lengthening MVCs. Spinal mechanisms, such as peripheral inhibition, are likely to modulate the common drive across synergist muscles during anisometric contractions.
In conclusion, the changes in MEP and H-reflex amplitudes during lengthening MVCs in both SOL and MG suggest that modulation of corticospinal excitability depends mainly on pre- and postsynaptic inhibitory mechanisms acting at the spinal level. The study further indicates that the specific modulation observed during lengthening MVCs differs, however, between synergist muscles.
Acknowledgments
This study was supported by the Université Libre de Bruxelles and the Fonds National de la Recherche Scientifique (FRS-FNRS) of Belgium.
Glossary
Abbreviations
- CMEP
cervicomedullary motor-evoked potential
- MEP
motor evoked potential
- MG
medial gastrocnemius
- MVC
maximal voluntary contraction
- SOL
Soleus
- TA
tibialis anterior
- TMS
transcranial magnetic stimulation
Author contributions
Each author contributed to all aspects of the study. The experiments were conducted in the Laboratory of Applied Biology of the Université Libre de Bruxelles, Belgium.
References
- Aagaard P, Simonsen EB, Andersen JL, Magnusson SP, Halkjaer-Kristensen J, Dyhre-Poulsen P. Neural inhibition during maximal eccentric and concentric quadriceps contraction: effects of resistance training. J Appl Physiol. 2000;89:2249–2257. doi: 10.1152/jappl.2000.89.6.2249. [DOI] [PubMed] [Google Scholar]
- Abbruzzese G, Morena M, Spadavecchia L, Schieppati M. Response of arm flexor muscles to magnetic and electrical brain stimulation during shortening and lengthening tasks in man. J Physiol. 1994;481:499–507. doi: 10.1113/jphysiol.1994.sp020458. [DOI] [PMC free article] [PubMed] [Google Scholar]
- Altenburg TM, de Ruiter CJ, Verdijk PW, van Mechelen W, de Haan A. Vastus lateralis surface and single motor unit electromyography during shortening, lengthening and isometric contractions corrected for mode-dependent differences in force-generating capacity. Acta Physiol. 2009;196:315–328. doi: 10.1111/j.1748-1716.2008.01941.x. [DOI] [PubMed] [Google Scholar]
- Amiridis IG, Martin A, Morlon B, Martin L, Cometti G, Pousson M, van Hoecke J. Co-activation and tension-regulating phenomena during isokinetic knee extension in sedentary and highly skilled humans. Eur J Appl Physiol Occup Physiol. 1996;73:149–156. doi: 10.1007/BF00262824. [DOI] [PubMed] [Google Scholar]
- Aymard C, Katz R, Lafitte C, Lo E, Penicaud A, Pradat-Diehl P, Raoul S. Presynaptic inhibition and homosynaptic depression: a comparison between lower and upper limbs in normal human subjects and patients with hemiplegia. Brain. 2000;123:1688–1702. doi: 10.1093/brain/123.8.1688. [DOI] [PubMed] [Google Scholar]
- Burke D, Hagbarth KE, Lofstedt L. Muscle spindle activity in man during shortening and lengthening contractions. J Physiol. 1978;277:131–142. doi: 10.1113/jphysiol.1978.sp012265. [DOI] [PMC free article] [PubMed] [Google Scholar]
- Chen R, Lozano AM, Ashby P. Mechanism of the silent period following transcranial magnetic stimulation. Evidence from epidural recordings. Exp Brain Res. 1999;128:539–542. doi: 10.1007/s002210050878. [DOI] [PubMed] [Google Scholar]
- De Luca CJ, Erim Z. Common drive in motor units of a synergistic muscle pair. J Neurophysiol. 2002;87:2200–2204. doi: 10.1152/jn.00793.2001. [DOI] [PubMed] [Google Scholar]
- Devanne H, Lavoie BA, Capaday C. Input-output properties and gain changes in the human corticospinal pathway. Exp Brain Res. 1997;114:329–338. doi: 10.1007/pl00005641. [DOI] [PubMed] [Google Scholar]
- Duchateau J, Enoka RM. Neural control of shortening and lengthening contractions: influence of task constraints. J Physiol. 2008;586:5853–5864. doi: 10.1113/jphysiol.2008.160747. [DOI] [PMC free article] [PubMed] [Google Scholar]
- Duclay J, Martin A. Evoked H-reflex and V-wave responses during maximal isometric, concentric, and eccentric muscle contraction. J Neurophysiol. 2005;94:3555–3562. doi: 10.1152/jn.00348.2005. [DOI] [PubMed] [Google Scholar]
- Duclay J, Martin A, Robbe A, Pousson M. Spinal reflex plasticity during maximal dynamic contractions after eccentric training. Med Sci Sports Exerc. 2008;40:722–734. doi: 10.1249/MSS.0b013e31816184dc. [DOI] [PubMed] [Google Scholar]
- Duclay J, Robbe A, Pousson M, Martin A. Effect of angular velocity on soleus and medial gastrocnemius H-reflex during maximal concentric and eccentric muscle contraction. J Electromyogr Kinesiol. 2009;19:948–956. doi: 10.1016/j.jelekin.2008.04.011. [DOI] [PubMed] [Google Scholar]
- Edman KA, Elzinga G, Noble MI. Enhancement of mechanical performance by stretch during tetanic contractions of vertebrate skeletal muscle fibres. J Physiol. 1978;281:139–155. doi: 10.1113/jphysiol.1978.sp012413. [DOI] [PMC free article] [PubMed] [Google Scholar]
- Ekblom MM. Improvements in dynamic plantar flexor strength after resistance training are associated with increased voluntary activation and V-to-M ratio. J Appl Physiol. 2010;109:19–26. doi: 10.1152/japplphysiol.01307.2009. [DOI] [PubMed] [Google Scholar]
- Enoka RM. Eccentric contractions require unique activation strategies by the nervous system. J Appl Physiol. 1996;81:2339–2346. doi: 10.1152/jappl.1996.81.6.2339. [DOI] [PubMed] [Google Scholar]
- Fang Y, Siemionow V, Sahgal V, Xiong F, Yue GH. Distinct brain activation patterns for human maximal voluntary eccentric and concentric muscle actions. Brain Res. 2004;1023:200–212. doi: 10.1016/j.brainres.2004.07.035. [DOI] [PubMed] [Google Scholar]
- Garner JC, Blackburn T, Weimar W, Campbell B. Comparison of electromyographic activity during eccentrically versus concentrically loaded isometric contractions. J Electromyogr Kinesiol. 2008;18:466–471. doi: 10.1016/j.jelekin.2006.11.006. [DOI] [PubMed] [Google Scholar]
- Gerilovsky L, Tsvetinov P, Trenkova G. Peripheral effects on the amplitude of monopolar and bipolar H-reflex potentials from the soleus muscle. Exp Brain Res. 1989;76:173–181. doi: 10.1007/BF00253634. [DOI] [PubMed] [Google Scholar]
- Gruber M, Linnamo V, Strojnik V, Rantalainen T, Avela J. Excitability at the motoneuron pool and motor cortex is specifically modulated in lengthening compared to isometric contractions. J Neurophysiol. 2009;101:2030–2040. doi: 10.1152/jn.91104.2008. [DOI] [PubMed] [Google Scholar]
- Hagood S, Solomonow M, Baratta R, Zhou BH, D'Ambrosia R. The effect of joint velocity on the contribution of the antagonist musculature to knee stiffness and laxity. Am J Sports Med. 1990;18:182–187. doi: 10.1177/036354659001800212. [DOI] [PubMed] [Google Scholar]
- Hermens HJ, Freriks B, Disselhorst-Klug C, Rau G. Development of recommendations for SEMG sensors and sensor placement procedures. J Electromyogr Kinesiol. 2000;10:361–374. doi: 10.1016/s1050-6411(00)00027-4. [DOI] [PubMed] [Google Scholar]
- Hultborn H, Meunier S, Morin C, Pierrot-Deseilligny E. Assessing changes in presynaptic inhibition of I a fibres: a study in man and the cat. J Physiol. 1987;389:729–756. doi: 10.1113/jphysiol.1987.sp016680. [DOI] [PMC free article] [PubMed] [Google Scholar]
- Inghilleri M, Berardelli A, Cruccu G, Manfredi M. Silent period evoked by transcranial stimulation of the human cortex and cervicomedullary junction. J Physiol. 1993;466:521–534. [PMC free article] [PubMed] [Google Scholar]
- Katz B. The relation between force and speed in muscular contraction. J Physiol. 1939;96:45–64. doi: 10.1113/jphysiol.1939.sp003756. [DOI] [PMC free article] [PubMed] [Google Scholar]
- Klass M, Levenez M, Enoka RM, Duchateau J. Spinal mechanisms contribute to differences in the time to failure of submaximal fatiguing contractions performed with different loads. J Neurophysiol. 2008;99:1096–1104. doi: 10.1152/jn.01252.2007. [DOI] [PubMed] [Google Scholar]
- Komi PV, Linnamo V, Silventoinen P, Sillanpaa M. Force and EMG power spectrum during eccentric and concentric actions. Med Sci Sports Exerc. 2000;32:1757–1762. doi: 10.1097/00005768-200010000-00015. [DOI] [PubMed] [Google Scholar]
- Lewis GN, Byblow WD, Carson RG. Phasic modulation of corticomotor excitability during passive movement of the upper limb: effects of movement frequency and muscle specificity. Brain Res. 2001;900:282–294. doi: 10.1016/s0006-8993(01)02369-1. [DOI] [PubMed] [Google Scholar]
- Linnamo V, Bottas R, Komi PV. Force and EMG power spectrum during and after eccentric and concentric fatigue. J Electromyogr Kinesiol. 2000;10:293–300. doi: 10.1016/s1050-6411(00)00021-3. [DOI] [PubMed] [Google Scholar]
- Linnamo V, Moritani T, Nicol C, Komi PV. Motor unit activation patterns during isometric, concentric and eccentric actions at different force levels. J Electromyogr Kinesiol. 2003;13:93–101. doi: 10.1016/s1050-6411(02)00063-9. [DOI] [PubMed] [Google Scholar]
- Loscher WN, Nordlund MM. Central fatigue and motor cortical excitability during repeated shortening and lengthening actions. Muscle Nerve. 2002;25:864–872. doi: 10.1002/mus.10124. [DOI] [PubMed] [Google Scholar]
- Martin PG, Gandevia SC, Taylor JL. Output of human motoneuron pools to corticospinal inputs during voluntary contractions. J Neurophysiol. 2006;95:3512–3518. doi: 10.1152/jn.01230.2005. [DOI] [PubMed] [Google Scholar]
- Merletti R, Rainoldi A, Farina D. Surface electromyography for noninvasive characterization of muscle. Exerc Sport Sci Rev. 2001;29:20–25. doi: 10.1097/00003677-200101000-00005. [DOI] [PubMed] [Google Scholar]
- Morgan DL, Whitehead NP, Wise AK, Gregory JE, Proske U. Tension changes in the cat soleus muscle following slow stretch or shortening of the contracting muscle. J Physiol. 2000;522:503–513. doi: 10.1111/j.1469-7793.2000.t01-2-00503.x. [DOI] [PMC free article] [PubMed] [Google Scholar]
- Meunier S, Pierrot-Deseilligny E. Cortical control of presynaptic inhibition of Ia afferents in humans. Exp Brain Res. 1998;119:415–426. doi: 10.1007/s002210050357. [DOI] [PubMed] [Google Scholar]
- Nakamura H, Kitagawa H, Kawaguchi Y, Tsuji H. Intracortical facilitation and inhibition after transcranial magnetic stimulation in conscious humans. J Physiol. 1997;498:817–823. doi: 10.1113/jphysiol.1997.sp021905. [DOI] [PMC free article] [PubMed] [Google Scholar]
- Nielsen J, Kagamihara Y. The regulation of presynaptic inhibition during co-contraction of antagonistic muscles in man. J Physiol. 1993;464:575–593. doi: 10.1113/jphysiol.1993.sp019652. [DOI] [PMC free article] [PubMed] [Google Scholar]
- Nielsen J, Petersen N. Is presynaptic inhibition distributed to corticospinal fibres in man? J Physiol. 1994;477:47–58. doi: 10.1113/jphysiol.1994.sp020170. [DOI] [PMC free article] [PubMed] [Google Scholar]
- Nordlund MM, Thorstensson A, Cresswell AG. Variations in the soleus H-reflex as a function of activation during controlled lengthening and shortening actions. Brain Res. 2002;952:301–307. doi: 10.1016/s0006-8993(02)03259-6. [DOI] [PubMed] [Google Scholar]
- Orth M, Rothwell JC. The cortical silent period: intrinsic variability and relation to the waveform of the transcranial magnetic stimulation pulse. Clin Neurophysiol. 2004;115:1076–1082. doi: 10.1016/j.clinph.2003.12.025. [DOI] [PubMed] [Google Scholar]
- Oya T, Hoffman BW, Cresswell AG. Corticospinal-evoked responses in lower limb muscles during voluntary contractions at varying strengths. J Appl Physiol. 2008;105:1527–1532. doi: 10.1152/japplphysiol.90586.2008. [DOI] [PubMed] [Google Scholar]
- Pasquet B, Carpentier A, Duchateau J, Hainaut K. Muscle fatigue during concentric and eccentric contractions. Muscle Nerve. 2000;23:1727–1735. doi: 10.1002/1097-4598(200011)23:11<1727::aid-mus9>3.0.co;2-y. [DOI] [PubMed] [Google Scholar]
- Petersen NT, Butler JE, Carpenter MG, Cresswell AG. Ia-afferent input to motoneurons during shortening and lengthening muscle contractions in humans. J Appl Physiol. 2007;102:144–148. doi: 10.1152/japplphysiol.00362.2006. [DOI] [PubMed] [Google Scholar]
- Pierrot-Deseilligny E, Burke DC. The Circuitry of the Human Spinal Cord: Its Role in Motor Control and Movement Disorders. Cambridge: Cambridge University Press; 2005. [Google Scholar]
- Pinniger GJ, Nordlund M, Steele JR, Cresswell AG. H-reflex modulation during passive lengthening and shortening of the human triceps surae. J Physiol. 2001;534:913–923. doi: 10.1111/j.1469-7793.2001.00913.x. [DOI] [PMC free article] [PubMed] [Google Scholar]
- Pinniger GJ, Steele JR, Thorstensson A, Cresswell AG. Tension regulation during lengthening and shortening actions of the human soleus muscle. Eur J Appl Physiol. 2000;81:375–383. doi: 10.1007/s004210050057. [DOI] [PubMed] [Google Scholar]
- Romano C, Schieppati M. Reflex excitability of human soleus motoneurones during voluntary shortening or lengthening contractions. J Physiol. 1987;390:271–284. doi: 10.1113/jphysiol.1987.sp016699. [DOI] [PMC free article] [PubMed] [Google Scholar]
- Rothwell JC, Thompson PD, Day BL, Boyd S, Marsden CD. Stimulation of the human motor cortex through the scalp. Exp Physiol. 1991;76:159–200. doi: 10.1113/expphysiol.1991.sp003485. [DOI] [PubMed] [Google Scholar]
- Rudomin P, Schmidt RF. Presynaptic inhibition in the vertebrate spinal cord revisited. Exp Brain Res. 1999;129:1–37. doi: 10.1007/s002210050933. [DOI] [PubMed] [Google Scholar]
- Sacco P, Thickbroom GW, Thompson ML, Mastaglia FL. Changes in corticomotor excitation and inhibition during prolonged submaximal muscle contractions. Muscle Nerve. 1997;20:1158–1166. doi: 10.1002/(sici)1097-4598(199709)20:9<1158::aid-mus11>3.0.co;2-p. [DOI] [PubMed] [Google Scholar]
- Schieppati M. The Hoffmann reflex: a means of assessing spinal reflex excitability and its descending control in man. Prog Neurobiol. 1987;28:345–376. doi: 10.1016/0301-0082(87)90007-4. [DOI] [PubMed] [Google Scholar]
- Schieppati M, Romano C, Gritti I. Convergence of Ia fibres from synergistic and antagonistic muscles onto interneurones inhibitory to soleus in humans. J Physiol. 1990;431:365–377. doi: 10.1113/jphysiol.1990.sp018334. [DOI] [PMC free article] [PubMed] [Google Scholar]
- Sekiguchi H, Kohno Y, Hirano T, Akai M, Nakajima Y, Nakazawa K. Modulation of corticospinal excitability during lengthening and shortening contractions in the first dorsal interosseus muscle of humans. Exp Brain Res. 2007;178:374–384. doi: 10.1007/s00221-006-0743-9. [DOI] [PubMed] [Google Scholar]
- Sekiguchi H, Nakazawa K, Suzuki S. Differences in recruitment properties of the corticospinal pathway between lengthening and shortening contractions in human soleus muscle. Brain Res. 2003;977:169–179. doi: 10.1016/s0006-8993(03)02621-0. [DOI] [PubMed] [Google Scholar]
- Stein RB, Estabrooks KL, McGie S, Roth MJ, Jones KE. Quantifying the effects of voluntary contraction and inter-stimulus interval on the human soleus H-reflex. Exp Brain Res. 2007;182:309–319. doi: 10.1007/s00221-007-0989-x. [DOI] [PMC free article] [PubMed] [Google Scholar]
- Taylor JL. Stimulation at the cervicomedullary junction in human subjects. J Electromyogr Kinesiol. 2006;16:215–223. doi: 10.1016/j.jelekin.2005.07.001. [DOI] [PubMed] [Google Scholar]
- Taylor JL, Allen GM, Butler JE, Gandevia SC. Effect of contraction strength on responses in biceps brachii and adductor pollicis to transcranial magnetic stimulation. Exp Brain Res. 1997;117:472–478. doi: 10.1007/s002210050243. [DOI] [PubMed] [Google Scholar]
- Taylor JL, Gandevia SC. Noninvasive stimulation of the human corticospinal tract. J Appl Physiol. 2004;96:1496–1503. doi: 10.1152/japplphysiol.01116.2003. [DOI] [PubMed] [Google Scholar]
- Tucker KJ, Türker KS. Muscle spindle feedback differs between the soleus and gastrocnemius in humans. Somatosens Mot Res. 2004;21:189–197. doi: 10.1080/08990220400012489. [DOI] [PubMed] [Google Scholar]
- Ugawa Y, Rothwell JC, Day BL, Thompson PD, Marsden CD. Percutaneous electrical stimulation of corticospinal pathways at the level of the pyramidal decussation in humans. Ann Neurol. 1991;29:418–427. doi: 10.1002/ana.410290413. [DOI] [PubMed] [Google Scholar]
- Upton AR, McComas AJ, Sica RE. Potentiation of ‘late’ responses evoked in muscles during effort. J Neurol Neurosurg Psychiatry. 1971;34:699–711. doi: 10.1136/jnnp.34.6.699. [DOI] [PMC free article] [PubMed] [Google Scholar]
- Vagg R, Mogyoros I, Kiernan MC, Burke D. Activity-dependent hyperpolarization of human motor axons produced by natural activity. J Physiol. 1998;507:919–925. doi: 10.1111/j.1469-7793.1998.919bs.x. [DOI] [PMC free article] [PubMed] [Google Scholar]
- Westing SH, Cresswell AG, Thorstensson A. Muscle activation during maximal voluntary eccentric and concentric knee extension. Eur J Appl Physiol Occup Physiol. 1991;62:104–108. doi: 10.1007/BF00626764. [DOI] [PubMed] [Google Scholar]