Abstract
We investigated the ability of honeybees to learn mazes of four types: constant-turn mazes, in which the appropriate turn is always in the same direction in each decision chamber; zig-zag mazes, in which the appropriate turn is alternately left and right in successive decision chambers; irregular mazes, in which there is no readily apparent pattern to the turns; and variable irregular mazes, in which the bees were trained to learn several irregular mazes simultaneously. The bees were able to learn to navigate all four types of maze. Performance was best in the constant-turn mazes, somewhat poorer in the zig-zag mazes, poorer still in the irregular mazes, and poorest in the variable irregular mazes. These results demonstrate that bees do not navigate such mazes simply by memorizing the entire sequence of appropriate turns. Rather, performance in the various configurations depends on the existence of regularity in the structure of the maze and on the ease with which this regularity is recognized and learned.
Studies of the ability of animals to learn mazes have provided useful insights into the mechanisms underlying orientation and navigation (e.g., Munn 1950; Olton 1977; Gallistel 1990; Collett and Zeil 1998; Healy 1998). Much of the work on complex maze learning, however, has been carried out primarily with rats and has a long history (e.g., Munn 1950). Relatively little is known about the maze-learning abilities of invertebrates.
Here we explore maze learning in honeybees. This study builds on an earlier investigation (Zhang et al. 1996) that examined the ability of bees to navigate through complex labyrinths. There it was shown that bees can be trained to navigate through such labyrinths by (a) following a color mark or by (b) using color as a symbolic indicator of turning direction. It was also shown that bees can learn to navigate through unmarked labyrinths.
The bees' performance in the unmarked labyrinths was not as good as that in (a) or (b), where there was information on the appropriate turn to be made at each stage in the labyrinth. This is because the only way that a bee can navigate an unmarked labyrinth, in general, is to memorize the path through it; that is, to memorize the entire sequence of turns that is necessary to go through the labyrinth successfully.
It is conceivable, however, that some unmarked mazes are easier to learn than others. For example, mazes that possess a regular pattern might be learned more readily than those that do not if bees possess the ability to recognize such patterns. Here we explore this question by investigating the ability of bees to learn unmarked mazes of various configurations.
RESULTS
Constant-Turn Maze
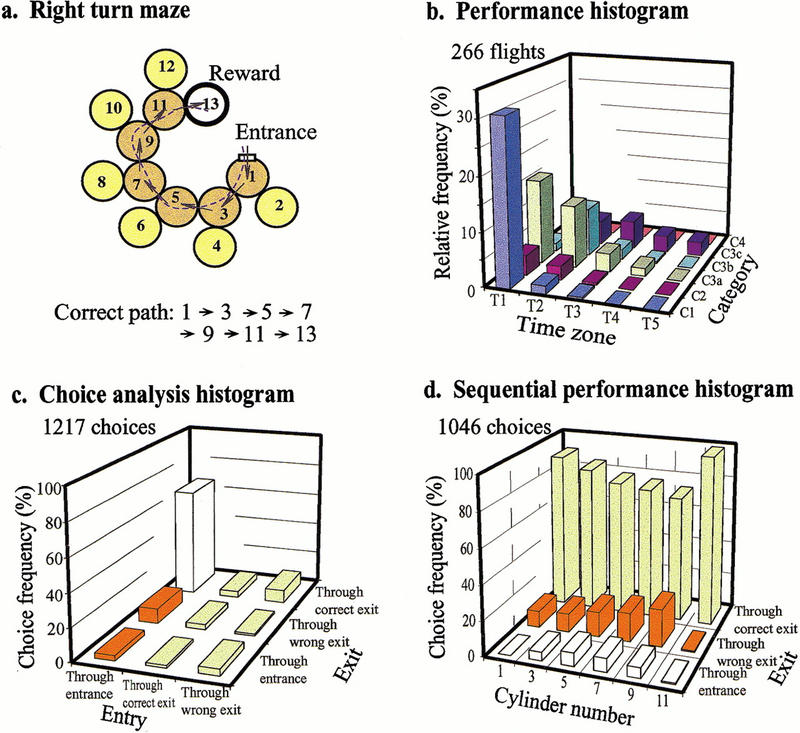
In the first series of experiments, we investigated whether bees could learn to negotiate a maze in which every turn is to be made in the same direction. A right-turn maze is shown in Figure 1a. The performance of bees trained on this maze for 1 d and then tested in an identical maze is shown in Figure 1b–d. The performance histogram (Fig. 1b) shows that most flights have a relatively short duration (T1: flight duration <30 seconds) and that most of the test flights belong to the category C1 (no errors). Thus, the trained bees are able to fly through the maze quickly and accurately. The performance indices are (T = 1.78, C = 2.28). A typical trajectory of a trained bee is shown in Figure 1a. The choice analysis histogram (Fig. 1c) shows a detailed analysis of the trained bees' decisions. It shows a comparison of the choices that bees make when they enter a decision chamber in different ways: via the entrance, via the correct exit, or via the wrong exit. This histogram reveals that most of the time, a bee enters the decision chamber via the proper entrance and chooses the correct exit. The bees show a significant preference for the correct exit (P < 0.001). There are relatively few instances in which bees enter via one of the exits. Even when bees enter a chamber in one of these incorrect ways, they tend to choose the correct exit (Fig. 1c, columns 2 and 3). Trained bees seldom trace their way back through the maze, as shown by the relatively low frequency of occurrence of flights in category 2 (C2, Fig. 1b). The sequential performance histogram (Fig. 1d) quantifies the trained bees' choice performance at each decision chamber along the way to the goal, when the chamber is entered via the entrance. Clearly, the bees display a strong tendency to choose the correct exit at each stage of the maze.
Figure 1.
Learning performance in a constant-turn maze. (a) Configuration of right-turn maze. (b) Performance histogram showing the distribution of flights in various categories as described in the text. The bar corresponding to categories T1, C1 shows the percentage of quickest, error-free flights. (c) Choice analysis histogram showing the relative frequencies of choices averaged over all decision chambers. (d) Sequential performance histogram showing relative frequencies of choices made in each decision chamber on the route to the goal.
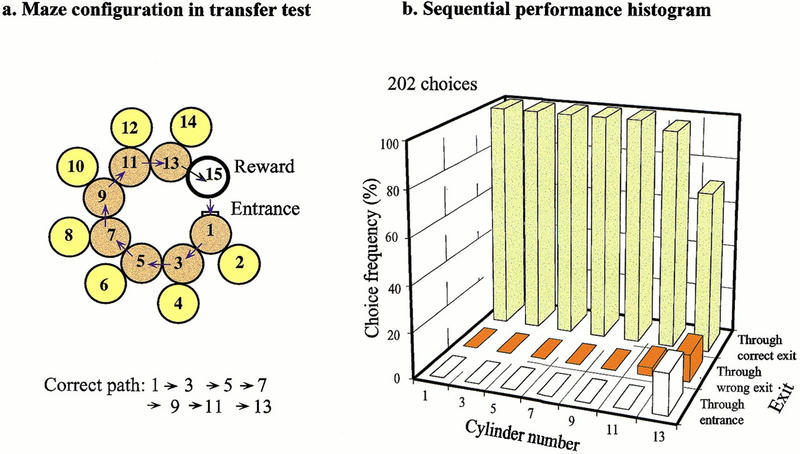
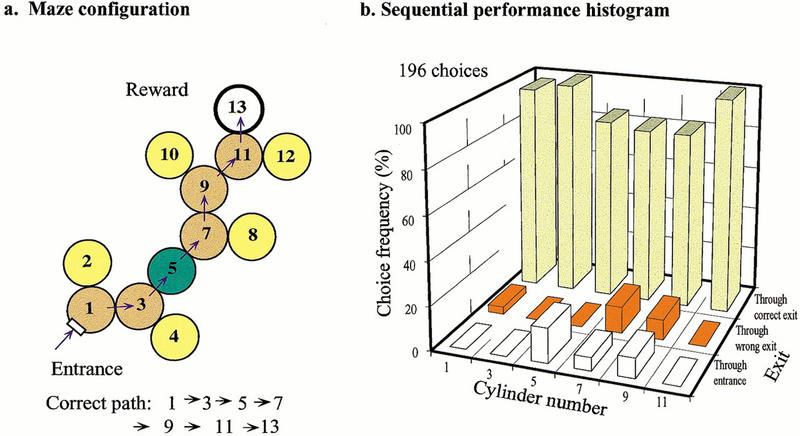
Bees trained in the right-turn maze of Figure 1a were tested on an extended right-turn maze with an additional decision chamber added at the end, also requiring a right turn (Fig. 2a). As shown by the sequential performance histogram in Figure 2b, these bees showed a clear tendency to make correct choices (right turns) even in the extension (decision chamber 13), indicating that they applied the rule they had learned during the training to the extended part of the maze in this test.
Figure 2.
(a) Transfer test in which bees trained in the right-turn maze shown in Fig. 1, are tested in an extended right-turn maze. (b) Sequential performance histogram showing relative frequencies of choices made in each decision chamber, including the additional chamber 13.
Results very similar to those shown in Figure 1 were obtained when bees were trained in a left-turn maze. That is, bees can learn to negotiate a left-turn maze just as well as a right-turn maze (data not shown).
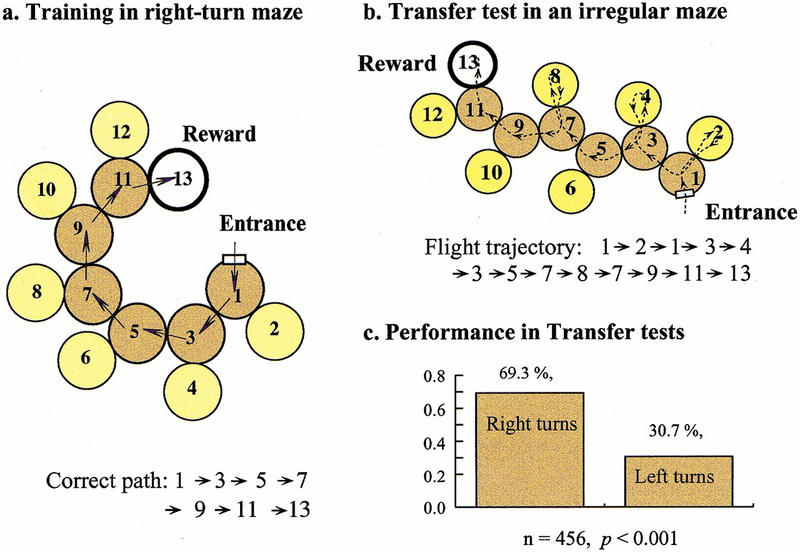
Finally, bees trained in a right-turn maze were tested in an irregular maze, which they had never experienced (Fig. 3). Interestingly, these bees succeeded in arriving at the feeder, as shown by the sample trajectory in Figure 3b. They achieved this simply by using the ‘always turn right’ rule, which always made them reach the goal eventually, even if they entered some dead-end chambers en route. The relative frequencies of right and left turns made by the trained bees when tested in a number of irregular mazes are shown in Figure 3c. Bees trained in a right-turn maze can also negotiate left-turn and zig-zag mazes because the right-turn rule (or left-turn rule, for that matter) can, in principle, be applied to all of these mazes to get to the reward eventually, even though this entails entering a number of dead-end cylinders en route.
Figure 3.
Example of a flight trajectory of a bee trained in a right-turn maze (a) and subsequently tested in an irregular maze (b). Relative frequencies of right and left turns made by the trained bees when tested in a number of irregular mazes are shown in (c).
Zig-Zag Maze
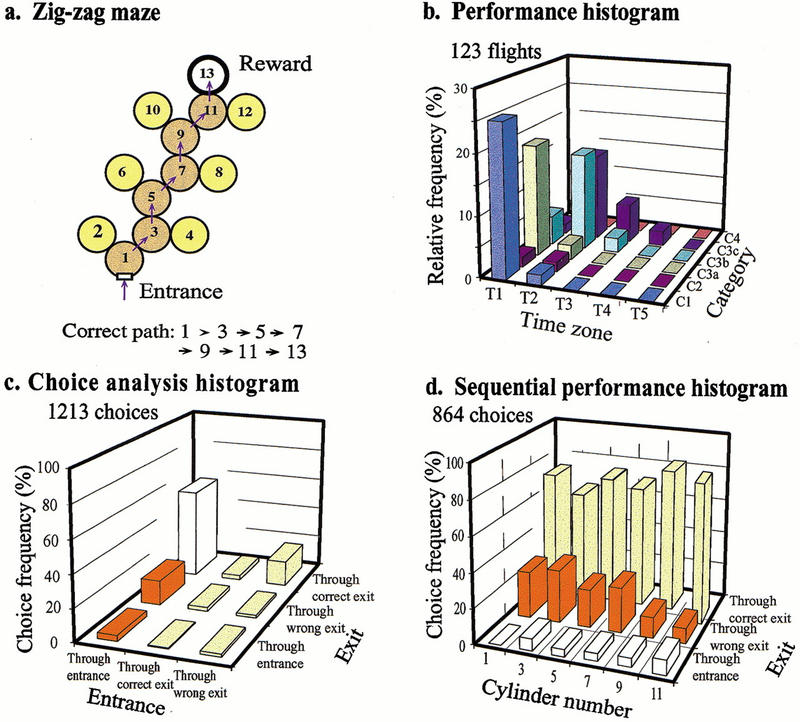
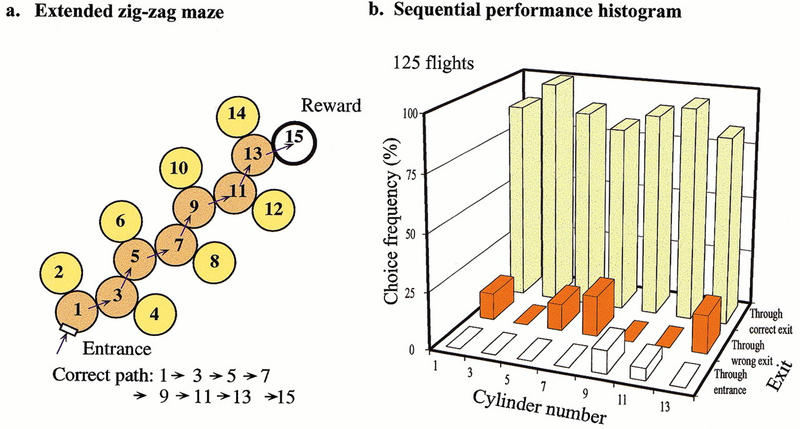
In another series of experiments, bees were trained in a zig-zag maze, where the correct turns were alternately to the right and to the left, as shown in Figure 4a. The performance of bees trained on this maze for 10 h and tested in an identical maze is shown in Figure 4b–d. The results show that bees learn this maze well, too. In fact, bees appear to learn a zig-zag maze nearly as well as a maze in which they are required to turn in the same direction consistently. The performance indices are (T = 1.62, C = 2.41). The choice analysis histogram (Fig. 4c) shows that 56.0% of the time, a bee enters the decision chamber via the proper entrance and chooses the correct exit. The bees show a significant preference for the correct exit (P < 0.001). The sequential performance histogram (Fig. 4d) reveals that the trained bees perform approximately uniformly well all through the maze.
Figure 4.
Learning performance in a zig-zag maze. Details as in Fig. 1.
Can bees extrapolate the zig-zag rule that they have learned and apply it to extended or altered mazes? We investigated this question by testing the bees that were trained in the zig-zag maze of Fig. 4a in three altered mazes.
In one kind of test, the trained bees were tested in an extended version of the maze of Figure 4a, which incorporated one additional decision chamber (chamber 13) at the end (Fig. 5a). The bees negotiated the extended maze equally well, as shown by the sequential performance histogram (Fig. 5b). Even in chamber 13 the bees showed a clear tendency to choose the correct exit (the right-hand exit in this case), which is the opposite of the choice that they had made in the previous decision chamber (chamber 11). Clearly, bees are able to learn the zig-zag rule and extrapolate it to successfully negotiate extensions of the maze.
Figure 5.
Transfer test in which bees trained in a zig-zag maze, as in Fig. 4, are tested in an extended zig-zag maze as shown in (a). (b) Performance in the transfer test, as revealed by a sequential performance histogram.
In another kind of test, bees were tested in a maze similar to that of Figure 5a, but one in which an additional chamber (chamber 5) was added in the middle, as shown in Figure 6a. However, this new chamber had only one exit, diametrically opposite to the entrance, so that the bees could not choose to go left or right while passing through it. The question here was, How did the bees behave in the next chamber (chamber 7), given that they had made a left turn in the previous chamber (chamber 3)? The tests (Fig. 6b) revealed that the bees showed a clear tendency to turn left in chamber 7. This implies that they had treated chamber 5 as though they had made a right turn in it, even though it was a dummy chamber that offered no turning choice. Evidently, in applying the zig-zag rule, even dummy chambers are treated as valid ones.
Figure 6.
Transfer test in which bees trained in a zig-zag maze, as in Fig. 4, are tested in an augmented zig-zag maze in which cylinder 5 has only one exit, as shown in (a). (b) Performance in the transfer test, as revealed by a sequential performance histogram. Note that in cylinder 5 there is no wrong exit.
Irregular Maze
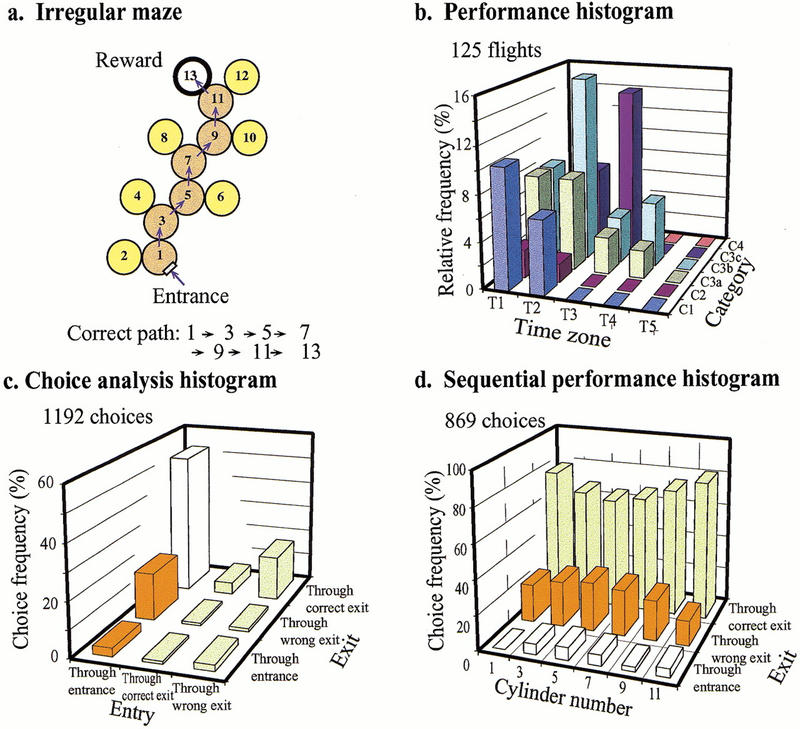
In a third series of experiments, bees were trained to fly through an irregular maze, one that had no obviously regular pattern of turns (Fig. 7a). The performance of these bees, trained on this maze for 12 h and tested in an identical maze, is shown in Figure 7b–d. The performance histogram (Fig. 7b) is poorer than that of bees trained in the constant-turn maze or the zig-zag maze. The performance index is (T = 2.06, C = 2.6). Performance, as measured by the choice analysis histogram (Fig. 7c), shows that 52.9% of time, a bee enters the decision chamber via the proper entrance and chooses the correct exit. The bees show a significant preference for the correct exit (P < 0.001). This performance is comparable to that of bees trained in the zig-zag maze but is inferior to that in the right-turn maze. The sequential performance histogram (Fig. 7d) reveals a performance that is comparable to that in the zig-zag maze (Fig. 4d) but poorer than that in the constant-turn maze (Fig. 1d). This histogram also reveals that the bees' choice performance is slightly poorer in the middle of the maze than at the beginning or at the end.
Figure 7.
Learning performance in an irregular maze. Details as in Fig. 1.
Variable Irregular Maze
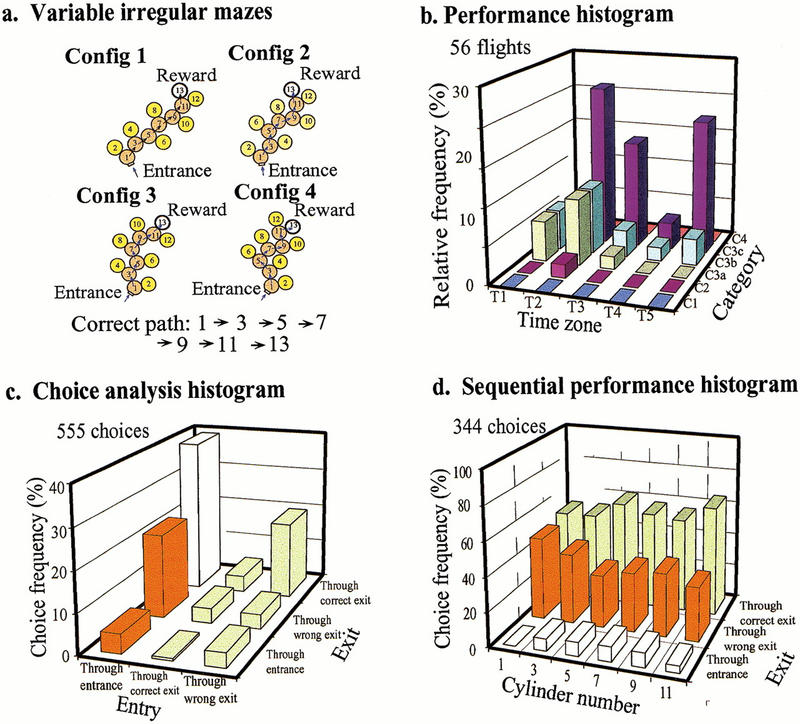
In a final series of experiments, we asked whether bees can learn four irregular mazes simultaneously. The details of the training procedure are described in Materials and Methods. The learning tests were commenced after 20 h of training. The results, pooled over performance in all four mazes, are shown in Figure 8. The performance histogram (Fig. 8b) reveals that bees are not able to learn four irregular mazes as well as just one. The performance indices are (T = 2.8, C = 2.98). This is, of course, understandable. The choice analysis histogram (Fig. 8c) shows that 35.7% of the time, a bee enters the decision chamber via the proper entrance and chooses the correct exit. Bees show a marginal preference for the correct exit (0.05 < P < 0.10) when they enter the decision chamber through the proper entrance. This must mean that the bees are showing a marginal ability to learn each maze separately; otherwise, they would have chosen the correct and wrong exits equally often. The sequential performance histogram (Fig. 8d; data pooled over all four mazes) shows that choice performance is poor at the beginning of the maze but improves at later stages. This is to be expected, as the bees do not know a priori in the tests which maze they are entering: The identity of the maze can only become evident to them from the pattern of errors and correct choices that they make as they progress through the maze. Thus, bees choose randomly in the first decision chamber: The frequency of correct choices is 51.8%, which is not significantly different from random choice (P > 0.99). Performance in the third, fourth, fifth, and sixth decision chambers (cylinders 5, 7, 9, 11) is progressively better. Sequential performance histograms for individual maze configurations (configurations 1,2) are shown in Figure 9. These data for individual mazes are similar to the data pooled over all four configurations.
Figure 8.
Learning performance in a variable irregular maze. Bees were simultaneously trained on four irregular mazes, as shown in a. Details as in Fig. 1.
Figure 9.
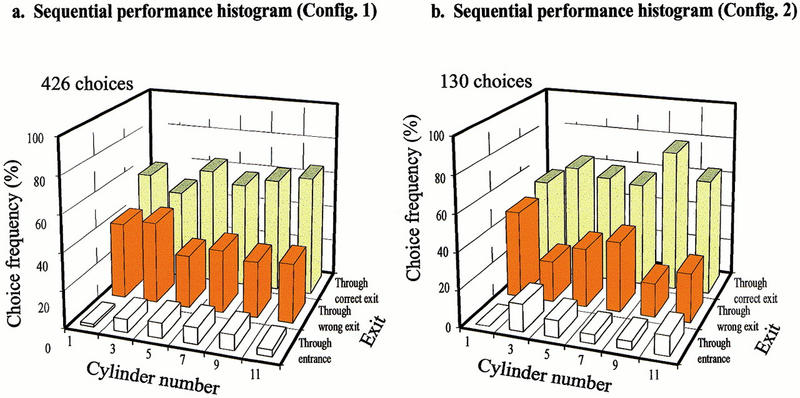
Tests of learning performance in a variable irregular maze showing sequential performance histograms for configuration 1 (a) and configuration 2 (b).
Control Experiment for Measuring Baseline Performance
Bees trained in the variable irregular maze were tested in a maze that was the mirror image of that corresponding to configuration 2. This maze, which the bees had never encountered before, is shown in Figure 10a. The performance histogram (Fig. 10b) reveals that the bees' performance in this maze is worse than in the variable irregular mazes: A substantial number of flights fall into the category C4, which represents flights in which the bee had to be released from the maze after unsuccessfully searching for the reward for 5 min. The performance indices are (T = 3.24, C = 3.12). The choice analysis histogram obtained for this test (Fig. 10c) reveals that bees chose randomly between the two exits (P > 0.99), regardless of whether they entered a decision chamber through the proper entrance or through the correct exit. Bees entering via the wrong exit, however, tended to choose the correct exit significantly more often than the wrong one. This does not imply, however, that the bees had learned the maze. It simply means that bees that had chosen the wrong exit initially tended to correct their mistake by choosing the correct exit when they reentered the decision chamber. The histogram also shows that a bee entered the decision chamber via the proper entrance and chose the correct exit only 26.5% of the time. The sequential performance histogram for this test is shown in Figure 10d. These data indicate that, whenever a bee entered a decision chamber via the proper entrance, she chose randomly between the two exits. The choice performance is not significantly different from 50% in any of the decision chambers (P > 0.50 in chambers 1,3,5,9; P > 0.20 in chamber 11). In other words, in the unfamiliar maze, the bees did not perform at a level better than random choice in any of the decision chambers. This test, which may be regarded as a control test, indicates that in our experiments, the bees were not using artefactual cues (such as scent marks or trails) to negotiate the mazes. The test therefore provides a legitimate baseline against which performance in all of the other mazes can be compared.
Figure 10.
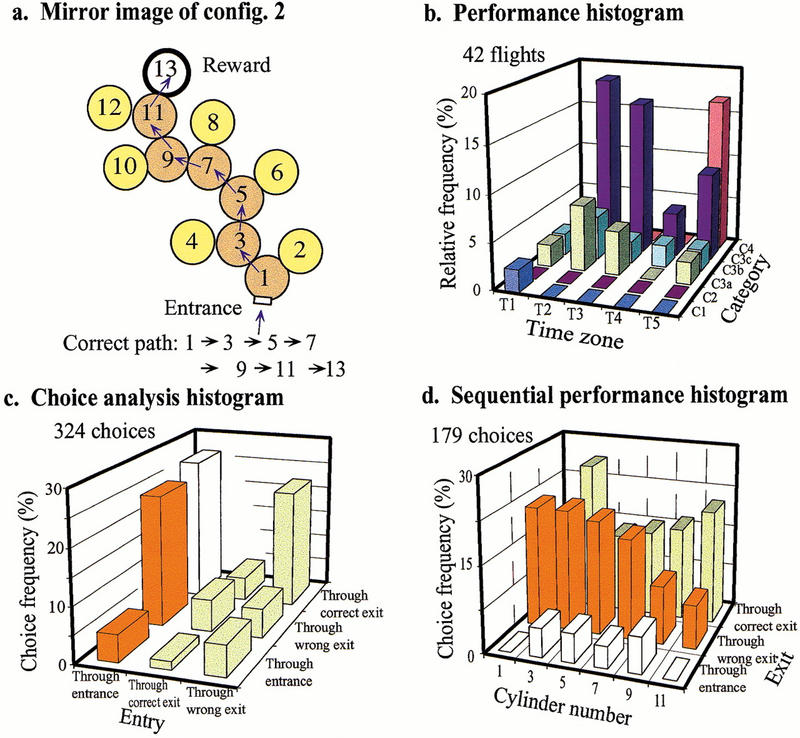
Transfer test in which bees trained in a variable irregular maze, as in Fig. 8, are tested in a novel irregular maze (mirror image of configuration 2 in Fig. 8). Details as in Fig. 1.
Comparison of Performance
The bees' learning performance in the various mazes can be assessed in two different ways. One way is to compare across mazes the frequencies with which bees choose the correct exit when they enter a decision chamber through the proper entrance (Table 1). It is important to consider only entries via the proper entrance, as bees entering via the wrong exit can correct their previous errors, as we have seen above. In other words, performance across mazes can be compared by examining the choice analysis histogram for each maze (see, e.g., Fig. 1c) and by determining the height of the clear bar as a percentage of the sum of the heights of the clear and orange bars (left-hand column). This calculation yields the following results: Right-turn maze (Fig. 1c): 84.6% (n = 948 choices); zig-zag maze (Fig. 4c): 74.9% (n = 906); fixed irregular maze (Fig. 7c): 71.7% (n = 879); variable irregular maze (Fig. 8c): 56.6% (n = 350); control (novel) maze after training in variable irregular maze (Fig. 10c): 50.3% (n = 171). The last figure reflects random choice and represents the baseline level of performance in an unfamiliar maze.
Table 1.
Summary of Comparisons Between Choice Frequencies with which Bees Choose the Correct Exit When They Enter a Decision Chamber Through the Correct Entrance, for Various Maze Configurations
| Series 2 | Series 3 | Series 4 | Control | |
|---|---|---|---|---|
| Series 1 | P < 0.001* | P < 0.001* | P < 0.001* | P < 0.001* |
| Series 2 | P > 0.10 | P < 0.001* | P < 0.001* | |
| Series 3 | P < 0.001* | P < 0.001* | ||
| Series 4 | P > 0.05 |
Note. Comparisons that are significantly different, as determined by the Bonferroni method (see Materials and Methods), are labeled with an asterisk.
The bees' performances in the constant-turn, zig-zag, and fixed irregular mazes are significantly better than those in the control maze (P < 0.001 in all cases). Table 1 shows that the bees' performance is best in the constant-turn maze and is significantly better than in all of the other mazes (P < 0.001 in all cases). Performance in the zig-zag maze is numerically slightly better but not significantly different from that in the fixed irregular maze (P > 0.10). Performance in the fixed irregular maze is significantly better than in the variable irregular maze (P < 0.001). Finally, performance in the variable irregular maze is marginally better than in the control (novel) maze (0.10 > P > 0.05).
Another way of comparing the bees' performance in the various experiments is to rank them according to their performance indices and to statistically compare the performance histograms using the Komolgorov-Smirnov test, as described in Materials and Methods. The results, shown in Table 2, closely mirror those given in Table 1. The ranking of performance in Table 2 is largely consistent with that revealed by the analysis of choice frequencies. However, some of the performance comparisons are less statistically significant in Table 2 than in Table 1. The reason may be that the measures of performance are different in the two cases.
Table 2.
Summary of Comparisons Between Performance Indices (i.e., Between C Values) for Various Maze Configurations
| Series 2 | Series 3 | Series 4 | Control | Performance indices | |
|---|---|---|---|---|---|
| Series 1 | 0.15 > P > 0.10 | P < 0.01 | P < 0.001* | P < 0.001* | T = 1.78, C = 2.28 |
| Series 2 | 0.10 > P > 0.05 | P < 0.001* | P < 0.001* | T = 1.62, C = 2.41 | |
| Series 3 | P < 0.02 | P < 0.05 | T = 2.06, C = 2.60 | ||
| Series 4 | 0.10 > P > 0.05 | T = 2.80, C = 2.98 | |||
| Control | T = 3.24, C = 3.12 |
Note. Comparisons that are significantly different, as determined by the Bonferroni method (see Materials and Methods), are labeled with an asterisk.
DISCUSSION
We have explored the ability of bees to navigate through mazes and to learn their structure. We find that bees are better at learning mazes that possess a regular pattern. For example, constant-turn mazes are learnt better than irregular mazes. With the constant-turn maze, it is sufficient to learn a single rule: Always turn in the same direction. In the case of the zig-zag maze, the navigational algorithm is somewhat more complex. One strategy would be to learn the path as a repeated sequence of subpaths (right-left, right-left, etc.). Another would be to memorize the first turn (i.e., the turn required at the first decision chamber) and then alternate the choice of exit in subsequent chambers. Regardless of the strategy actually used, it is clear that bees are able to learn the zig-zag maze, although not as well as the constant-turn maze.
The results of the test in the zig-zag maze with the interposed dummy chamber (Fig. 6a) indicate that the alternation of choice persists even when the appropriate turn is not permitted in a particular chamber. There, bees chose the left exit in chamber 3, went through the dummy chamber 5, and then chose the left exit again in chamber 7. This must mean that the dummy chamber was treated as a right exit chamber even if it did not permit such a choice. One possibility is that the bee veers to the right in the dummy chamber but, not finding an exit there, veers back and leaves through the only available exit. If this is the case, then one way in which the zig-zag strategy could be implemented is to make each turn the oppposite of the previous one, keeping track of actual as well as attempted turns. Another possibility is that the bee flies straight through the dummy chamber but keeps a mental note of what it should have done in that chamber, even if the action was not physically performed or even attempted. In this case, the algorithm for negotiating the zig-zag maze would not be linked to the physical turn that was made (or attempted) in the previous chamber but to whether the position of the current chamber in the sequence is even or odd.
The experiments with the constant-turn and zig-zag mazes demonstrate that bees are capable of recognizing regularities in maze paths and using them to advantage.
Irregular mazes are much harder to learn than right-turn mazes but only slightly harder than zig-zag mazes. The latter finding is somewhat surprising, as it implies that bees are nearly as good in learning an irregular 6-turn sequence as they are in learning a zig-zag rule. There is evidence, however, that bees are capable of negotiating at least relatively simple mazes by memorizing the entire route. Collett et al. (1993) trained bees to fly through a simple labyrinth and subsequently filmed the bees' flight trajectories when they flew into the same enclosure with the walls of the labyrinth removed. They found that bees flew the same route within the now-empty space, even though the walls were absent. This suggests that bees are capable of learning and using a fixed motor program, possibly linked to some form of path integration. It is likely that longer irregular mazes will be much harder to learn than zig-zag mazes of comparable length. While we have not yet trained bees on long irregular mazes, the data of Fig. 6—which show that bees can readily extrapolate a learned zig-zag rule to longer mazes—indicate that long zig-zag mazes should not present great learning difficulties.
Learning performance in the variable irregular mazes is significantly poorer than in the fixed irregular maze, at least as revealed by the analysis in Table 1. However, it is only marginally better than in the control situation (0.05 < P < 0.10). This is not surprising, as the learning of the variable mazes requires both memorization of the paths through all four mazes and the ability to recognize which maze the bee has entered, so that the appropriate memory may be recalled and applied.
It should be noted that the above discussion is based on the statistical analyses presented in Table 1. The results shown in Table 2, considered together with the Bonferroni threshold of P < 0.005, suggest that some of the differences in performance may be not be as extreme as those indicated by Table 1.
In summary, our results reveal that bees do not navigate through all of our mazes simply by memorizing the entire sequence of turns: If they did, performance in all of the mazes (right turn, zig-zag, and fixed irregular) would be similar. Rather, performance in the various configurations depends on the existence of regularity in the path through the maze and on the ease with which this regularity can be recognized and learned.
During the training on variable irregular mazes, we noticed that two individual bees developed a strategy of always turning in the same direction to go through the maze. One developed a left-turn strategy, and the other developed a right-turn strategy. Given the architecture of our mazes, it is clear that a constant-turn strategy will always lead to the goal, even though it may not be the shortest route. Not all the bees developed this strategy, however. The extent to which bees can discover or develop strategies for negotiating complex, irregular mazes needs to be further explored.
It is of interest to compare the performance of bees in our mazes with that of rats in similar mazes. De Montpellier (1933) found that rats are adept at learning right-turn or left-turn mazes, where the correct turn is always in the same direction in each decision chamber. Zig-zag mazes were somewhat more difficult to learn, and irregular mazes were still harder. This is largely in accordance with our findings with bees, except for the fact that bees seem to learn irregular mazes nearly as well as zig-zag mazes (but see previous discussion). Hunter (1940) demonstrated that rats can learn a zig-zag maze in which they are required to make alternating left and right turns (l, r, l, r, l, r, etc.). A later study from the same laboratory (Hunter and Hall 1941) revealed that rats are less adept at learning a double-alternation maze (where the turns are l, l, r, r, l, l, r, r, etc.). It would be of interest to explore how bees perform in such mazes and in mazes of greater complexity.
MATERIALS AND METHODS
The experiments were carried out in an All Weather Bee Flight Facility at the Australian National University's Research School of Biological Sciences. The facility consisted of a modified glasshouse in which the internal temperature was regulated by a computer to maintain 24° ±5°C during the day and 17° ±3°C at night. A beehive, mounted on the wall of the facility, had two entrances, one allowing bees access to the inside of the facility and the other to the outside. Bees foraging indoors obtained sugar water from feeders in the facility. For each experiment, about 10 bees were marked individually and trained to visit an experimental maze, details of which are described below. Training was carried out by reinforcement: Bees that had navigated successfully through the maze obtained access to a reward of sugar solution placed at the end of the maze. The trained bees flew regularly between the hive and the apparatus.
Apparatus
The maze consisted of a number of vertically oriented cylinders, each with a diameter of 22.5 cm and height of 25 cm, covered by a sheet of transparent perspex. These cylinders were used as modules to construct mazes with various configurations. Each cylinder had three holes with a diameter of 4 cm. Each hole was positioned halfway up the wall of the cylinder; that is, 12.5 cm above the floor. A bee flying a correct path through the maze entered a cylinder through one hole and could leave through one of two exit holes, positioned 45° to the left and right of the straight ahead direction. One of these holes represented the correct path continuing through the maze, while the other one led to a cylinder representing a dead end. Of course, the bee could also backtrack by leaving the cylinder through the hole by which it entered. (In principle, the entrance hole could be distinguished from the exit holes by the fact that it was 135° away from each of the other holes.) The final cylinder on the correct path contained a feeder that provided a solution of sugar water, which the bees could drink ad libitum. After they had fed, bees were released from this cylinder by raising the transparent cover temporarily.
Maze Configurations
Four different configurations were used, each in a different experimental series, starting with the constant-turn maze (series 1), in which the bee had to turn in the same direction in each cylinder in order to arrive at the feeder. In a right-turn maze (e.g., Fig. 1a), the bee had to choose the right-hand exit in each cylinder; in a left-turn maze, she had to choose the left-hand exit. In a constant-turn maze the elementary, repeating subpath is only one stage in length, as the bee is required to turn in the same direction in each cylinder.
Second is the zig-zag maze (series 2), in which the bee had to turn alternately left and right in successive cylinders in order to arrive at the feeder (e.g., Fig. 4a). In this case, the elementary subpath is two stages long, representing two oppositely directed turns.
Third is the irregular maze (series 3), in which the correct path to the reward did not possess any obvious pattern. These mazes were designed by using a random-number generator to determine the correct choice of exit in each cylinder. Four examples of irregular mazes are shown in Figure 8a. In an irregular maze there is no repetition of a pattern; hence, there is no elementary subpath: The bee has to learn the entire sequence of turns through the maze. In one experiment, bees were trained on a fixed irregular maze.
Finally, there is the variable irregular maze (series 4), in which bees were simultaneously trained on four different irregular mazes (Fig. 8a). This was accomplished by training the bees to fly through each configuration (in turn) and then maintaining the level of training for each configuration by changing the configuration every 1 h. Details of training and testing are described below.
To facilitate a comparison of performance in the various mazes, all mazes were of the same length (six decision chambers) unless specified otherwise.
Training and Testing Procedure
Eight to ten bees were individually marked and trained in each experiment. Bees were trained to come to a feeder placed initially just outside the entrance to the maze. After they were marked, the feeder was moved slowly step by step through the maze, remaining for ∼1 h in each decision chamber. After the feeder had reached its final position, the performance of individual bees with regard to the choices made in each decision chamber and to the total duration of flight through the maze was monitored continuously. These data revealed that learning was complete after ∼6.5 h, 10 h, 12 h, and 20 h (corresponding to an average of 78, 120, 144, and 240 rewards per bee) for the constant-turn, zig-zag, fixed irregular, and variable irregular mazes, respectively. The training periods given above include the pretraining phase of ∼6 h (∼72 rewards), in which the feeder was moved step by step through the maze.
The maze was situated on a 30-cm-high table with castors. This allowed the position and orientation of the maze to be varied randomly every 10 min to prevent the bees from using any cues external to the maze for orientation. The cylinders making up the maze were randomly shuffled every 3 h to prevent the possibility of bees using pheromonal or other odor-based cues to navigate through the maze. Control observations, with the feeder removed, assured us that the bees were not finding the feeder on the basis of any odor that it may have carried.
Tests of performance were carried out after learning was complete. To maintain the bees' motivation, the reward was present during all tests, as it was during training. In some experiments the bees' performance was tested using a maze configuration that was different from that used in the training. Such tests were conducted for short periods (15 min at a time) and were interspersed with at least 1.5 hours of further training. This precaution prevented learning of novel test configurations and ensured that the level of training was maintained.
Control Experiment for Evaluating Baseline Performance
The baseline (chance level) performance of the bees was obtained by training bees in a variable irregular maze (series 4) and testing them in a novel maze that they had never previously encountered so that the trained bees had no knowledge of the correct path. As expected, the bees performed very poorly in these tests: Any flights that reached the goal were successful purely by chance. The bees' performance in each of the other mazes was evaluated by comparison with this control baseline.
Data Analysis
The bees' performance under the various experimental conditions was evaluated by grouping their flights into four categories. The first category, C1, comprised flights in which a bee flew through the whole path and arrived at the goal without making any mistakes. The second category, C2, represented flights in which the bee turned back and retraced her path (once or many times) but remained on the correct path and finally arrived at the goal. The third category, C3, comprised flights in which a bee made one or more wrong turns at the decision boxes but still arrived at the goal within 5 min. This category was divided into three subcategories, namely, C3a, C3b, and C3c, corresponding to one wrong turn, two wrong turns, and three or more wrong turns, respectively. The last category, C4, represented unsuccessful flights, defined as those in which the bee did not reach the goal within 5 min of entering the maze, regardless of whether she was on the correct path or not. Such bees were released from the box in which they had been trapped and were allowed to enter the maze anew. C1 represents the best performance and C4 the worst.
The bees' performance in the mazes was also assessed by measuring the duration of the flight through the maze, that is, the time required to reach the goal from the instant of entering the maze. Flight duration, as measured by a stopwatch, was grouped into five categories, as follows: T1, 1–30 sec; T2, 31–60 sec; T3, 61–90 sec; T4, 91–120 sec; and T5, 120–300 sec (5 min). T1 represents the best performance and T5 the worst.
The bees' choices in each decision chamber were recorded and analyzed to obtain the following histograms for each maze and experimental condition: The performance histogram is a plot of the number of flights belonging to each category (C1–C4 and T1–T5), as shown for example, in Figure 1b. The best possible performance is one in which all the flights belong to categories C1 and T1. In this situation, the foremost and leftmost bar of the histogram would show a relative frequency of 100%, and all other bars would show a value of 0%. Performance was quantified by a pair of numbers, T and C, representing the distances of the centre of gravity of the performance histogram from the origin along the time zone axis and the category axis, respectively. These numbers, termed performance indices, are given in Table 2. The smaller these numbers, the better the performance.
Second, the choice analysis histogram shows the relative frequencies of the choices that the bees make between the three holes in each decision chamber when they enter it in different ways: via the entrance, via the correct exit, or via the wrong exit. See, for example, Figure 1c. The best possible performance is one in which all entries are through the entrance and all exits occur through the correct exit. In this situation, the leftmost and rearmost bar of the histogram would show a relative frequency of 100%, and all other bars would show a value of 0%.
Finally, the sequential performance histogram shows the relative frequencies of the choices that bees make at each decision chamber when they enter it via the entrance. The best possible performance is one in which all exits occur through the correct exit. In this situation, the bars in the rearmost row of the histogram would all show a relative frequency of 100%, and all other bars would show a value of 0%.
Statistical Tests
Two types of statistical tests were used to compare the bees' learning performance in each series of experiments. In one series of statistical tests, the choice frequencies obtained in different experiments (as revealed by the choice analysis histogram) were compared pairwise by using a 2 × 2 χ2 test. These results are shown in Table 1.
In another series of statistical tests, the performance histograms for the various experiments were compared pairwise using the Kolmogorov-Smirnov two-sample test (Groebner and Shannon 1985). This analysis was carried out by comparing the distribution of C values obtained for each experiment. These results are shown in Table 2.
The Bonferroni Method (Rice 1995) was used to assess the level of confidence with which all of the different comparisons shown in Tables 1 and 2 are simultaneously statistically significant. This procedure, which is a rigorous and conservative way of evaluating the statistical significance of mutiple comparisons, involves using a probability threshold that is k times lower than the usual threshold of 0.05, where k is the number of different comparisons being made. In our case, with five experiments, k = 10. Thus, the Bonferroni threshold is P < 0.005. In Tables 1 and 2, comparisons that are significant at this level are labeled by an asterisk.
Acknowledgments
We thank Hong Zhu for invaluable assistance with the experiments. This research was supported partly by grants RG 84/97 from the Human Frontiers in Science program and N00014-99-1-0506 from the U.S. Defence Advanced Research projects Agency and the Office of Naval research to M.V.S.
The publication costs of this article were defrayed in part by payment of page charges. This article must therefore be hereby marked “advertisement” in accordance with 18 USC section 1734 solely to indicate this fact.
Footnotes
E-MAIL swzhang@rsbs.anu.edu.au; FAX 61-26249-3808.
Article and publication are at www.learnmem.org/cgi/doi/10.1101/lm.32900.
REFERENCES
- Collett TS, Zeil J. Place and landmarks: An arthropod perspective. In: Healy S, editor. Spatial Representation in Animals. Oxford: Oxford University Press; 1998. pp. 18–53. [Google Scholar]
- Collett TS, Fry SN, Wehner R. Sequence learning by honeybees. J Comp Physiol. 1993;172:693–706. [Google Scholar]
- Gallistel CR. The organisation of learning. Cambridge, MA: MIT Press; 1990. Chapter 5: The cognitive map; pp. 103–172. [Google Scholar]
- Groebner DF, Shannon PW. Business statistics—A decision-making approach. London: Merril; 1985. pp. 634–636. [Google Scholar]
- Healy S. Spatial representation in animals. Oxford: Oxford University Press; 1998. [Google Scholar]
- Hunter WS. A kinaesthetically controled maze habit in the rat. Science. 1940;91:267–269. doi: 10.1126/science.91.2359.267. [DOI] [PubMed] [Google Scholar]
- Hunter WS, Hall BE. Double alternation behavior of the white rat in a spatial maze. J Comp Psychol. 1941;32:253–266. [Google Scholar]
- de Montpellier G. An experiment on the order of elimination of blind alleys in maze learning. J Genet Psychol. 1933;43:123–139. [Google Scholar]
- Munn NL. Handbook of psychological research on the rat. Boston: Houghton Mifflin; 1950. The role of sensory processes in maze behavior; pp. 181–225. [Google Scholar]
- Olton DS. Spatial memory. Sci Am. 1977;236:82–98. doi: 10.1038/scientificamerican0677-82. [DOI] [PubMed] [Google Scholar]
- Rice JA. Mathematical statistics and data analysis. Belmont, CA: Duxbury Press; 1995. pp. 451–453. [Google Scholar]
- Zhang SW, Bartsch K, Srinivasan MV. Maze learning by honeybees. Neurobiol Learn Mem. 1996;66:267–282. doi: 10.1006/nlme.1996.0069. [DOI] [PubMed] [Google Scholar]


