

Abstract
A synthetic amphiphilic block copolymer, Pluronic, is a potent chemosensitizer of multidrug resistant (MDR) cancers that has shown promise in clinical trials. It has unique activities in MDR cells, which include a decrease in ATP pools and inhibition of P-glycoprotein (Pgp) resulting in increased drug accumulation in cells. This work demonstrates that Pluronic rapidly (15 min) translocates into MDR cells and co-localizes with the mitochondria. It inhibits complex I and complex IV of the mitochondria respiratory chain, decreases oxygen consumption and causes ATP depletion in MDR cells. These effects are selective and pronounced for MDR cells compared to non-MDR counterparts and demonstrated for both drug-selected and Pgp-transfected cell models. Furthermore, inhibition of Pgp functional activity also abolishes effects of Pluronic on intracellular ATP levels in MDR cells suggesting that Pgp contributes to increased responsiveness of molecular “targets” of Pluronic in the mitochondria of MDR cells. The Pluronic-caused impairment of respiration in mitochondria of MDR cells is accompanied with a decrease in mitochondria membrane potential, production of ROS, and release of cytochrome c. Altogether these effects eventually enhance drug-induced apoptosis and contribute to potent chemosensitization of MDR tumors by Pluronic.
Keywords: Cancer, MDR, Pluronic, Metabolism
1. Introduction
Multidrug resistance (MDR) is one of the major obstacles to successful chemotherapy [1]. It is often related to over-expression of drug efflux pumps, such as P-glycoprotein (Pgp) that dramatically reduces intracellular concentration of drugs. Most recently evidence began to mount that MDR is also associated with a drastic change in cellular metabolism. In particular, MDR cells were shown to use fatty acids as the major energy source as opposed to glucose predominantly used by drug-sensitive cells [2]. Furthermore, MDR cells also have lower mitochondria membrane potential, and more uncoupled respiration due to the mitochondria membrane leakage and higher level of uncoupling protein 2 (UCP2). As a result, mitochondria function in MDR cells is partially compromised in comparison to their sensitive counterparts and, therefore, may represent a viable target for chemosensitization. Previous studies demonstrated selective ATP depletion in Pgp overexpressing MDR cells by amphiphilic triblock copolymers of poly(ethylene oxide) (PEO) and poly(propylene oxide) (PPO), (PEO-b-PPO-b-PEO), also known as Pluronics or poloxamers [3]. The ATP depletion along with inhibition of the Pgp ATPase activity was shown to result in potent inhibition of the Pgp efflux pump and overall drastic sensitization of MDR tumors [4–6]. Furthermore, Pluronics enhance pro-apoptotic signaling and mitigate anti-apoptotic cellular defense resulting in a more potent drug action in MDR cells [7].
Although earlier studies suggested that Pluronic may inhibit respiration in mitochondria [8] the mechanism of Pluronic effects on cellular metabolism still remained unknown. This work demonstrated for the first time that Pluronic selectively inhibits respiration in mitochondria of MDR cells, in particular, by affecting the respiratory chain complexes I and IV. Impairment of mitochondrial function in MDR cells results in accumulation of reactive oxygen species (ROS) and release of cytochrome c, which is likely to contribute to enhanced cell death via apoptosis. Based on these observations the mechanisms of the sensitization of MDR cancer cells by Pluronic block copolymer are comprehensively recapitulated. The study is of significance for the future use of drug Pluronic formulation in chemotherapy of drug resistant cancers including the two completed and the planned clinical trials [9], [10].
2. Experimental Procedures
2.1. Chemicals and Drugs
Doxorubicin, Coenzyme Q1, NADH, cytochrome c, 2,6-dichlorophenolindophenol, rotenone, potassium cyanide, antimycin, succinate, oligomycin, FCCP, rhodamine 123, ATP assay kit (#FL-AAM), cytochrome c oxidase assay kit (CYTOCOX1), Dulbecco’s phosphate buffered saline solution (PBS)were purchased from Sigma-Aldrich (St. Louis, MO). MitoTracker Green and MitoTracker Red, JC-1, and dihydrocalcein were purchased from Invitrogen Inc., (Carlsbad, CA). Cytochrome c ELISA Kit (QIA74) and InnoCyte™ cytochrome c release kit (CBA077) were purchaised from Calbiochem (Gibbstown, NJ). Chemicals were reagent grade or higher. Synthesis of TRITC-P85 was performed by Dr. Robert Luxenhofer at the University of Nebraska Medical Center (UNMC) as previously reported [11].
2.2. Polymeric Surfactants
Pluronic P105 (P105) and P85 were kindly provided by BASF Corporation (North Mount Olive, NJ). A PEO/PPO/PEO monomer unit ratio is 37/56/37 in P105, and 26/40/26 in P85. Aqueous solutions of Pluronics were prepared in the assay buffer containing 122 mM sodium chloride, 25 mM sodium bicarbonate, 10 mM glucose, 10 mM HEPES, 3mM potassium chloride, 1.2 mM magnesium sulfate, calcium chloride (1.4 mM) and potassium phosphate dibasic (0.4 mM), pH 7.4.
2.3. Cells and Culture Conditions
The human breast carcinoma cell line, MCF7 (ATCC HT-B22), and its MDR subline, MCF7/ADR, derived by selection with Doxorubicin, were kindly presented by Y.L. Lee (William Beaumont Hospital, Royal Oak, MI). MDCK and MDCKII/MDR1 stably transfercted cells were a gift from Dr. Piet Borst (The Netherlands Cancer Institute, Amsterdam, Netherlands) [12]. The ovarian carcinoma A2780 cells and A2780/AD cells were kindly provided by Dr. T. Minko (Rutgers University, Piscataway, NJ). Cells were cultured in RPMI 1640 medium with 10% fetal calf serum, 100 U/ml penicillin, 100 μg/ml streptomycin, and 10 μg/ml insulin; A2780/AD cultures were supplemented with 800 ng/ml Doxorubicin.
2.4. Western blot assay
Identification of Pgp was done using immunoblot technique described previously [3] A total 25 μg of protein was loaded onto 7.5% polyacrylamide gel. The monoclonal antibodies to Pgp, C219 (Dako Corp., Carpinteria, CA), were used at 1:100 dilutions. The monoclonal antibodies to β-actin, and anti-β-1-chicken Integrin (Sigma Corp., St. Louis, MO) were used at 1:200 dilution. The secondary horseradish peroxide anti-mouse Ig antibodies (1:1500 dilution) were purchased from Amersham Life Sciences (Cleveland, OH). The specific protein bands were visualized using a chemiluminescence kit (Pierce, Rockford, IL). The levels of Pgp expression were quantified by densitometry (Nucleo Vision, Nucleo Tech, Curitiba-Pr., Brazil). To correct for loading differences, the levels of Pgp expression were normalized to a constitutively expressed β-actin.
2.5. ATP assay
MCF7 and MCF7/ADR cell monolayers were incubated in the assay buffer with various concentrations of P85 with/without 1 μg/ml Doxorubicin or 2 μM GF120918 or with rotenone for 2 hrs. Cells were washed three times with ice-cold PBS, lysed with 1% Triton X100 on ice and immediately frozen. The intracellular ATP levels were determined using luciferine/luciferase assay as described previously [3]. To investigate recovery of ATP levels after treatment with Pluronic, cells were washed from Pluronic after 2 hrs incubation and ATP levels were determined after 0.5, 1, 4, 10 and 21 hrs.
2.6. Total metabolism assay
The levels of glucose in the media after 2 hrs of treatment of the cells were measured using an enzymatic glucose oxidase colorimetric end-point kit (# 510-DA, Sigma, MO). The glucose uptake was calculated as the amount of glucose consumed per unit of time per cell and expressed on a percent basis as a ratio of the glucose amount in the media of P85-treated cells to that in the media of non-treated cells.
2.7. Anaerobic metabolism assay
The concentration of lactic acid in the media after 2 hrs of treatment was measured by the enzymatic assay kit (# 735-10, Sigma, MO) and expressed on a percent basis as a ratio of the lactate in P85 treatment and control groups.
2.8. Oxygen consumption
For the concentration dependence study cell monolayers were grown in 250-ml flasks (Fisher Scientific, Pittsburgh, PA), collected by trypsinization into tubes, and washed twice with PBS. Cells (4×10⁷) were incubated in 2 ml of assay buffer with/without P85 for 2 hrs at 37°C, and then placed into a chamber of calibrated Clark-type oxygen electrode (Hansatech Instruments Ltd., Norfolk, England). The changes of the polarizing voltage reflecting oxygen consumption were measured over 3 min. The oxygen consumption rates were determined as the slopes of the obtained kinetic curves and expressed as % for P85 treated vs. untreated controls. For the inhibition analysis oxygen consumption rates were determined using a Seahorse XF24 Extracellular Flux Analyzer (Seahorse Bioscience, Billerica, MA, USA) [13, 14]. The MCF7 or MCF7/ADR cells (1.5×10⁴/well) were seeded to Seahorse XF24 24-well plate and grown in DMEM media for 2 days. After that cells were washed three times with PBS and incubated at 37°C for 1 hr with 700 μl of treatment buffer (120 mM NaCl, 3.5 mM KCl, 2 mM MgCl2, 1.3 mM CaCl2, 1.2 mM Na2SO4, 0.4 mM KH2PO4, 15 mM D-glucose and 0.4% (w/v) bovine serum albumin (BSA), pH 7.4). The oxygen consumption rates were measured in triplicates every 6 min (one cycle). After 4 cycles of measurement of the basal level of respiration cells were supplemented with: 1) 75 μl P85 (final concentration, 0.03%) in treatment buffer or treatment buffer alone, 2) oligomycin (final concentration 4 μg/ml), and 3) FCCP (final concentration 2 μM). The oxygen consumption rates were measured for 10 cycles (P85) or 3 cycles (oligomycin, FCCP) and normalized to the basal rate (4th measurement point) to correct for differences in cell density in different wells.
2.9. EPR Measurements
A lipophilic spin probe 16-doxilstearic acid methyl ester (16-DSME) (Molecular Probes, Eugine, OR) was used in bioreduction experiments. Cells were loaded with 16-DSME as previously described [8] and placed into the electron paramagnetic resonance (EPR) tubes that were either open (for air/nitrogen flow) or closed at the lower end. EPR spectra were acquired in a Bruker (Billerica, MA) X-band EMX EPR spectrometer at 37°C. Typical kinetic experiments lasted for 40 to 60 min. The data were analyzed as described previously [8]. Preliminary experiments showed that above some limiting nitroxide concentration in the cells, the rate of probe bioreduction significantly dropped; the limiting concentration corresponded to the onset of a spin-spin interaction between the nitroxide molecules; the latter was characterized by the line shape parameter Ao/I (where Ao is the amplitude of the central spectral line and I is double integral of the spectrum); Ao/I dropped with increasing nitroxide concentration; in control samples, the bioreduction rate constant k dropped concomitantly. Below the limiting nitroxide concentration characterized by Ao/I > 6.0, the bioreduction rate constant did not depend on the probe concentration. Therefore, in this work all bioreduction rate measurements were made at 16-DSME concentrations corresponding to Ao/I > 6.0. Interestingly, in the presence of Pluronic, the bioreduction rate constant k did not depend on the 16-DSME concentration at any probe concentration.
2.10. Mitochondria isolation
MCF7 and MCF7/ADR cells were grown in flasks, collected by trypsinization into tubes (4×10⁷ cells per sample), and the mitochondria were isolated using Mitochondria Isolation Kit (#89874, Pierce Biotechnology, Inc., Rockford, IL) according to a manufacturer’s protocol.
2.11. Complex I activity
Here and below mitochondria electron transfer chain complexes activities were determined using previously described procedures [15, 16]. Briefly, mitochondria were incubated for 10 min. at r.t. with P85 in a buffer containing 25 mM potassium phosphate (pH 7.2), 5 mM MgCl2, and 2.5 mg/ml BSA. The reaction was started by adding 30 μM ubiquinone-1 (CoQ1) and 5 mM NADH. The decrease in absorbance of NADH at 340 nm (ε = 6.81 mM−1·cm−1) was recorded for 2 min. The baseline complex I-independent NADH oxidation activity was measured in the presence of 10 μg/ml rotenone, specific complex I inhibitor.
2.12. Complex II activity
Mitochondria were incubated for 10 min. at r.t. with P85 in a buffer containing 25 mM potassium phosphate (pH 7.2), 5 mM MgCl2 and 20 mM succinate. After that 16 μM 2,6-dichlrophenolindophenol was added and the baseline rate was recorded for 1 min. The reaction was started by addition of 65 μM of CoQ1. The decrease in absorbance of 2,6-dicholrophenolindophenol at 600 nm (ε = 19.1 mM−1·cm−1) was recorded for 2 min. Specific complex II inhibitor, atpenin A4 (1 μM) was used as negative control [17].
2.13. Complex III activity
The reaction mixture contained 25 mM potassium phosphate (pH 7.2), 5 mM MgCl2, 2.5 mg/ml BSA, 2 mM KCN (to inhibit complex IV) and 1.3 mg/ml cytohrome c (III) with/without P85. The mitochondria were added to this mixture and incubated at r.t. for 3 min (control) or 10 min (P85 treatment). The reaction was started by addition of 35μM ubiquinol-1, which was prepared by reducing CoQ1 with excess sodium of borohydride as described elsewhere [18]. The increase in absorbance of cytochrome c (II) at 550 nm (ε = 19 mM−1·cm−1) was recorded for 1 min. The baseline complex III-independent cytochrome c reduction was measured in the presence of 10 μg/ml Antimicin A.
2.14
Complex IV activity was measured in the whole cells by measuring the rates of oxygen consumption as described above in presence of 10 μg/ml Antimicin A, 0.1 mM N,N,N•,N•,N•-tetramethyl-p-phenylenediamine (TMPD) and 10 mM sodium ascorbate [19]. Basal rates of oxygen consumption were measured in presence of 5 mM KCN.
2.15. Complex V activity
Mitochondria F0F1-ATPase/Synthase activity was measured in isolated and disrupted mitochondria from MCF7 and MCF7/ADR cells by measuring the release of inorganic phosphate from ATP. 10 μg of mitochondria protein/well in 50 mM Tris-MES buffer with or without P85 were loaded in 96 well plate and incubated for 10 minutes at r.t. The reaction was started by addition 4 mM MgATP. ATPase activity in presence of 2 μg/ml oligomycin, a specific F0F1-ATPase/Synthase inhibitor was measured in parallel. After 20 minutes the reaction was stopped by addition of 10% SDS. 200 μl of mixture of 25 mM ammonium molybdate in 15 mM zinc acetate/10% ascorbic acid (1:4), pH 5 were added to eaqch well and absorbance at 630 nm was determined after incubation for additional 20 minutes at 37° C.
2.16. Measurement of membrane potential in mitochondria
Measurement of the membrane potential is based on potential-dependent accumulation of a dye, JC-1, in mitochondria, which is monitored by fluorescence emission shift from green (~529 nm) to red (~590 nm). Consequently, mitochondrial depolarization is indicated by decrease in the red/green fluorescence intensity ratio. The cells (105 cells/well) seeded in 24-well plates (Fisher Scientific, Pittsburgh, PA) were cultured for 2 days and then exposed to different concentrations of P85 for 2 hrs. In the case of MCF-7/ADR cells a Pgp inhibitor, 1 mM GF120918 was added with P85 to prevent interactions of JC-1 with Pgp. After that 100 μM CCCP and 0.5 μM JC-1 were added for 20 min. (without removing P85), cells were then washed with PBS, collected by scrapping and analyzed by fluorescence-activated cell sorting (FACS) to measure fluorescence intensities at λem 529 nm and 590 nm using λex 488 nm. CCCP-treated samples were used to perform standard compensation.
2.17. Measurement of ROS levels
The cells were seeded in 24-well plates (Fisher Scientific, Pittsburgh, PA), cultured for 2 days and then exposed to P85 for 1 hr. After that 2 μM dihydrocalcein (Invitrogen Inc., Molecular probes, CA) was added for 30 min (no media replacement). Then cells were collected by trypsinization, washed and analyzed by FACS (λex 492 nm, λem 517 nm).
2.18. Cytochrome c release study
Cytochrome c release was studied using 1) cytochrome c ELISA Kit (Cat. No. QIA74, Calbiochem, Gibbstown, NJ) and 2) InnoCyte™ cytochrome c release kit (Cat. No. CBA077, Calbiochem, Gibbstown, NJ) for confocal laser scanning microscopy (LSM) visualization. Briefly, cells grown in 24-well plates were exposed to P85 for 2 hrs and lyzed with 1% Triton X100 in presence of protease inhibitors (Halt protease inhibitor cocktail, product # 78248 Pierce Biotechnology, Rockford, IL). The cytoplasmic fractions were obtained using mitochondria isolation kit (# 89874, Pierce Biotechnology, Rockford, IL) and then assayed for presence of cytochrome c using ELISA. The data was normalized by the protein content in each sample. For LSM imaging the cells (5×10⁴ cells/chamber) were grown on 8-chamber slides for confocal microscopy (Fisher Scientific, Pittsburgh, PA) for 2 days, and exposed to P85 for 2 hrs. After that cells were permeabilized, fixed in 4% paraformaldehyde and then stained: first with mouse anti-cytochrome c monoclonal primary antibodies for 1 hr at r.t., and second with secondary Anti-IgG FITC-labeled antibodies for 1 hr at r.t. The images were obtained on Carl Zeiss LSM 510 Meta (Peabody, MA).
2.20. Confocal analysis on live cells
MCF-7/ADR cells (5×10⁴ cells/chamber) plated in 8-chamber slides for confocal microscopy and after two days were exposed for 15 and 60 min to 0.001% TRITC-P85 mixed with 0.1% unlabeled P85. After that cells were washed and treated with 0.1 μM MitoTracker Green in 2 μl dimethyl sulfoxide for 20 min. As a positive control cells without exposure to TRITC-P85 were treated with 0.1 μM MitoTracker Green and 0.1 μM MitoTracker Red in 2 μl dimethyl sulfoxide. The images were obtained on Carl Zeiss LSM 510 Meta (Peabody, MA).
2.21. Resistance reversion index (RRI)
Cells were exposed to Doxorubicin or Doxorubicin and P85 for 2 hrs and then incubated in a drug-free medium for additional 72 hrs. The cytotoxicity was determined using 3-(4,5-dimethylthiazol-2-yl)-2,5-diphenyltetrazolium bromide (MTT) assay [20]. The RRI was expressed as a ratio of IC50 of the drug in the cells before and after exposure to P85 [6].
2.22. Reversal of P85 effects
MCF7/ADR cells were grown in 96-well plates for rhodamine 123 uptake (1.5×10⁴ cells/well) and cytotoxicity studies (5×10³ cells/well) or in 24-well plates for ATP measurements. Cells were exposed to 0.1% P85 for 2 hrs, washed with PBS and placed into fresh media for additional 30 min, 1, 5, 10 and 20 hrs. The Pgp activity, ATP levels or drug cytotoxicity (RRI) were measured at different time points as described below.
2.23. Pgp activity
The Pgp activity was determined through a rhodamine 123 accumulation assay [3]. Briefly, cells were washed and treated with 3.2 μM rhodamine 123 for 1 hr. After that the cells were washed three times with ice-cold PBS and solubilized in 1% Triton X-100. Aliquots were removed for determination of the cellular dye using a Shimadzu RF5000 fluorescent spectrophotometer (Shimadzu, Kyoto, Japan) at λex = 505 nm, λem = 540 nm. The cellular protein was determined using the Pierce BCA assay. Fluorescence values were normalized to protein content in each well. The Pgp activity was expressed as percent of dye uptake in P85 treated vs. untreated cells.
2.24. 3H-P85 accumulation
A tritium label was incorporated into P85 by treatment of the copolymer film with atomic tritium as previously described [3]. The 3H-P85 with specific activity of 0.3 Ci/mmol was further diluted with unlabeled P85. The MCF7/ADR cells were exposed to 0.5 μCi/ml 3H-P85 in 0.1 % P85 for 2 hrs and then washed for different time intervals as described above. After that cells were washed tree times with ice-cold PBS, solubilized in 1% Triton X-100 (0.5 ml), and aliquots were taken for radioactivity measurements. The cellular protein was determined using the Pierce BCA assay. 3H-P85 radioactivity was normalized to protein content and expressed as percent of radioactivity at different time point vs. initial radioactivity of the cells treated with 3H-P85.
2.25. Statistical analysis
All experiments were carried out in quadruplicates and data were analyzed using Student’s t-test or ANOVA for multiple group comparisons and presented as mean value ± SEM.
3. Results
3.1 ATP depletion in MDR and non-MDR cells by Pluronic
MDR (MCF7/ADR) and non-MDR (MCF7) cells were exposed to P85 and the total cellular levels of ATP were determined after 2 hrs as described in the Methods section. In both MCF7/ADR and MCF7 cells the ATP levels followed the same general trend in response to increasing concentrations of Pluronic (Fig. 1A). Specifically, ATP levels initially increased over untreated controls and then sharply decreased. However, there was a drastic difference in the dose-response. Significant ATP depletion was observed in MDR cells at P85 concentrations as low as ca. 0.01 % wt. In contrast, ATP levels in sensitive cells did not decrease until much higher P85 concentrations of ca. 5–10 % wt. The difference in the response of the cells to Pluronic clearly correlated with the appearance of the MDR phenotype. The MDR cells expressed higher levels of Pgp protein compared to non-MDR cells (Fig. 1B). Similar relationships between the dose response of ATP depletion by Pluronic and the levels of Pgp expression were observed in other pairs of MDR and non-MDR cells as reported by us previously [3]. The role of Pgp in ATP depletion was further reinforced using 2 μM of GF120918, the Pgp inhibitor, which completely abolished the effect of Pluronic on ATP levels in MCF7/ADR cells (Fig. 1C). Noteworthy, the same trend in ATP levels in MDR and non-MDR cells was also observed in response to rotenone, a respiratory chain inhibitor (Fig. 1D). Therefore, we further evaluated effects of Pluronic on cell metabolism in resistant and sensitive cells.
Fig. 1.

Effects of P85 on intracellular ATP levels without (A) and with 2 μM GF120918 (C) in MCF7 and MCF7/ADR cells. (B) Western blot analysis of Pgp expression in (1) MCF7 and (2) MCF7/ADR cells. (D) Effect of rotetone on the intracellular ATP levels in MCF7 (filled diamonds) and MCF7/ADR (empty diamonds) cells. (A, C, D) The data are presented as % of the untreated controls (in the absence of any agent) for each cell line. All data are mean ± SEM (n = 4). ATP levels in untreated controls in MCF7 cells were (A) 7.8±0.4, (D) 3.1±0.5, and in MCF7/ADR cells (A) 31.1±1.5; (C) 16.3±1.6 (D) 95.7±11 nmol/mg protein. (A, D) ECATP50 values corresponding to 50% decrease in ATP levels for each cell line are shown by arrows. (C) Differences between untreated control and any of the treated groups were not significant.
3.2. Effect of Pluronic on total metabolism in MDR and non-MDR cells
The total energy metabolism in cells consists of anaerobic (glycolysis) and aerobic (respiration) components and can be characterized by glucose consumption by cells [21]. In this experiment the initial pre-treatment concentration of glucose in all cases was 10 mM. After 2 hrs the glucose concentration in the control groups decreased to 1.06 mM and 0.74 mM in MCF7 and MCF7/ADR cells respectively. Based on this we determined the rates of glucose consumption in untreated control groups. Following the exposure of the cells to P85 for the same period of time the glucose consumption rates were decreased suggesting that the copolymer inhibited the total metabolism in a dose dependent fashion (Fig. 2A). The inhibitory doses of P85 in the MDR and non-MDR cells were the same as those causing the ATP depletion. The response depended on the MDR phenotype: in the resistant cells Pluronic inhibited the glucose consumption at doses about two orders of magnitude lower than in the sensitive cells. Therefore, P85 has selective inhibitory effect on the total metabolism in MDR cells.
Fig. 2.

Effect of P85 on (A) glucose consumption and (B) lactate production in MCF7 (filled diamonds or bars) and MCF7/ADR (empty diamonds or bars) cells. (A, B) The data are mean ± SEM (n = 4). Statistical comparisons are shown for treated and untreated control groups: * p < 0.05; ** p < 0.005.
3.3. Effect of Pluronic on anaerobic metabolism in MDR and non-MDR cells
Anaerobic metabolism involves cytoplasmic oxidation of glucose to pyruvate, which is then converted to lactate and secreted in the media [21]. In the control untreated groups after 2 hrs the lactate concentrations were 12.6 mM and 6.9 mM in MCF7 and MCF7/ADR cells respectively (no lactate was added to cells initially). After exposure of the cells to P85 the lactate production was increased in both MDR and non-MDR cells, indicating activation of anaerobic metabolism (Fig. 2B). There was little if any difference in the dose dependency; in both cases lactate production significantly increased at concentrations of P85 as low as 0.01%. However, the extent of increase was greater in the MDR cells compared to the non-MDR cells. Altogether anaerobic metabolism was stimulated by P85 in both sensitive and resistant cells. Therefore, we further characterized the effects of Pluronic on mitochondria function in MDR and non-MDR cells.
3.4. Effect of Pluronic on oxygen consumption in MDR and non-MDR cells
Respiration involves oxidation of organic substrates in mitochondria accompanied by binding of atmospheric oxygen. Hence, we determined oxygen consumption following exposure of MDR and non-MDR cells to P85. The initial rates of oxygen consumption in untreated controls were 1.42 and 2.9 pmol/min/106 cells in MCF7 and MCF7/ADR cells respectively. As the copolymer concentration in the treatment solution increased the oxygen consumption initially increased over the untreated control and then sharply decreased suggesting inhibition of respiration (Fig. 3A). Like the ATP levels, the response of oxygen consumption to Pluronic was also a function of MDR phenotype: it was observed at about 2 orders of magnitude lower concentration of P85 in the MCF7/ADR cells compared to MCF7 cells. Furthermore, the concentrations of P85 at which the oxygen consumption was increased were the same as those at which ATP levels were increased. For example, in MDR cells the maximal oxygen consumption and ATP levels were observed at 0.001 % P85. Likewise, the concentrations of Pluronic at which oxygen consumption was inhibited were same as those at which ATP was depleted. In MDR cells both oxygen consumption inhibition and ATP depletion were observed above 0.01% P85. Therefore, it appears that the changes in the intracellular ATP in response to P85 exposure are due to the copolymer effects on respiration.
Fig. 3.
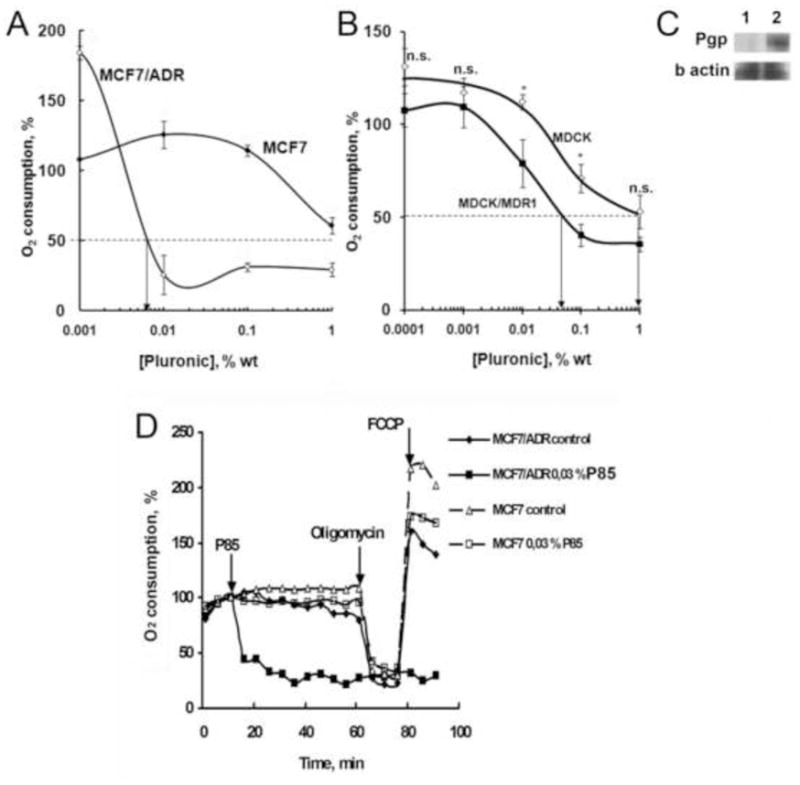
Effect of P85 on oxygen consumption by (A, D) MCF7 and MCF7/ADR cells and (B) wild type MDCKII and MDCKII/MDR1 cells. (A, B) Cells were exposed to various doses of P85 for 2 hrs and the rate of oxygen consumption was determined using a Clark-type oxygen electrode. The ECRES50W values corresponding to 50% decrease in oxygen consumption are shown by arrows. The data are mean ± SEM (n = 3). Statistical comparisons between MDR and non-MDR cells are shown for every copolymer dose: * p < 0.05; ** p < 0.005, n.s. not significant. (C) Western blot analysis of Pgp expression in (1) MDCKII and (2) MDCKII/MDR1 cells. (D) Rates of oxygen consumption by MCF7 and MCF7/ADR cells over time were measured with 6 min intervals using Seahorse XF24 metabolic flux analyzer. Arrows present points of administration of 0.03% P85, 4 μg/ml oligomycin and 2 μM FCCP.
Since we demonstrated above that Pgp plays an important role in ATP depletion it was of interest to determine whether non-MDR cells can acquire increased responsiveness of oxygen consumption to Pluronic as a result of transfection with Pgp. For this purpose we compared oxygen consumption in wild type MDCKII cells and MDCKII/MDR1 cells stably transfected with Pgp. The initial rates of oxygen consumption in these cells were 20.45 and 17.18 pmol/min/106 cells respectively. Similarly to the drug-selected MDR cells, the Pgp-transfected MDCKII/MDR1 cells displayed decreased rates of oxygen consumption at nearly one order of magnitude lower doses of Pluronic than the wild type MDCKII cells (Fig. 3B). The Pgp expression in MDCKII/MDR1 cells was confirmed by Western blot (Fig. 3C).
To further determine the components of respiration affected by Pluronic we characterized the effects of the F0F1-ATPase/Synthase inhibitor (oligomycin) and oxidative phosphorylation uncoupler (FCCP) on oxygen consumption in MCF7 and MCF7/ADR cells cells. The rate of oxygen consumption is determined by the rate of electron transport through the respiratory chain [21]. The electron transport generates an electrochemical proton gradient across the inner mitochondrial membrane, which opposes the flow of electrons. In the coupled mitochondria the electron flow through the respiratory chain is balanced by the removal of the proton gradient by F0F1-ATPase/Synthase. Therefore, inhibition of F0F1-ATPase/Synthase also stops the flow of electrons and inhibits oxygen consumption, while addition of uncoupler, which removes proton gradient, stimulates the electron flow and oxygen consumption.
Based on these assumptions the goal of our experiment was to determine whether Pluronic affects 1) the proton gradient or 2) the electron flow. Specifically, MDR and non-MDR cells were exposed to P85 and the rates of oxygen consumption were measured every 6 min. The concentration of P85 was 0.03%, which based on the dose dependency, was sufficient to inhibit ATP and respiration in MDR cells but not in non-MDR cells. As shown in Fig. 3D after addition of the copolymer the oxygen consumption in MDR cells rapidly decreased (within 6 to 18 min). No changes in oxygen consumption were observed in non-MDR cells for at least 60 min. After 60 min cells were treated with oligomycin, which induced a rapid decrease in oxygen consumption in P85 treated non-MDR cells as well as in the untreated MDR and non-MDR cells. No changes were seen in P85 treated MDR cells, which were already inhibited by the copolymer. Therefore, in MDR cells P85 induced complete inhibition of respiration. Further addition of FCCP resulted in drastic increase in oxygen consumption in all cases except MDR cells treated with P85. This clearly suggests that P85 acted as an inhibitor of respiratory chain in MDR cells since the removal of the proton gradient by FCCP did not restore electron flow and oxygen consumption (Fig. 3D). However, as discussed below one cannot exclude that along with inhibition of respiratory chain P85 can also act as an uncoupler. Furthermore, it is interesting that in non-MDR cells P85 decreased the rate of oxygen consumption achieved after addition of FCCP. Based on this, we cannot exclude that P85 also partially inhibited the respiratory chain in non-MDR cells. Altogether these experiments suggest that Pluronic affects the mitochondria respiratory chain and inhibits the electron flow. Therefore, we took a closer look at effects of Pluronic on electron transfer in mitochondria.
3.5. Effect of Pluronic copolymers on the nitroxide bioreduction in MDR and non-MDR cells
One of the approaches to assess mitochondria function is to measure kinetics of the nitroxide spin probe bioreduction. Mammalian cells are known to convert “EPR-active”, paramagnetic nitroxide species into “EPR-silent”, non-paramagnetic compounds, usually hydroxylamines [22]. For the lipophilic nitroxide spin probes internalized by mammalian cells, the mitochondria is the site of the bioreduction [23, 24], and the bioreduction rate is a good indicator of the activity of the electron transport chain [8]. In this work, we assessed inhibition effects of Pluronic on the nitroxide (16-DSME) bioreduction rate, using a P85 or another Pluronic homologue, P105, which is structurally close to P85 and has similar effects in MDR cells [25]. These studies used two pairs of MDR and non-MDR cell lines: 1) breast cancer MCF7/ADR and MCF7, 2) ovarian cancer A2780/AD and A2780. The initial rate of nitroxide bioreduction was proportional to the initial intracellular nitroxide concentration suggesting a first order reaction (supplementary Fig. S1A). Same results were observed for all cell lines in the conditions studied (data not shown). A sharp decrease in the nitroxide bioreduction rates was observed 5-min after exposure of the MDR cells to Pluronic in aerobic conditions (Fig. 4A). In non-MDR cells Pluronic also caused some inhibition of bioreduction, which was, however, much less than that in the MDR cells (Table 1). Notably, in anaerobic conditions, nitroxide bioreduction rate was dramatically increased (Fig. 4B) and the effect of Pluronic on the bioreduction rates was completely eliminated (supplementary Fig. S1B). Since as discussed below the nitroxide bioreduction is due to electron transfer from ubiquinone-10 (CoQ10) to 16-DSME, this result suggests that main effects of Pluronic on respiratory chain occur downstream of ubiquinone. Therefore, we studied effects of Pluronic on different stages of electron transfer in isolated mitochondria.
Fig. 4.

16-DSME bioreduction in MCF7/ADR cells. (A) Effect of 1% P85 on kinetics of the nitroxide bioreduction. Bioreduction rate constants, k, are 0.0856 min−1 (untreated control) and 0.0189 min−1 (1% P85, 5 min). (B) Kinetic curves of nitroxide bioreduction in air and nitrogen for MCF7/ADR cells preincubated with P85 for 1 hr. Rate constants are 0.0165 min−1 (air) and 0.0431 min−1 (nitrogen).
Table 1.
Effect of 1% P85 on the nitorxide bioreduction constants and the oxygen consumption rates in MDR and non-MDR cells in aerobic conditions.
| Cells |
k, min−1 |
Oxygen consumption rates in untreated controls, nmol/min/106 cell | |
|---|---|---|---|
| control | P85 | ||
| A2780 | 0.045 ± 0.006 | 0.025 ± 0.006 | 0.83 ± 0.05 |
| A2780/AD | 0.025 ± 0.008 | 0.009 ± 0.002 | 0.5 ± 0.06 |
| MCF7 | 0.128 ± 0.038 | 0.088 ± 0.015 | 1.63 ± 0.04 |
| MCF7/ADR | 0.087 ± 0.027 | 0.019 ± 0.001 | 1.33 ± 0.05 |
3.6. Effect of Pluronic on mitochondria oxidative phosphorylation (OXPHOS) in MDR and non-MDR cells
In isolated mitochondria Pluronic had the greatest effect on cytochrome c oxidase (complex IV) (Fig. 5A). In the MDR cells the activity of complex IV was drastically decreased at P85 concentrations as low as 0.001%. In the sensitive cells the inhibitory effect was not observed in the studied range of Pluronic concentrations. In addition, the activity of NADH-ubiquinone oxidoreductase (complex I) was also inhibited. In this case the difference in concentration dependence in the MDR and non-MDR cells was about ten-fold (Fig. 5B). Notably, in the MDR cells complex I was inhibited at P85 concentrations above 0.01%. The succinate dehydrogenase (complex II), coenzyme Q-cytochrome c reductase (complex III) (data not shown) and F0F1-ATPase/Synthase (complex V) (Fig. 5C) activities were not affected by Pluronic in either MDR or non-MDR cells. Based on this data one can suggest that inhibition of oxygen uptake by Pluronic and, therefore, ATP depletion in MDR cells are due to inhibition of complex I and complex IV in mitochondria.
Fig. 5.

Effect of P85 on the activities of (A) complex IV, (B) complex I, (C) F0F1-ATP complex V in isolated mitochondria and (D) mitochondria membrane potential in MCF7 and MCF7/ADR cells. (A, B) The relative activities of complexes I and IV are shown as % of treated vs. untreated controls. (C) The F0F1-ATPase/Synthase absolute activity in disrupted mitochondria is presented. (C) Mitochondria membrane depolarization is indicated by a decrease in red/green fluorescence intensity ratio of JC-1 (I590/I529). (A, B, D) Effective concentrations of block copolymer necessary for 50% decrease of mitochondria membrane potential (ECΨm50) and for 50% inhibition of complex I and IV activities are shown by arrows. The data are mean ± SEM, (A, B) n = 5, (C, D) n = 3.
3.7. Effect of Pluronic on mitochondria membrane potential in MDR and non-MDR cells
The mitochondria membrane potential was measured using live resistant and sensitive cells. In both cases treatment of cells with low concentrations of P85 increased the membrane potential compared to the untreated controls (Fig. 5D). Interestingly, the Pluronic concentrations corresponding to the increase in the membrane potential were approximately the same as the concentrations of the copolymer that caused increases in ATP levels (Fig. 1A) and oxygen consumption (Fig. 3A). This suggests that at low doses, from about 0.0001 to 0.001% in MDR cells and 0.0001 to 0.1% in non-MDR cells, Pluronic may stimulate the electron flow, oxygen consumption and synthesis of ATP. However, at concentrations of P85 higher than 0.01% the membrane potential in MDR cells sharply decreased. In contrast, in non-MDR cells a significant drop in membrane potential was seen only at 1 % of P85. Clearly, the decrease of the membrane potential was due to inhibition of respiratory chain described above.
3.8. Effect of Pluronic on reactive oxygen species (ROS) production
A compromised mitochondria function often leads to oxidative stress associated with production of ROS [26]. Therefore, we examined the effects of Pluronic on ROS in the resistant and sensitive cells. At low concentrations of P85 (0.0001–0.01%) the levels of ROS did not exceed the untreated control levels in both MDR and non-MDR cells. However, as doses of P85 further increased the ROS production was drastically increased in the resistant, but not in the sensitive cells, where it remained at the basal level (Fig. 6A). Notably, concentrations of P85, at which ROS elevated and complex I was inhibited were practically the same. Therefore, one can conclude that inhibition of respiration by Pluronic results in oxidative stress in MDR cells.
Fig. 6.

Effect of P85 on (A) ROS production and (B) cytochrome c release in MCF7 and MCF7/ADR cells. The data are mean ± SEM (n = 3).
3.9. Effect of Pluronic on cytochrome c release
The oxidative stress is often associated with cytochrome c release in mitochondria and stimulation of pro-apoptotic signaling. Therefore, the cytochrome c release in cells was studied with ELISA (Fig. 6B), as well as confocal LSM (supplementary Fig. S2). The data indicate that P85 concentrations 0.01% and higher stimulate release of cytochrome c from mitochondria in MDR cells, but not in the sensitive cells. Interestingly, release of cytochrome c, ROS production and inhibition of mitochondria respiration were observed practically at the same doses of P85. Thus, it appears that inhibition of mitochondria function by Pluronic is accompanied by stimulation of proapoptotic signaling, namely production of ROS and cytochrome c release.
3.10. Transport of P85 to mitochondria
Our previous work already suggested that P85 can transport to mitochondria of MCF7/ADR cells [7]. However, no comparison was made for MDR and non-MDR cells at different time points. Also, in this study we used a different florescence label for P85 (TRITC instead of FITC) to ensure that the transport results do not depend on the copolymer labeling. Fig. 7 presents confocal microscopy of MCF7 and MCF7/ADR cells treated with TRITC-P85. In both cell lines the co-localization of TRITC-P85 with a mitochondrial marker, MitoTracker Green, was observed already after 15 min of the cell exposure to the copolymer and remained for at least 60 min (Fig. 7B, C, D, E). As a positive control a co-localization two mitochondrial markers MitoTracker Green and MitoTracker Red is also presented (Fig. 7A). Notably, our previous data published have shown that P85 added to cells in such concentrations do not permeabilize cellular membranes with respect to membrane impermeable solutes [27]. This study provides evidence that P85 is rapidly transported in the mitochondria of both MDR and non-MDR cells.
Fig. 7.

Colocalization of TRITC-P85 with mitochondria marker in MCF7 and MCF7/ADR cells. (A) MCF7/ADR cells treated with mitochondrial markers MitoTracker Green and MitoTracker Red (colocalization positive control); (B) MCF7 exposed to TRITC-P85 for 15 min and (C) 60 min in the presence of MitoTracker Green; (D) MCF7/ADR cells exposed to TRITC-P85 for 15 and (E) 60 minutes in the presence of MitoTracker Green.
3.11. Recovery of ATP levels, Pgp activity and drug resistance after removal of P85
The final set of experiments examined whether the effects of P85 in the MDR cells can be reversed. For this purpose the MCR7/ADR cells were first exposed to 0.1% P85 and then washed with PBS to remove P85. The Pgp functional activity and ATP levels in cells were determined at different time points. In a separate experiment the cytoxicity of Doxorubicin (IC50) to the cells was also determined and expressed as RRI, which in this study was determined as the ratio of IC50 of the drug in the cells before and after exposure to P85. Finally, to determine the amounts of P85 retained within the cells the uptake and retention of the copolymer at different time points was measured in the experiment using radioactively labeled 3H-P85. The Pgp function rapidly restored after approximately 1 hr (supplementary Fig. S3A). The restoration of Pgp coincided with a rapid decrease in the amount of the cell-associated 3H-P85 (Fig. S3B). However, the ATP levels did not restore in the same time frame and remained low for at least 5 hrs (Fig. S3C). Ultimately, the ATP increased to the pre-treatment values after 10 hrs. Interestingly, the RRI followed the same trend as the Pgp activity (Fig. S3D), suggesting that P85-induced sensitization of the cells was abolished in about 1 hr after P85 removal.
4. Discussion
Pluronic-based Doxorubicin chemotherapy developed by us has completed Phase II clinical trials and shown promise in patients with advanced esophageal cancer [9], [10]. However, the mechanisms of the chemosensitization effects of Pluronic in drug cancers still remained unclear. The most intriguing part in these effects is the apparent selectivity of the block copolymers with respect to the MDR cell metabolic pathways resulting in depletion of intracellular ATP pools in resistant cells but not in their sensitive counterparts [3, 11]. The initial explanation of this phenomenon focused on the high energy consumption by MDR cells due to over-expression of Pgp ATPase, which can exhaust the ATP pools under conditions when the metabolic processes are impaired by the copolymer [3]. This is partially supported by the new data in the present study suggesting that a highly selective inhibitor of Pgp, GF120918, abolishes ATP depletion by Pluronic in MDR cells. Nevertheless, the present findings suggest that this hypothesis is at least not complete, since in the absence of Pluronic GF120918 did not alter the ATP levels in MDR cells. Furthermore, the present paper for the first time provides convincing evidence that Pluronic also differentially affects mitochondrial functions in MDR and non-MDR cells.
Our co-localization studies demonstrate that following the exposure of the MDR and non-MDR cells to the effective doses of P85 the copolymer rapidly internalizes in the cells and co-localizes with mitochondria as early as after 15 min. The mechanisms of internalization of Pluronic have been recently addressed by showing that the block copolymer employs the caveolae-mediated pathway for the cellular entry [28]. Furthermore, binding of Pluronic with the lipid rafts was proposed based on its co-localization with the caveolin-1 and cholera toxin B. Although the relationship between caveolae and mitochondria is still poorly understood it was suggested that caveolae vesicles can intervene in mitochondrial proton transport or turnover [29]. Furthermore, involvement of caveolae and lipids rafts in intracellular trafficking of long chain fatty acids was also suggested [30], [31]. Therefore, we believe that Pluronic may employ similar vesicular pathways and reach mitochondria.
The effects of Pluronic on mitochondrial functions in MDR and non-MDR cells are dose-dependent and strikingly different. Studies using the isolated mitochondria from MCF7/ADR cells demonstrate that at relatively low doses P85 first inhibits the cytochrome c oxidase (complex IV) and then the NADH-ubiquinone oxidoreductase (complex I). In both cases in mitochondria of the non-MDR cells the inhibition of these functions is observed at considerably higher doses of the copolymer. Therefore, there is an intrinsic sensitivity of the respiratory functions in MCF7/ADR cells mitochondria with respect to the copolymer compared to the non-MDR cells mitochondria. Notably, MDR cells have lower mitochondrial membrane potential compared to the non-MDR cells, and use a different major fuel source in energy production [2]. Specifically, the MDR cells predominantly use fats as a source of electrons entering the respiratory chain, while the non-MDR cells employ glucose metabolism for this purpose. Furthermore, mitochondria of MCF7/ADR cells express high levels of mitochondrial uncoupling protein 2 (UCP2), which may contribute to less efficient ATP synthesis [2].
Interestingly, higher responsiveness of the respiratory chain to Pluronic appears to be at least partially linked to Pgp expression, since increased inhibition of oxygen consumption was observed not only in drug-selected MDR cells, but also in cells transfected with Pgp. This is consistent with the prior reports by us that Pgp-transfected cells also display increased responsiveness to Pluronic in ATP depletion [3]. It is well known that Pgp plays multiple roles in cells. For instance, it acts as a lipid “flippase” [32] and contributes to alterations in the membrane lipid composition (e.g. cholesterol) [33]. Furthermore, transfection of MDCK cells with Pgp results in a dramatic increase of the synthesis of glycolipid, globotriaosylceramide [34], which has been linked to the metastatic transformation of cancer cells. Notably, the increase in globotriaosylceramide synthesis can be abolished by inhibitors of the Pgp. Finally, functional Pgp was found in the mitochondria in Doxorubicin-resistant cells [35]. The Pgp localization in the mitochondrial membrane is inversed to that in the plasma membranes, so that the transporter can pump its substrates inside mitochondria. Thus, the Pgp function alone may have drastic affect on the membrane structure, cell signaling and mitochondrial activities. These changes may contribute to increased responsiveness of molecular “targets” of Pluronic, such as complexes I and IV, in the mitochondria of MDR cells. However, it is unlikely that Pgp function is directly involved in modulation of activities of these targets since Pgp inhibitor GF120918 did not affect ATP levels in MDR cells.
The nitroxide bioreduction studies provided two additional important observations. First, the bioreduction rates in MDR cells are dramatically lower in the air than in the nitrogen atmosphere. Second, incubation of MDR cells with Pluronic decreases the bioreduction rate in the air but does not affect that in the nitrogen. Notably, high concentration of Pluronic used in this study (1%) also inhibited bioreduction in non-MDR cells in the air, however, the inhibitory effects in the MDR cells were considerably more pronounced. According to the abundant literature, the main site of the nitroxide bioreduction in the respiratory chain is the ubiquinone that supplies electrons to nitroxides [20]. Therefore, as presented in Scheme 1, the process of the electron transport in mitochondria in the presence of nitroxide can be described by the following four kinetic stages. Stage 1 is the electron entrance to the respiratory chain, which involves the complexes I and II. Stage 2 is the electron transfer to ubiquinone. From ubiquinone the electron can be transferred either to nitroxide (Stage 3: nitroxide bioreduction), or oxygen (Stage 4: oxygen consumption). Stage 4 involves the complexes III and IV. Noteworthy, we demonstrated that in the air Pluronic inhibited both the nitroxide bioreduction and the oxygen consumption. This indicates that in the aerobic conditions at least one of the sites of Pluronic action on the respiratory chain was located before the ubiquinone (Stages 1 and 2). This is fully consistent with the inhibition of the complex I by Pluronic observed in the isolated mitochondria in MDR cells. Also based on this scheme, in the anaerobic conditions the Stage 4 is abolished and the nitroxide is the only electron acceptor. This explains a drastic increase in the nitroxide bioreduction in nitrogen atmosphere. Under these conditions the entrance of the electron in the respiratory chain and the transfer of the electron to ubiquinone are obviously not the rate limiting stages of the process, since Pluronic does not affect the bioreduction rate. Yet abolishment of Pluronic effect on bioreduction in nitrogen atmosphere is consistent with the major effect of the copolymer on the complex IV, which is located downstream of ubiquinone.
Scheme 1.

Schematic representation of the four stages of electron transport in mitochondria in the presence of the nitoxide probe (R-NO.): (1) electron entrance in the respiratory chain; (2) electron transfer to ubiquinone (Q); (3) electron transfer from ubiquinone to nitroxide (nitroxide bioreduction); (4) electron transport from ubiquinone to oxygen (O2) (oxygen consumption).
Based on the analysis of the dose-dependencies of Pluronic effects on the oxygen consumption and ATP levels in MDR cells we conclude that at relatively low concentrations the copolymer can stimulate the ATP synthesis. We also suggest that under these conditions Pluronic may act as an uncoupler. It has been long known that PEO-containing detergents including Pluronics can serve as a K+ channels [36], [37] and uncouple oxidative phosphorylation [38], [39], which reinforces our hypothesis. In contrast, at higher concentrations, due to the inhibition of the complexes I and IV of the respiratory chain the oxygen consumption and ATP synthesis are drastically inhibited. This is also consistent with the inhibition of the total metabolism observed along with the increased lactate production in MDR cells. Furthermore, the impairment of the mitochondrial function is a likely reason for the increased lactate production since upon inhibition of respiration anaerobic glycolysis in the only remaining route for pyruvate consumption. Evidently anaerobic glycolysis does not compensate for the inhibited respiration, which results in the net ATP depletion.
Notably, this study for the first time demonstrates that the impairment of the electron flow in the respiratory chain in MDR cells by Pluronic is accompanied by a decrease of the membrane potential, release of the cytochrome c and ROS production. This is a key observation that may explain the reasons for the enhanced pro-apoptotic signaling in MDR cells that was previously described by us [7]. Indeed, mitochondria is known to play an important role in apoptotic signaling [26]. In particular, the mitochondria dysfunction can lead to production of ROS, cytochrome c release and apoptosis. Mitochondrial ROS generation is the major source of oxidative stress in the cell. Therefore, the effects of Pluronic on the mitochondrial functions are not only related to the ATP depletion but also to the enhanced cell death induced by the drug.
The inhibition of the Pgp, however, is also a critical factor in the sensitization of the MDR cells. As was previously demonstrated the Pgp inhibition by Pluronic includes two major components [3]. First, the binding of Pluronic with the cell plasma membrane results in inhibition of the Pgp ATPase activity; second, the depletion of the intracellular ATP deprives the drug efflux transporter of the energy source necessary for its function. It was shown previously that both components are essential for the potent inhibition of Pgp by Pluronic: the energy restoration through ATP supplementation, or elimination of the direct contact of Pluronic with Pgp expressing membranes, each result in restoration of the Pgp efflux function in the cell plasma membrane [3]. This is clearly exhibited in the experiment studying the recovery of the MDR functions in the resistant cells after removal of P85. The washing of the cells resulted in a rapid decrease of in the amount of the membrane-bound copolymer, which was accompanied by a restoration of the Pgp functional activity in the cell plasma membrane. This happened despite of the fact that the ATP levels remained depleted for some additional time, which is consistent with multiple mechanisms of Pluronic effects in MDR cells and, particularly, existence of its distinct targets in the mitochondria. Interestingly, the cellular resistance also restored along with the Pgp function.
Altogether, these studies allow recapitulating the sensitization effects of Pluronic in MDR cells. Pluronic rapidly binds with the cell plasma membrane, transports into the cells, and reaches the mitochondria. This leads to concurrent inhibition of the Pgp ATPase and depletion of ATP due to the inhibition of the respiratory chain. As a result, the drug efflux system also becomes inhibited, permitting a more efficient entry of the drug into the cells. Concurrently, due to the impairment of the mitochondrial function the production of ROS and release of the cytochrome c promotes apoptosis and cell death induced by the drug. The responses to Pluronic are very different in the non-MDR cells. First, Pluronic practically does not affect drug transport into such cells [4]. Second, due to differences between the MDR and non-MDR cells metabolism and possibly the mitochondrial organization Pluronic does not inhibit respiration in the non-MDR cells. This is potentially very important for the chemotherapy because the toxicity of the drug copolymer formulation with respect to non-MDR cells does not increase [4]. This may explain favorable safety profiles observed with Doxorubin – Pluronic formulations in patients in the clinical trials [9],[10].
Supplementary Material
Footnotes
Publisher's Disclaimer: This is a PDF file of an unedited manuscript that has been accepted for publication. As a service to our customers we are providing this early version of the manuscript. The manuscript will undergo copyediting, typesetting, and review of the resulting proof before it is published in its final citable form. Please note that during the production process errors may be discovered which could affect the content, and all legal disclaimers that apply to the journal pertain.
References
- 1.Gottesman MM, Fojo T, Bates SE. Multidrug resistance in cancer: role of ATP-dependent transporters. Nat Rev Cancer. 2002;2(1):48–58. doi: 10.1038/nrc706. [DOI] [PubMed] [Google Scholar]
- 2.Harper ME, Antoniou A, Villalobos-Menuey E, Russo A, Trauger R, Vendemelio M, George A, Bartholomew R, Carlo D, Shaikh A, Kupperman J, Newell EW, Bespalov IA, Wallace SS, Liu Y, Rogers JR, Gibbs GL, Leahy JL, Camley RE, Melamede R, Newell MK. Characterization of a novel metabolic strategy used by drug-resistant tumor cells. FASEB J. 2002;16(12):1550–1557. doi: 10.1096/fj.02-0541com. [DOI] [PubMed] [Google Scholar]
- 3.Batrakova EV, Li S, Elmquist WF, Miller DW, Alakhov VY, Kabanov AV. Mechanism of sensitization of MDR cancer cells by Pluronic block copolymers: Selective energy depletion. Br J Cancer. 2001;85(12):1987–1997. doi: 10.1054/bjoc.2001.2165. [DOI] [PMC free article] [PubMed] [Google Scholar]
- 4.Alakhov V, Moskaleva E, Batrakova EV, Kabanov AV. Hypersensitization of multidrug resistant human ovarian carcinoma cells by pluronic P85 block copolymer. Bioconjug Chem. 1996;7(2):209–216. doi: 10.1021/bc950093n. [DOI] [PubMed] [Google Scholar]
- 5.Venne A, Li S, Mandeville R, Kabanov A, Alakhov V. Hypersensitizing effect of pluronic L61 on cytotoxic activity, transport, and subcellular distribution of doxorubicin in multiple drug-resistant cells. Cancer Res. 1996;56(16):3626–3629. [PubMed] [Google Scholar]
- 6.Batrakova E, Lee S, Li S, Venne A, Alakhov V, Kabanov A. Fundamental relationships between the composition of pluronic block copolymers and their hypersensitization effect in MDR cancer cells. Pharm Res. 1999;16(9):1373–1379. doi: 10.1023/a:1018942823676. [DOI] [PubMed] [Google Scholar]
- 7.Minko T, Batrakova EV, Li S, Li Y, Pakunlu RI, Alakhov VY, Kabanov AV. Pluronic block copolymers alter apoptotic signal transduction of doxorubicin in drug-resistant cancer cells. J Control Release. 2005;105(3):269–278. doi: 10.1016/j.jconrel.2005.03.019. [DOI] [PMC free article] [PubMed] [Google Scholar]
- 8.Rapoport N, Marin AP, Timoshin AA. Effect of a polymeric surfactant on electron transport in HL-60 cells. Arch Biochem Biophys. 2000;384(1):100–108. doi: 10.1006/abbi.2000.2104. [DOI] [PubMed] [Google Scholar]
- 9.Danson S, Ferry D, Alakhov V, Margison J, Kerr D, Jowle D, Brampton M, Halbert G, Ranson M. Phase I dose escalation and pharmacokinetic study of pluronic polymer-bound doxorubicin (SP1049C) in patients with advanced cancer. Br J Cancer. 2004;90(11):2085–2091. doi: 10.1038/sj.bjc.6601856. [DOI] [PMC free article] [PubMed] [Google Scholar]
- 10.Armstrong JBA, Newman C, Alakhov V, Pietrzynski G, Campbell S, Corrie P, Ranson M, VJW SP1049C as first-line therapy in advanced (inoperable or metastatic) adenocarcinoma of the oesophagus: a phase II window study. J Clin Oncol. 2006;24(18S):4080. [Google Scholar]
- 11.Batrakova EV, Li S, Alakhov VY, Miller DW, Kabanov AV. Optimal structure requirements for pluronic block copolymers in modifying P-glycoprotein drug efflux transporter activity in bovine brain microvessel endothelial cells. J Pharmacol Exp Ther. 2003;304(2):845–854. doi: 10.1124/jpet.102.043307. [DOI] [PubMed] [Google Scholar]
- 12.Evers R, Kool M, Smith AJ, van Deemter L, de Haas M, Borst P. Inhibitory effect of the reversal agents V-104, GF120918 and Pluronic L61 on MDR1 Pgp-, MRP1- and MRP2-mediated transport. Br J Cancer. 2000;83(3):366–374. doi: 10.1054/bjoc.2000.1260. [DOI] [PMC free article] [PubMed] [Google Scholar]
- 13.Wu M, Neilson A, Swift AL, Moran R, Tamagnine J, Parslow D, Armistead S, Lemire K, Orrell J, Teich J, Chomicz S, Ferrick DA. Multiparameter metabolic analysis reveals a close link between attenuated mitochondrial bioenergetic function and enhanced glycolysis dependency in human tumor cells. Am J Physiol Cell Physiol. 2007;292(1):C125–136. doi: 10.1152/ajpcell.00247.2006. [DOI] [PubMed] [Google Scholar]
- 14.Amo T, Yadava N, Oh R, Nicholls DG, Brand MD. Experimental assessment of bioenergetic differences caused by the common European mitochondrial DNA haplogroups H and T. Gene. 2008;411(1–2):69–76. doi: 10.1016/j.gene.2008.01.007. [DOI] [PMC free article] [PubMed] [Google Scholar]
- 15.Birch-Machin MA, Briggs HL, Saborido AA, Bindoff LA, Turnbull DM. An evaluation of the measurement of the activities of complexes I–IV in the respiratory chain of human skeletal muscle mitochondria. Biochem Med Metab Biol. 1994;51(1):35–42. doi: 10.1006/bmmb.1994.1004. [DOI] [PubMed] [Google Scholar]
- 16.Rustin P, Chretien D, Bourgeron T, Gerard B, Rotig A, Saudubray JM, Munnich A. Biochemical and molecular investigations in respiratory chain deficiencies. Clin Chim Acta. 1994;228(1):35–51. doi: 10.1016/0009-8981(94)90055-8. [DOI] [PubMed] [Google Scholar]
- 17.Miyadera H, Shiomi K, Ui H, Yamaguchi Y, Masuma R, Tomoda H, Miyoshi H, Osanai A, Kita K, Omura S. Atpenins, potent and specific inhibitors of mitochondrial complex II (succinate-ubiquinone oxidoreductase) Proc Natl Acad Sci U S A. 2003;100(2):473–477. doi: 10.1073/pnas.0237315100. [DOI] [PMC free article] [PubMed] [Google Scholar]
- 18.Krahenbuhl S, Chang M, Brass EP, Hoppel CL. Decreased activities of ubiquinol:ferricytochrome c oxidoreductase (complex III) and ferrocytochrome c:oxygen oxidoreductase (complex IV) in liver mitochondria from rats with hydroxycobalamin[c-lactam]-induced methylmalonic aciduria. J Biol Chem. 1991;266(31):20998–21003. [PubMed] [Google Scholar]
- 19.Villani G, Attardi G. In vivo control of respiration by cytochrome c oxidase in wild-type and mitochondrial DNA mutation-carrying human cells. Proc Natl Acad Sci U S A. 1997;94(4):1166–1171. doi: 10.1073/pnas.94.4.1166. [DOI] [PMC free article] [PubMed] [Google Scholar]
- 20.Ferrari M, Fornasiero MC, Isetta AM. MTT colorimetric assay for testing macrophage cytotoxic activity in vitro. J Immunol Methods. 1990;131(2):165–172. doi: 10.1016/0022-1759(90)90187-z. [DOI] [PubMed] [Google Scholar]
- 21.Mathews CK, Van Holde KE, Ahern KG. Biochemistry. Benjamin Cummings; San Francisco, Calif: 2000. [Google Scholar]
- 22.Nikolai Kocherginsky HMS. Nitroxide Spin Labels: Reactions in Biology and Chemistry. CRC; 1995. [Google Scholar]
- 23.Chen K, Morse PD, 2nd, Swartz HM. Kinetics of enzyme-mediated reduction of lipid soluble nitroxide spin labels by living cells. Biochim Biophys Acta. 1988;943(3):477–484. doi: 10.1016/0005-2736(88)90380-x. [DOI] [PubMed] [Google Scholar]
- 24.Chen K, Glockner JF, Morse PD, 2nd, Swartz HM. Effects of oxygen on the metabolism of nitroxide spin labels in cells. Biochemistry. 1989;28(6):2496–2501. doi: 10.1021/bi00432a022. [DOI] [PubMed] [Google Scholar]
- 25.Rapoport N, Marin A, Luo Y, Prestwich GD, Muniruzzaman MD. Intracellular uptake and trafficking of Pluronic micelles in drug-sensitive and MDR cells: effect on the intracellular drug localization. J Pharm Sci. 2002;91(1):157–170. doi: 10.1002/jps.10006. [DOI] [PubMed] [Google Scholar]
- 26.Ott M, Gogvadze V, Orrenius S, Zhivotovsky B. Mitochondria, oxidative stress and cell death. Apoptosis. 2007;12(5):913–922. doi: 10.1007/s10495-007-0756-2. [DOI] [PubMed] [Google Scholar]
- 27.Miller DW, Batrakova EV, Waltner TO, Alakhov V, Kabanov AV. Interactions of pluronic block copolymers with brain microvessel endothelial cells: evidence of two potential pathways for drug absorption. Bioconjug Chem. 1997;8(5):649–657. doi: 10.1021/bc970118d. [DOI] [PubMed] [Google Scholar]
- 28.Sahay G, Batrakova EV, Kabanov AV. Different Internalization Pathways of Polymeric Micelles and Unimers and Their Effects on Vesicular Transport. Bioconjug Chem. 2008 doi: 10.1021/bc8002315. [DOI] [PMC free article] [PubMed] [Google Scholar]
- 29.Goudenege S, Dargelos E, Claverol S, Bonneu M, Cottin P, Poussard S. Comparative proteomic analysis of myotube caveolae after milli-calpain deregulation. Proteomics. 2007;7(18):3289–3298. doi: 10.1002/pmic.200700124. [DOI] [PubMed] [Google Scholar]
- 30.Pohl J, Ring A, Stremmel W. Uptake of long-chain fatty acids in HepG2 cells involves caveolae: analysis of a novel pathway. J Lipid Res. 2002;43(9):1390–1399. doi: 10.1194/jlr.m100404-jlr200. [DOI] [PubMed] [Google Scholar]
- 31.Milger K, Herrmann T, Becker C, Gotthardt D, Zickwolf J, Ehehalt R, Watkins PA, Stremmel W, Fullekrug J. Cellular uptake of fatty acids driven by the ER-localized acyl-CoA synthetase FATP4. J Cell Sci. 2006;119(Pt 22):4678–4688. doi: 10.1242/jcs.03280. [DOI] [PubMed] [Google Scholar]
- 32.Daleke DL. Phospholipid flippases. J Biol Chem. 2007;282(2):821–825. doi: 10.1074/jbc.R600035200. [DOI] [PubMed] [Google Scholar]
- 33.Dos Santos SM, Weber CC, Franke C, Muller WE, Eckert GP. Cholesterol: Coupling between membrane microenvironment and ABC transporter activity. Biochem Biophys Res Commun. 2007;354(1):216–221. doi: 10.1016/j.bbrc.2006.12.202. [DOI] [PubMed] [Google Scholar]
- 34.Lala P, Ito S, Lingwood CA. Retroviral transfection of Madin-Darby canine kidney cells with human MDR1 results in a major increase in globotriaosylceramide and 10(5)- to 10(6)-fold increased cell sensitivity to verocytotoxin. Role of p-glycoprotein in glycolipid synthesis. J Biol Chem. 2000;275(9):6246–6251. doi: 10.1074/jbc.275.9.6246. [DOI] [PubMed] [Google Scholar]
- 35.Munteanu E, Verdier M, Grandjean-Forestier F, Stenger C, Jayat-Vignoles C, Huet S, Robert J, Ratinaud MH. Mitochondrial localization and activity of P-glycoprotein in doxorubicin-resistant K562 cells. Biochem Pharmacol. 2006;71(8):1162–1174. doi: 10.1016/j.bcp.2006.01.006. [DOI] [PubMed] [Google Scholar]
- 36.Atkinson TP, Smith TF, Hunter RL. Histamine release from human basophils by synthetic block co-polymers composed of polyoxyethylene and polyoxypropylene and synergy with immunologic and non-immunologic stimuli. J Immunol. 1988;141(4):1307–1310. [PubMed] [Google Scholar]
- 37.Krylova OO, Pohl P. Ionophoric activity of pluronic block copolymers. Biochemistry. 2004;43(12):3696–3703. doi: 10.1021/bi035768l. [DOI] [PubMed] [Google Scholar]
- 38.Brierley GP, Jurkowitz M, Merola AJ, Scott KM. Ion transport by heart mitochondria. XXV. Activation of energy-linked K + uptake by non-ionic detergents. Arch Biochem Biophys. 1972;152(2):744–754. doi: 10.1016/0003-9861(72)90270-6. [DOI] [PubMed] [Google Scholar]
- 39.Brustovetskii NN, Dedukhova VN, Egorova MV, Mokhova EN, Skulachev VP. Uncoupling of oxidative phosphorylation by fatty acids and detergents suppressed by ATP/ADP antiporter inhibitors. Biokhimiia. 1991;56(6):1042–1048. [PubMed] [Google Scholar]
Associated Data
This section collects any data citations, data availability statements, or supplementary materials included in this article.