Fig. 1.
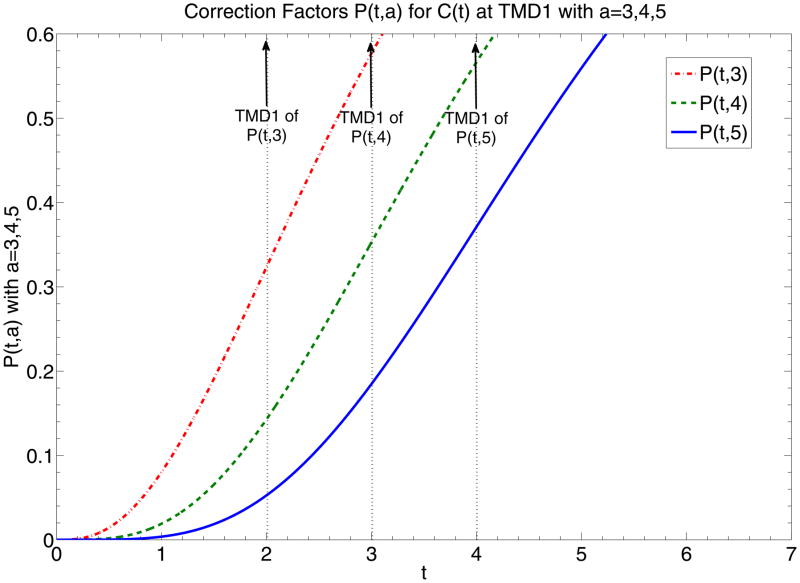
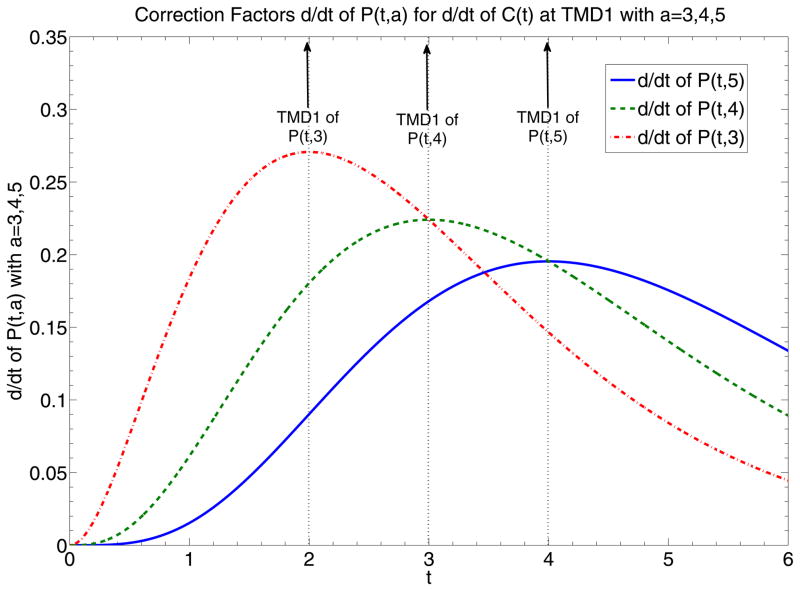
(a) Graphs of P(t, 3), P(t, 4) and P(t, 5), representing correction factors of C(t) given different local AIF’s modeled by normalized e−tta–1 with parameter a equal to 3, 4, and 5. Dotted vertical lines highlight the time points of TMD1 of P(t, 3), P(t, 4) and P(t, 5). Intersection of dotted vertical lines with graphs of P(t, 3), P(t, 4) and P(t, 5) return correction factor values of C(t) at TMD1, correction factor values equal to 0.323, 0.353 and 0.371, which are relatively close to each other. (b) Graphs of and , representing correction factors of and equivalent to the respective AIF’s. Dotted vertical lines highlight the time points of TMD1 of P(t, 3), P(t, 4) and P(t, 5) which are equivalent to the time points of the maximum signal of the respective AIF’s. Intersection of dotted vertical lines with graphs of and return the correction factor values of at TMD1, or equivalently MD1, values equal to 0.27, 0.224 and 0.195, which are not as close to each other as those presented in (a).


