Abstract
Human synovial sarcoma has been shown to exclusively harbor the chromosomal translocation t(X;18) that produces the chimeric gene SYT-SSX. However, the role of SYT-SSX in cellular transformation remains unclear. In this study, we have established 3Y1 rat fibroblast cell lines that constitutively express SYT, SSX1, and SYT-SSX1 and found that SYT-SSX1 promoted growth rate in culture, anchorage-independent growth in soft agar, and tumor formation in nude mice. Deletion of the N-terminal 181 amino acids of SYT-SSX1 caused loss of its transforming activity. Furthermore, association of SYT-SSX1 with the chromatin remodeling factor hBRM/hSNF2α, which regulates transcription, was demonstrated in both SYT-SSX1-expressing 3Y1 cells and in the human synovial sarcoma cell line HS-SY-II. The binding region between the two molecules was shown to reside within the N-terminal 181 amino acids stretch (aa 1–181) of SYT-SSX1 and 50 amino acids (aa 156–205) of hBRM/hSNF2α and we found that the overexpression of this binding region of hBRM/hSNF2α significantly suppressed the anchorage-independent growth of SYT-SSX1-expressing 3Y1 cells. To analyze the transcriptional regulation by SYT-SSX1, we established conditional expression system of SYT-SSX1 and examined the gene expression profiles. The down-regulation of potential tumor suppressor DCC was observed among 1,176 genes analyzed by microarray analysis, and semi-quantitative reverse transcription–PCR confirmed this finding. These data clearly demonstrate transforming activity of human oncogene SYT-SSX1 and also involvement of chromatin remodeling factor hBRM/hSNF2α in human cancer.
Human synovial sarcoma is an aggressive soft tissue tumor that most commonly arises in the lower part of legs of young adults and for which there is currently no effective therapy (1). The chromosomal translocation t(X;18)(p11.2;q11.2) has been reported to be present at high frequency in synovial sarcomas (2–6). Isolation of genomic DNA in the vicinity of the break points has revealed that t(X;18) leads to fusion of the genes SYT localized at 18q11.2, and SSX localized at Xp11.2, respectively, thus resulting in expression of the chimeric protein SYT-SSX (7, 8). Because expression of SYT-SSX has been observed in almost all cases of synovial sarcoma, this is considered to play a central role in tumorigenesis (9). However, there is no direct evidence yet for defining SYT-SSX as an oncogene.
At the time of identification of SYT-SSX, the cDNA sequences of both SYT and SSX were reported (7, 8). The wild-type SYT protein is composed of 387 amino acids and possesses a QPGY domain that contains a characteristic 100-aa stretch that is rich in glutamine, proline, glycine, and tyrosine residues, as well as several putative SH2 and SH3 binding motifs (10). The SSX protein contains 188 amino acids, and its N-terminal region exhibits homology to the Kruppel-associated box (KRAB), which is found as a transcriptional repressor domain in Kruppel-type zinc finger protein (11). Except for the KRAB domain, no significant homologies to known functional sequences including DNA binding motifs were found in the SSX protein. SYT was found to be expressed ubiquitously, and the mRNA of SSX has been detected only in testis and thyroid gland.
Although the role of SYT-SSX in cellular transformation is still unknown, recent immunofluorescent microscopy studies revealed that SYT-SSX is colocalized with a polycomb group complex, which can be involved in homeotic gene silencing (12) and also with hBRM/hSNF2α, a component of the SWI/SNF complex, which regulates chromatin remodeling (13).
In this study, we have addressed whether SYT-SSX chimeric protein has transforming potential. We demonstrate that SYT-SSX1-expressing 3Y1 cells exhibit enhanced growth rate, anchorage-independent growth in soft agar, and tumor-forming potential in nude mice. We also demonstrate association of SYT-SSX1 with the chromatin remodeling factor hBRM/hSNF2α, which is shown to be required for SYT-SSX1-dependent transforming activity. In SYT-SSX1-inducible 3Y1 cells, analysis of gene expression profiles showed suppression of expression levels of the potential tumor suppressor gene deleted in colorectal cancer (DCC), which was confirmed by further semiquantitative reverse transcription (RT)–PCR analysis. Our data clearly demonstrate the transforming activity of SYT-SSX1 and also suggest the implication of hBRM/hSNF2α in SYT-SSX1-induced transformation, presumably through regulation of DCC levels.
Materials and Methods
Plasmids, Cells, and Antibodies.
cDNAs of the human chimeric gene SYT-SSX1 and wild-type SSX1 were amplified from surgically resected synovial sarcoma and testis, respectively, by RT-PCR. SYT was amplified from SYT-SSX1 by adding eight amino acids at its C terminus by PCR. Primers used for the amplification of SYT-SSX1, SSX1, and SYT are pairs of SYT-F and SSX-R, SSX-F and SSX-R, and SYT-F and SYT-R, respectively, and sequences of primers are as follows. SYT-F: CCG CTC GAG ATG TCT GTG GCT TTC GC; SSX-R: GCG CGG CCG CTG GGC ATG TGT CGT ATC C; SSX-F: CCC TCG AGG GTG CCA TGA ACG GAG; SYT-R: GCG GCC GCT CAC TGC TGG TAA TTT CCA TAC TGT CCC TGG TCA TAT CCA TAA GG. Amplified fragments were subcloned into XbaI and NotI sites of the expression vector pCXN2 with N-terminal Flag tag sequences (DYKDDDDK), designated as pCXN2-SYT-SSX1, pCXN2-SSX1, and pCXN2-SYT. hBRM/hSNF2α cDNA was previously isolated by Kato and colleagues (14) and subcloned into pcDNA3-HA vector. The mutants of hBRM/hSNF2α, namely hBRM1–333, hBRM1–107, hBRM108–155, hBRM156–205, hBRM206–333, hBRM319–634, and hBRM635–872, were subcloned into pcDNA3-HA-GFP vector. The human synovial sarcoma cell line HS-SY-II was established by Sonobe and colleagues (15). The anti-SSX polyclonal antibody was generated in our laboratory by using SSX peptides (aa 77–223) fused with GST as immunization antigen. The anti-hBRM/SNF2α antibody (Santa Cruz Biotechnology) and the anti-Flag tag antibodies M2 and M5 (Sigma) were purchased.
Establishment of Stable Cell Lines.
3Y1 rat fibroblasts were cultured in 10-cm dishes with DMEM supplemented with 10% FBS (Sigma). At 70% confluence, cells were transfected with 1 μg DNA of pCXN2, pCXN2-SYT-SSX1, pCXN2-SSX1, or pCXN2-SYT, respectively, using Effectene transfection reagent (Qiagen). Forty-eight hours after transfection, cells were seeded in fresh medium supplemented with 0.5 mg/ml G418 sulfate (Calbiochem), and drug-resistant colonies were isolated.
Cell Lysis for Immunoprecipitation and Immunoblotting.
Cells were lysed in radioimmunoprecipitation assay (RIPA) buffer (10 mM Tris, pH 7.4/5 mM EDTA/150 mM NaCl/10% glycerol/1% Triton X-100/1% sodium deoxycholate/0.1% SDS/1 mM PMSF/1 mM sodium orthovanadate) and clarified by microcentrifugation at × 12,000 g for 10 min at 4°C. Supernatants were assayed in immunoprecipitation and immunoblotting using standard methods (16). Nuclear extraction procedures were based on a method described by Dignam et al. (17).
Cell Growth Analysis and Colony Formation Assay in Soft Agar.
The methods of cell growth analysis and colony formation assay were described (18). Briefly, to assess the growth rates of 3Y1 cell lines, 1 × 10⁵ cells were plated in 6-cm dishes. For the colony formation assay, 5 × 10⁵ cells were plated in 0.4% soft agar and incubated for 3 weeks.
Tumor Formation Assay in Nude Mice.
Some 1 × 10⁷ cells in PBS were injected s.c. into BALB/c nude mice. Three weeks after cell inoculation, the diameters of newly formed tumors were determined, mice were killed after appropriate anesthesia, and tumor tissues were subjected to immunostaining and immunoblotting.
Analysis of cDNA Expression Profile.
Conditional expression of SYT-SSX1 in the 3Y1 cell line was established by the tet-off system (CLONTECH). mRNA was extracted from 3Y1 cells treated or not with 50 ng/ml doxycycline and subjected to Atlas cDNA expression array (CLONTECH), and data were analyzed by a general standardization program.
Semiquantitative RT-PCR Analysis.
The amount of mRNA was quantified by the methods described by Jensen, et al. (19). RT-PCR was performed at different cycle numbers, intensities of amplified fragments were plotted on a graph, and the amount of each mRNA was compared within linear range. The primers used for RT-PCR are as follows. For rat WT1, forward primer 18-F: GAC CTG AAC GCG CTG CTG, and reverse primer 258-R: CTG CTC CTC GTG CGG CTC; for rat DCC, forward primer 181-F: TGC TCT GCA GAG TCT GAC, and reverse primer 414-R: TCC TGC TAC CAT AAC TTT TGC; and for rat ribosomal protein L32 (RPL32), forward primer RPL237-F: TCT GGT CCA CAA CGT CAA GG, and reverse primer RPL380-R: GGA TTG GTG ACT CTG ATG GC.
Results
Assessment of Transforming Activity of 3Y1 Cell Lines Constitutively Expressing SYT, SSX1, and SYT-SSX1.
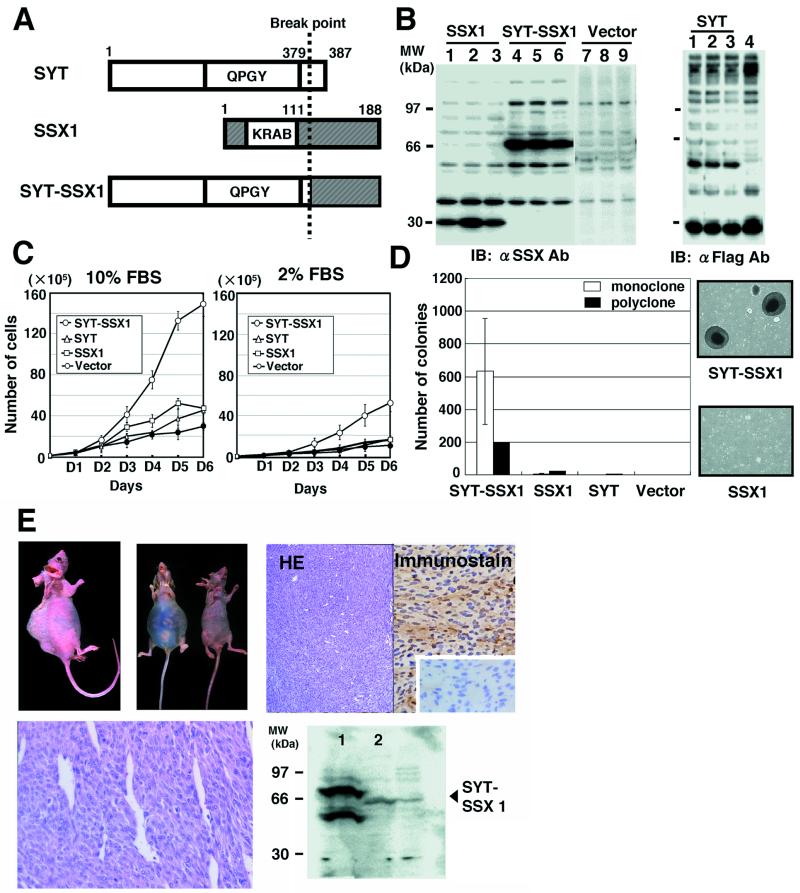
To examine transforming activity of the human synovial sarcoma-associated chimeric gene product SYT-SSX1, we have established a series of 3Y1 rat fibroblast cell lines, which stably express SSX1, SYT-SSX1, and SYT (Fig. 1A). The expression levels of SSX1, SYT-SSX1, and SYT of three representative clones were analyzed by immunoblotting, sized at 30, 67, and 57 kDa, respectively (Fig. 1B). First, we have determined the growth rates of three independent clones of established 3Y1 cell lines and found that SYT-SSX1-expressing 3Y1 cells grew significantly faster than control cells in the presence of either 10% or 2% serum condition (Fig. 1C). Expression of wild-type SSX1 slightly enhanced the growth rates of 3Y1 cells only in 10% serum condition (Fig. 1C).
Figure 1.
Transforming activity of SYT-SSX1-expressing 3Y1 cells. (A) Schematic structure of the SYT, SSX1, and SYT-SSX1 proteins. The break point of chromosomal translocation for chimeric gene production is indicated by a broken line. (B) Stable expression of SSX1, SYT-SSX1, and SYT in 3Y1 cells. (Left) Expression levels of SSX1 (lane 1, clone F1–7; lane 2, F1–10; lane 3, F1–23) and of SYT-SSX1 (lane 4, Y1–8; lane 5, Y1–17; lane 6, Y1–24) and vector alone (lanes 7–9) analyzed by anti-SSX antibody. (Right) SYT expression (lane 1, clone SYT-1; lane 2, SYT-2; lane 3, SYT-4; lane 4, vector) by anti-Flag Ab. (C) Growth rates of each SSX1-, SYT-SSX1-, and SYT-expressing cell lines in culture with 10% (Left) and 2% (Right) serum. The averages of cell numbers of three independent clones were plotted and standard deviations are indicated as vertical bars. (D) Analysis of anchorage-independent growth of SYT-SSX1-expressing cells. The averages of colony numbers sized larger than 0.2 mm of three independent clones of each SSX1-, SYT-SSX1-, and SYT-expressing cells were plotted as open bar graphs with standard deviations indicated as vertical bars. SSX1, SYT-SSX1, and SYT-expression vectors were transfected to 3Y1 cells and after selected by G418, resistant clones were plated as polyclonal state, and the number of the formed colonies were measured. Photographs of representative colonies are shown on the right. (E) Tumor growth in nude mice. SYT-SSX1-expressing 3Y1 cells formed tumor masses at the back and in the peritoneal cavity of nude mice (Upper Left). Expression levels of SYT-SSX1 in formed tumors were confirmed by immunostaining (Upper Right) and immunoblotting (Lower Right). Microscopic appearance of tumors is shown by hematoxylin-eosin staining (Lower Left).
To examine whether SYT-SSX1-expressing 3Y1 cells have an increased anchorage-independent growth activity, we have carried out colony formation assays in soft agar and arbitrarily classified colonies by size ranging from small to large. We have examined all established 3Y1 clones expressing SYT-SSX1, SSX1, and SYT and found that only SYT-SSX1-expressing 3Y1 cells formed both small and large colonies (Fig. 1D). Contrarily, wild-type SSX1-expressing 3Y1 cells were observed to form only few small colonies (Fig. 1D). Furthermore, to avoid the marker-selected clonal bias of the established cells, we performed a colony formation assay by using G418-selected polyclonal populations of 3Y1 cells that were transfected by the expression plasmid for SYT, SSX1, and SYT-SSX1 and similar results were observed (Fig. 1D).
To confirm the tumor forming potential of SYT-SSX1-expressing 3Y1 cells in vivo, we have s.c. injected established 3Y1 clones expressing either SYT-SSX1, SSX1, or SYT on the backs of nude mice. Three weeks after injection, SYT-SSX1-expressing cells formed tumor masses larger than 2 cm in diameter, whereas no significant tumor masses were observed in mice that were injected with SSX1- or SYT-expressing cells (Table 1 and Fig. 1E). Furthermore, i.p. injection of 3Y1 clones showed that SYT-SSX1, but not SSX1 induced diffusely disseminated tumor masses within the peritoneal cavity, which also invaded the gastrointestinal tract (Fig. 1E). The presence of forced expressed SYT-SSX1 protein in newly formed tumors was demonstrated both by immunostaining and immunoblotting (Fig. 1E). The SYT-SSX1-induced tumors depicted typical morphological features of human synovial sarcomas such as hemangiopericytomatous pattern (Fig. 1E).
Table 1.
Tumor formation in nude mice
| Clone | S.C. | P.C. |
|---|---|---|
| SYT-SSX1-Y1-7 | +++ | +++ |
| SYT-SSX1-Y1-8 | +++ | ND |
| SYT-SSX1-Y1-17 | +++ | ND |
| SYT-SSX1-Y-24 | +++ | ND |
| SSX1-F1-7 | − | ND |
| SSX1-F1-10 | − | ND |
| SSX1-F1-23 | − | ND |
| SSX1-F1-12 | + | − |
| SYT-1 | − | ND |
| SYT-2 | − | ND |
| SYT-4 | − | ND |
| 3Y1-3 | − | ND |
| 3Y1-5 | − | ND |
| 3Y1-6 | − | ND |
S.C., subcutaneous; P.C., peritoneal cavity; +++, >2 cm in diameter; +, 0.5–1 cm; −, < 0.5 cm; ND, not determined.
Mutational Analysis of SYT-SSX1 for Anchorage-Independent Growth Potential in Soft Agar.
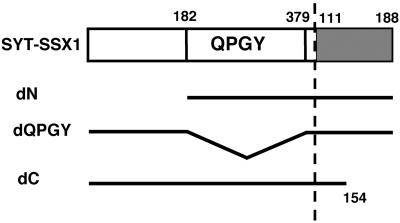
To examine the responsible region(s) of SYT-SSX1 for its transforming activity, we have generated three deletion mutants of SYT-SSX1 that either lacked 181 amino acids at the N-terminal region (dN), 198 amino acids within the QPGY domain (dQPGY), or 34 amino acids at the C-terminal region (dC), respectively (Fig. 2). Each mutant of SYT-SSX1 was transfected into 3Y1 cells, the drug-resistant colonies were collected in polyclonal stage, and the cells were plated into soft agar. After 3 weeks, the numbers of formed colonies were counted. As shown in Table 2, SYT-SSX1-dN-expressing 3Y1 cells did not form colonies of significant size, and SYT-SSX1-dQPGY attenuated further its potential for anchorage-independent growth. On the contrary, SYT-SSX1-dC still preserved colony-forming activity.
Figure 2.
Schematic structure of deletion mutants of SYT-SSX1. Open frames represent the SYT-derived region and shaded frames the SSX-derived region. Numbers indicate the amino acid position of each particular molecule.
Table 2.
Anchorage-independent growth of 3Y1 cells expressing SYT-SSX1 mutants
| SYT-SSX1 | Size of
colonies, mm
|
||
|---|---|---|---|
| Small (0.1–0.2) | Medium (0.2–0.5) | Large (>0.5) | |
| WT | 131 | 62 | 8 |
| dN | 1 | 0 | 0 |
| dQPGY | 18 | 10 | 0 |
| dC | 62 | 42 | 0 |
| Vector | 0 | 0 | 0 |
Representative result of three independent experiments. WT, wild-type.
Association of SYT-SSX1 with the Chromatin Remodeling Factor hBRM/SNF2α in SYT-SSX1-Expressing 3Y1 Cells and in the Human Synovial Sarcoma Cell Line HS-SY-II.
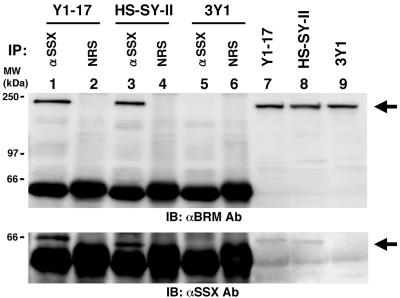
Consistent with our immunocytochemical observations that SYT-SSX1 localized in the nucleus of 3Y1 cells (data not shown), Thaete, et al. (13) recently reported the colocalization of SYT-SSX1 with the chromatin remodeling factor hBRM/hSNF2α. To examine whether SYT-SSX1 binds to hBRM/hSNF2α in 3Y1 cells, we prepared the nuclear extracts of SYT-SSX1 expressing 3Y1 cells and performed immunoprecipitation by anti-SSX antibody. Approximately 10% fraction of hBRM/hSNF2α could be precipitated with SYT-SSX1 (Fig. 3, lane 1). Furthermore, we also demonstrated that the authentically expressed SYT-SSX1 bound to hBRM/hSNF2α in the HS-SY-II human synovial sarcoma cell line (Fig. 3, lane 3).
Figure 3.
Association of SYT-SSX1 with hBRM/hSNF2α in SYT-SSX1-expressing 3Y1 cells (clone Y1–17) and in the HS-SY-II human synovial sarcoma cell line. Immunoprecipitation of hBRM/hSNF2α by anti-SSX antibody using nuclear extracts from clone Y1–17 (lanes 1 and 2), HS-SY-II (lanes 3 and 4), and 3Y1 (lanes 5 and 6). Immunoprecipitants were probed with anti-hBRM antibody (Upper) or anti-SSX antibody (Lower). NRS stands for normal rabbit serum as a control. Nuclear extracts containing 200 μg of proteins were applied for immunoprecipitation. Lanes 7–9: 20 μg of nuclear extracts per lane of indicated cells were applied for immunoblotting.
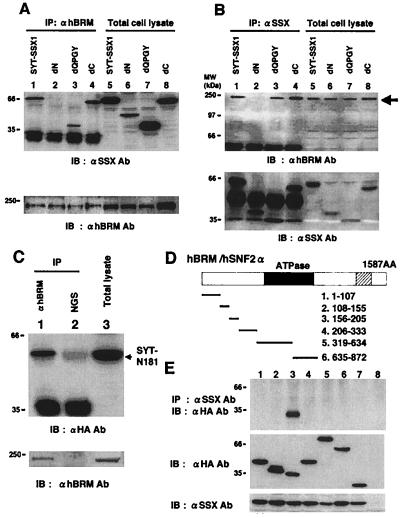
By using transient protein expression system in 293T human embryonal kidney cells, in which association of SYT-SSX1 and hBRM/hSNF2α can be observed (Fig. 4A, lane 1), we have analyzed the region of SYT-SSX1 that is responsible for association with hBRM/hSNF2α, and demonstrated that SYT-SSX1-dN lost its binding ability (Fig. 4 A and B, lanes 2). For further confirmation, we expressed N terminus 181 amino acids of SYT-SSX1 (designated as SYT-N181) with HA-tag (Fig. 4C, lane 3) and showed that anti-hBRM antibody could precipitate SYT-N181 (Fig. 4C, lane 1).
Figure 4.
Analysis of the binding regions of SYT-SSX1 and hBRM/hSNF2α in 293T cells. (A) SYT-SSX1 and its three deletion mutants (Fig. 2) expressed in 293T cells were immunoprecipitated with anti-hBRM/hSNF2α antibody and probed with anti-SSX antibody (Upper, lanes 1–4). Expression levels of SYT-SSX1 and its mutants were examined by immunoblotting (Upper, lanes 5–8). Immunoprecipitants and total cell lysates were also probed with anti-hBRM antibody (Lower). Lysates with 200 μg of proteins were used for immunoprecipitation and 20 μg of total cell lysates were applied for immunoblotting. (B) 293T cell lysates expressing SYT-SSX1 and its mutants were immunoprecipitated with anti-SSX antibody and probed with anti-hBRM antibody (Upper, lanes 1–4) or with anti-SSX antibody (Lower, lanes 1–4). Protein expression levels of endogenous hBRM/hSNF2α (Upper, lanes 5–8) and SYT-SSX1 and its mutants (Lower, lanes 5–8) are displayed. (C) Association of hBRM/hSNF2α with N terminus 181 amino acids of SYT. pcDNA3- HA-GFP-SYT-N181 was transfected to 293T cells and total cell lysates were immunoprecipitated with anti-BRM antibody (lane 1) or normal goat serum (NGS; lane 2) and probed with anti-HA antibody. Expression levels of SYT-N181 are shown in lane 3. Immunoprecipitants and total cell lysates were also probed with anti-hBRM antibody (Lower). (D) Schematic structure of hBRM/hSNF2α and its mutants. The closed frame represents ATPase domain and the shaded frame bromo domain. The number of amino acids comprising six mutants are described. (E) Analysis of the binding region of hBRM/hSNF2α to SYT-SSX1. Six mutants of hBRM were tagged with HA-GFP, coexpressed with SYT-SSX1, and SYT-SSX1 was immunoprecipitated by anti-SSX antibody and probed with anti-HA tag antibody to detect coprecipitated mutants of hBRM/hSNF2α (Top). Confirmations of expression levels of hBRM-derived mutants and SYT-SSX1 are shown in the Middle and Bottom. Lanes 1 to 6 correspond to the number of mutants described above. Lane 7, HA-GFP; lane 8, empty vectors.
In vitro studies (13) have suggested that the N terminus of hBRM/hSNF2α binds to SYT-SSX1. For analysis of the binding region of hBRM/hSNF2α to SYT-SSX1, we have therefore generated six mutants of hBRM/SNF2α encompassing 1 to 872 amino acids as shown in Fig. 4D. By using 293T cells, we have coexpressed SYT-SSX1 with each of the six mutants of hBRM/hSNF2α, and demonstrated that hBRM156–205 composed of 50 amino acids coprecipitated with SYT-SSX1 after incubation with anti-SYT-SSX1 antibody (Fig. 4E).
Overexpression of SYT-SSX1-Binding Region of hBRM/hSNF2α Suppressed Anchorage-Independent Growth of SYT-SSX1-Expressing 3Y1 Cells.
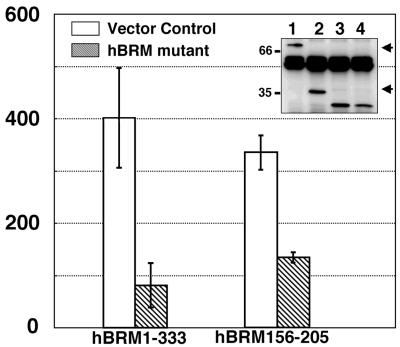
To examine whether hBRM/hSNF2α has an essential role for SYT-SSX1 induction of transforming activity, we transfected hBRM156–205 into SYT-SSX1-expressing 3Y1 cells, selected by drug resistance colonies, and performed colony formation assay in soft agar at polyclonal state. As shown in Fig. 5, hBRM156–205 significantly suppressed colony forming activity. For verification, we also expressed hBRM1–333, which was shown to bind to SYT-SSX1 (data not shown) in SYT-SSX1-expressing 3Y1 cells, and found that the hBRM1–333 also reduced the number of formed colonies (Fig. 5B). We also tried to demonstrate suppression effect of hBRM156–205 or hBRM1–333 on anchorage-independent growth of HS-SY-II. However, we failed to examine because HS-SY-II did not form any colony in soft agar.
Figure 5.
Suppression of anchorage-independent growth of SYT-SSX1-expressing 3Y1 cells by dominant negative form of hBRM/hSNF2α. Either hBRM1–333 or hBRM156–205 was transfected in SYT-SSX1-expressing 3Y1 cells (clone Y1–17) together with pBabe-hygo; and after drug selection colony formation assay was performed. The average numbers of formed colonies are shown as bar graphs with standard deviation. The protein expression levels confirmed by immunoprecipitation and immunoblotting by using anti-HA are also displayed. Lane 1, hBRM1–333; lane 2, hBRM156–205; lane 3, HA-GFP as control for hBRM1–333; lane 4, HA-GFP as control for hBRM156–205. Arrowheads indicate two hBRM mutants.
Analysis of Gene Expression Profiles of 3Y1 Cells Containing the Conditional Expression System for SYT-SSX1.
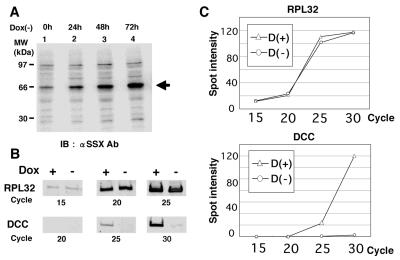
Because we showed that hBRM/hSNF2α was required for SYT-SSX1-induced transforming activity, it was hypothesized that SYT-SSX1 might induce transformation by transcriptional regulation. We have therefore established the SYT-SSX1-inducible expression system in 3Y1 cells by using the tetracycline-off system to analyze the expression profiles of mRNAs. The induced levels of SYT-SSX1 were confirmed by immunoblotting (Fig. 6A). The mRNAs were extracted from 3Y1 cells with or without SYT-SSX1 induction and the expression levels of 1,176 of independent cDNAs were compared by 1.2 Atlas rat cDNA expression array (CLONTECH) (Fig. 6B). As listed in Table 3, analysis of expression profiles shows the candidates of SYT-SSX1 targets exhibiting decrease of expression of at least 4-fold. Among these, we found the tumor suppressor gene products WT1 (20, 21) and DCC (22) as possible targets for SYT-SSX1-induced transformation. However, among up-regulated genes, we did not identify proto-oncogenes or possible activators of cell cycle or tumor growth (data not shown).
Figure 6.
Analysis of gene expression profiles regulated by SYT-SSX1. (A) Establishment of the conditionally inducible system of SYT-SSX1 in 3Y1 cells by the tetracycline-off system. Expression levels of SYT-SSX1 were examined by immunoblotting of total cell lysates of 3Y1 cells after withdrawal of 50 ng/ml of doxycycline. Duration of induction is indicated above the lane numbers. (B and C) Semiquantitative RT-PCR analysis of expression levels of DCC. mRNAs were extracted from 3Y1 cells without induction [Dox(+)] and 48 h after induction [Dox(−)] of SYT-SSX1. After RT reaction, cDNAs of housekeeping ribosomal gene RPL32 or DCC were amplified by PCR at the cycles indicated below. (B) PCR products were loaded on agarose gel and stained with syber green. (C) The intensities of the bands were measured by an image reader (FLA2000, Fuji) and plotted as graphs. These experiments were repeated independently three times.
Table 3.
Gene expression profiles: Downregulated genes by SYT-SSX1
| Gene | Spot intensity
|
Ratio | |
|---|---|---|---|
| Cell-on | Cell-off | ||
| G1/S-specific cyclin C | 7 | 51 | 0.14 |
| Carbonic anhydrase 4 | 28 | 200 | 0.14 |
| Urate oxidase | 8 | 48 | 0.17 |
| CXC chemokine LIX | 7 | 36 | 0.19 |
| Protein kinase C eta type | 2 | 10 | 0.2 |
| Interferon gamma inducing factor precursor | 4 | 18 | 0.22 |
| Selenoprotein | 16 | 70 | 0.23 |
| WT1 | 17 | 72 | 0.24 |
| Acetylcholinesterase, T subunit | 61 | 229 | 0.27 |
| Protein tyrosine phosphatase, striatum enriched | 15 | 56 | 0.27 |
| CREB active transcription factor | 12 | 42 | 0.29 |
| MRK | 4 | 12 | 0.29 |
| Neuromodulin | 19 | 56 | 0.34 |
| GST5-5 | 10 | 29 | 0.34 |
| DCC | 18 | 49 | 0.37 |
| Scavenger receptor class B type I | 3 | 8 | 0.38 |
| Alkaline phosphatase | 30 | 78 | 0.38 |
To confirm the results of gene expression profile analysis, we have isolated mRNA from 3Y1 cells with or without SYT-SSX1 induction and quantified the expression levels of WT1 and DCC mRNAs by semiquantitative RT-PCR. We demonstrate that the mRNA of one of the house keeping genes, namely RPL32 (23), was present independently of SYT-SSX1 in a cycle-dependent manner (Fig. 6C). However, the DCC mRNA was detected in a cycle-dependent manner only in absence of SYT-SSX1 and, after induction of SYT-SSX1, expression of the DCC mRNA was hardly detectable (Fig. 6D). Expression levels of the WT1 mRNA were similar to controls and did not change after SYT-SSX1 induction (data not shown).
Discussion
More than 90% of the cases of human synovial sarcoma have been reported to have the chromosomal translocation t(X; 18). However, to date there is no direct evidence demonstrating the transforming activity of SYT-SSX1. In this study, we have addressed whether SYT-SSX1 can induce transformation. Our data demonstrate that SYT-SSX1-expressing 3Y1 cells exhibit growth rate enhancement and colony formation in soft agar, and induce tumors in nude mice. Therefore, we conclude that SYT-SSX1 primarily possesses transforming activity. However, the transforming activity of SYT-SSX1 in 3Y1 cells was weak when compared with other representative oncogenes, such as ras or src, taking into account that the initial plating number of SYT-SSX1-expressing 3Y1 cells in the colony formation assay was about 50-fold higher than that used for v-Ki-Ras- or v-Src-expressing 3Y1 cells for obtaining comparable numbers of colonies (S.T., unpublished observations).
In mutational analysis, we found that the N-terminal 181 amino acids of SYT-SSX1 were indispensable for the transforming potential. Interestingly, despite almost all parts of SYT, except for the C-terminal nine amino acids, being integrated into SYT-SSX1, the wild-type SYT, which also binds to hBRM/hSNF2α (data not shown), did not induce transformation (Fig. 1). Therefore, additional sequences derived from SSX are required for transformation. Because SYT-SSX1-dC retained transforming potential, the 43 amino acids of SSX1 (positions 111 to 154) in SYT-SSX1-dC are thought to be involved in the transforming activity. Currently we are investigating whether substitution of the C-terminal nine amino acids of SYT by nine amino acids of SSX1 (positions 112 to 120, used as SYT-SSX1) is essential for inducing transformation of 3Y1 cells by establishing stable transformant of the nine amino acids-substituted form of SYT.
Because deletion of the QPGY domain of SYT-SSX1 attenuated the colony forming potential, we hypothesized that the QPGY domain that has tyrosine residues may transduce signals for tumorigenesis, and therefore examined the tyrosine phosphorylation status of SYT-SSX1 in established 3Y1 cell lines. However, no significant tyrosine-phosphorylated band was detected (data not shown). Thus, the mechanism of attenuation of transforming potential of SYT-SSX1-dQPGY remains to be further analyzed.
Because SYT-SSX1 localizes in the nucleus and lacks typical consensus sequences for transcriptional factors, it was supposed that this chimeric protein may act as a transcriptional regulator. Recently, Thaete, et al. (13) published data on SYT-SSX1 colocalized with hBRM/hSNF2α, which is a component of ATP-dependent chromatin remodeling factor (13). These findings prompted us to examine whether SYT-SSX is associated with hBRM/SNF2α in vivo. Our findings demonstrate that SYT-SSX1 binds to hBRM/hSNF2α in SYT-SSX1-expressing 3Y1 cells and also in the HS-SY-II human synovial sarcoma cell line.
The ATP-dependent chromatin remodeling factors were originally described as SWI/SNF complex, which is composed of several subunits and positively regulates the yeast HO promoter (24). Human homologues of these subunits, which have ATPase domains, have been identified as hBRM/hSNF2α and hBRG/hSNF2β (24) and shown to be involved in various cellular responses (25, 26). To date, a possible implication of chromatin remodeling factors in human cancers has been suggested by the reports describing the truncational mutation of INI1/hSNF5 gene in some cases of human malignant rhabdoid tumor (27), decrease of expression levels of hBRM/hSNF2α in ras-transformed cells (28), and association of hBRM/hSNF2α with Rb protein repressing cell cycle (29). In this study, we demonstrated the suppression of colony forming activity of SYT-SSX1 by the expression of SYT-SSX1-binding region of hBRM/hSNF2α, and these data suggested the involvement of hBRM/hSNF2α for SYT-SSX1-induced cellular transformation.
Because transcriptional regulation by SYT-SSX1 through hBRM/SNF2α is thought to be essential for tumorigenesis, we analyzed gene expression profiles in the conditional induction system of SYT-SSX1 in 3Y1 cells and found the reduction of expression levels of two putative tumor suppressor genes, WT1 and DCC. Semiquantitative RT-PCR analysis confirmed SYT-SSX1-mediated reduction of the DCC mRNA, which might therefore be a possible target for SYT-SSX1-induced tumorigenesis. As a decrease of DCC levels has not yet been reported by similar studies for other oncogenes or signal transducers such as Ras (30) or MAP kinase (31), the mechanism and specificity of DCC involved in SYT-SSX1-induced transformation have to be analyzed in further studies. In fact, whether DCC is a real tumor suppressor gene is controversial because the frequencies of spontaneous tumor formation in DCC-deficient mice, such as DCC (+/−), were not significantly changed compared with wild-type mice DCC (+/+) (32).
In the SYT-SSX1-inducible system, suppression of WT1 was only observed in microarray analysis, not in semiquantitative PCR reaction. Thus, we did not conclude that suppression of WT1 was induced by SYT-SSX1. The discrepancy between these two methods might be due to the nonspecific signals of microarray analysis. Because information of the exact oligonucleotide sequences of each spot of microarray was not available, we could not exclude the possibility of nonspecific signals. Therefore, we considered that microarray analysis should be used as a screening and that a semiquantitative RT-PCR method is necessary for verification.
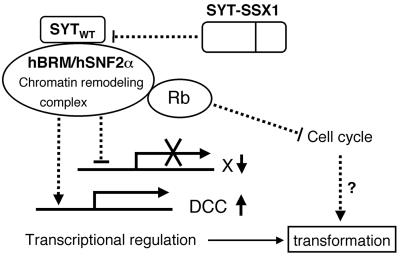
In this study, we clearly demonstrate the transforming activity of SYT-SSX1 and its association with the chromatin remodeling factor hBRM/hSNF2α. Our results also suggest the essential role for hBRM/hSNF2α in SYT-SSX1-induced transformation possibly by suppression of DCC level (Fig. 7). The regulation of expression levels of a tumor suppressor by a chimeric oncogene for human cancer through a chromatin-remodeling factor may provide a new insight into the molecular mechanism of cellular transformation.
Figure 7.
Putative mechanism of SYT-SSX-induced transformation. SYT-SSX may disturb the function of hBRM/hSNF2α possibly bound to wild-type SYT and lead to transforming phenotype.
Acknowledgments
We thank Alexandru C. Stan (Hannover Medical School) for critical reading of manuscript; Michiyuki Matsuda (Osaka University), Masanori Hatakeyama (Hokkaido University), Shinya Yamawaki (Sapporo National Hospital), Hideki Chiba (Sapporo Medical University), and Tsutomu Ohta (National Cancer Center, Japan) for helpful comments; Junichi Miyazaki (Osaka University) for the pCXN2 vector; Yuichi Machida and Katsuhide Miyake (Nagoya University) for their original anti-BRM antiserum; Yasuhiko Nishio (Deptartment of Orthopaedic Surgery, Hokkaido University) for statistical analysis; and Yusuke Ishida, Sumie Oikawa, Yasuko Orba, and Misato Yamada for technical assistance. This work was supported in part by a grant from the Japanese Ministry of Education, Science, and Culture.
Abbreviations
- RT-PCR
reverse transcription–PCR
- aa
amino acid
- RP
ribosomal protein
- DCC
deleted in colorectal cancer
References
- 1.Enzinger F M, Weiss S W. Soft Tissue Tumors. St. Louis: Mosby; 1988. [Google Scholar]
- 2.Turc-Carel C, Dal Cin P, Limon J, Rao U, Li F P, Corson J M, Zimmerman R, Parry D M, Cowan J M, Sandberg A A. Proc Natl Acad Sci USA. 1987;84:1981–1985. doi: 10.1073/pnas.84.7.1981. [DOI] [PMC free article] [PubMed] [Google Scholar]
- 3.Wang-Wuu S, Soukop S W, Lange B J. Cancer Genet Cytogenet. 1987;29:179–181. doi: 10.1016/0165-4608(87)90048-3. [DOI] [PubMed] [Google Scholar]
- 4.Nojima T, Wang Y S, Abe S, Matsuno T, Yamawaki S, Nagashima K. Acta Pathol Jpn. 1990;40:486–493. doi: 10.1111/j.1440-1827.1990.tb01590.x. [DOI] [PubMed] [Google Scholar]
- 5.Knight J C, Reeves B R, Kearney L, Monaco A P, Lehrach H, Cooper C S. Int J Oncol. 1992;1:747–752. [PubMed] [Google Scholar]
- 6.Cooper C S. Adv Cancer Res. 1993;60:75–120. doi: 10.1016/s0065-230x(08)60823-4. [DOI] [PubMed] [Google Scholar]
- 7.Clark J, Rocques P J, Crew A J, Gill S, Shipley J, Chan A M, Gusterson B A, Cooper C S. Nat Genet. 1994;7:502–508. doi: 10.1038/ng0894-502. [DOI] [PubMed] [Google Scholar]
- 8.Crew A J, Clark J, Fisher C, Gill S, Grimer R, Chand A, Shipley J, Gusterson B A, Cooper C S. EMBO J. 1995;14:2333–2340. doi: 10.1002/j.1460-2075.1995.tb07228.x. [DOI] [PMC free article] [PubMed] [Google Scholar]
- 9.Hiraga H, Nojima T, Abe S, Sawa H, Yamashiro K, Yamawaki S, Kaneda K, Nagashima K. Diagn Mol Pathol. 1998;7:102–110. doi: 10.1097/00019606-199804000-00007. [DOI] [PubMed] [Google Scholar]
- 10.Songyang Z, Shoelson S E, Chaudhuri M, Gish G, Pawson T, Haser W G, King F, Roberts T, Ratnofsky S, Lechleider R J, et al. Cell. 1993;72:767–778. doi: 10.1016/0092-8674(93)90404-e. [DOI] [PubMed] [Google Scholar]
- 11.Lim F L, Soulez M, Koczan D, Thiesen H J, Knight J C. Oncogene. 1998;17:2013–2018. doi: 10.1038/sj.onc.1202122. [DOI] [PubMed] [Google Scholar]
- 12.Soulez M, Saurin A J, Freemont P S, Knight J C. Oncogene. 1999;18:2739–2746. doi: 10.1038/sj.onc.1202613. [DOI] [PubMed] [Google Scholar]
- 13.Thaete C, Brett D, Monaghan P, Whitehouse S, Rennie G, Rayner E, Cooper C S, Goodwin G. Hum Mol Genet. 1999;8:585–591. doi: 10.1093/hmg/8.4.585. [DOI] [PubMed] [Google Scholar]
- 14.Chiba H, Muramatsu M, Nomoto A, Kato H. Nucleic Acids Res. 1994;22:1815–1820. doi: 10.1093/nar/22.10.1815. [DOI] [PMC free article] [PubMed] [Google Scholar]
- 15.Sonobe H, Manabe Y, Furihata M, Iwata J, Oka T, Ohtsuki Y, Mizobuchi H, Yamamoto H, Kumano O, Abe S. Lab Invest. 1992;67:498–505. [PubMed] [Google Scholar]
- 16.Sambrook J, Maniatis T, Fritsch E F. Molecular Cloning: A Laboratory Manual. Plainview, NY: Cold Spring Harbor Lab. Press; 1989. [Google Scholar]
- 17.Dignam J D, Lebovitz R M, Roeder R G. Nucleic Acids Res. 1983;11:1475–1489. doi: 10.1093/nar/11.5.1475. [DOI] [PMC free article] [PubMed] [Google Scholar]
- 18.Tanaka S, Ouchi T, Hanafusa H. Proc Natl Acad Sci USA. 1997;94:2356–2361. doi: 10.1073/pnas.94.6.2356. [DOI] [PMC free article] [PubMed] [Google Scholar]
- 19.Jensen J, Serup P, Karlsen C, Nielsen T F, Madsen O D. J Biol Chem. 1996;271:18749–18758. doi: 10.1074/jbc.271.31.18749. [DOI] [PubMed] [Google Scholar]
- 20.Call K M, Glaser T, Ito C Y, Buckler A J, Pelletier J, Haber D A, Rose E A, Kral A, Yeger H, Lewis W H, et al. Cell. 1990;60:509–520. doi: 10.1016/0092-8674(90)90601-a. [DOI] [PubMed] [Google Scholar]
- 21.Gessler M, Poustka A, Cavenee W, Neve R L, Orkin S H, Bruns G A. Nature (London) 1990;343:774–778. doi: 10.1038/343774a0. [DOI] [PubMed] [Google Scholar]
- 22.Fearon E R, Cho K R, Nigro J M, Kern S E, Simons J W, Ruppert J M, Hamilton S R, Preisinger A C, Thomas G, Kinzler K W, et al. Science. 1990;247:49–56. doi: 10.1126/science.2294591. [DOI] [PubMed] [Google Scholar]
- 23.Dudov K P, Perry R P. Cell. 1984;37:457–468. doi: 10.1016/0092-8674(84)90376-3. [DOI] [PubMed] [Google Scholar]
- 24.Kingston R E, Narlikar G J. Genes Dev. 1999;13:2339–2352. doi: 10.1101/gad.13.18.2339. [DOI] [PubMed] [Google Scholar]
- 25.Fryer C J, Archer T K. Nature (London) 1998;393:88–91. doi: 10.1038/30032. [DOI] [PubMed] [Google Scholar]
- 26.Zhao K, Wang W, Rando O J, Xue Y, Swiderek K, Kuo A, Crabtree G R. Cell. 1998;95:625–636. doi: 10.1016/s0092-8674(00)81633-5. [DOI] [PubMed] [Google Scholar]
- 27.Versteege I, Sevenet N, Lange J, Rousseau-Merck M F, Ambros P, Handgretinger R, Aurias A, Delattre O. Nature (London) 1998;394:203–206. doi: 10.1038/28212. [DOI] [PubMed] [Google Scholar]
- 28.Muchardt C, Bourachot B, Reyes J C, Yaniv M. EMBO J. 1998;17:223–231. doi: 10.1093/emboj/17.1.223. [DOI] [PMC free article] [PubMed] [Google Scholar]
- 29.Dean D C. Cell. 2000;101:79–89. doi: 10.1016/S0092-8674(00)80625-X. [DOI] [PubMed] [Google Scholar]
- 30.Zuber J, Tchernitsa O I, Hinzmann B, Schmitz A C, Grips M, Hellriegel M, Sers C, Rosenthal A, Schafer R. Nat Genet. 2000;24:144–152. doi: 10.1038/72799. [DOI] [PubMed] [Google Scholar]
- 31.Roberts C J, Nelson B, Marton M J, Stoughton R, Meyer M R, Bennett H A, He Y D, Dai H, Walker W L, Hughes T R, et al. Science. 2000;287:873–880. doi: 10.1126/science.287.5454.873. [DOI] [PubMed] [Google Scholar]
- 32.Fazeli A, Dckinson S L, Hermiston M L, Tighe R V, Steen R G, Small C G, Stoeckli E T, Keino-Masu K, Masu M, Rayburn H, Simons J, et al. Nature (London) 1997;386:796–804. doi: 10.1038/386796a0. [DOI] [PubMed] [Google Scholar]


