

Abstract
Background:
Following prostate cancer surgery, positive surgical margin (PSM) status varies among institutions and there is evidence that high-volume surgeons and centres obtain better oncological results. However, larger studies recording PSM for radical prostatectomy (RP) are from large “centres of excellence” and not population-based. Cancer Care Ontario undertook an audit of pathology reports to determine the province-wide PSM rate for pathological stage T2 (pT2) disease prostate cancer and to assess the overall and regional-based PSM rates based on surgical volume to understand gaps in quality of care prior to undertaking quality improvement initiatives.
Methods:
Data were extracted as part of the Pathology Project Audit data output (2005, 2006). Pathology reports were submitted to Cancer Care Ontario by Ontario hospitals electronically via the Pathology Information Management System. An experienced cancer pathology coder extracted the PSM data from eligible RP cancer specimen pathology reports. Only reports that provided a pathological stage were included in the analysis. Biopsy and transurethral resection of the prostate reports were excluded. A convenience sample of 1346 reports from 2006 and 728 from 2005 were analyzed. Regression analysis was performed to assess volume-margin associations.
Results:
The median province-wide surgical PSM rate for pT2 disease was 33%, ranging 0–100% among 43 hospitals where RP volumes ranged 12–625. There was no significant correlation (p > 0.05) between volume and PSM by logistic regression with variable odds ratios (95% confidence interval [CI]) for PSM by quartile (1st = 1.66 [0.93–2.96]; 2nd = 0.97 [0.58–1.62]; 3rd = 1.44[0.91–2.29]) compared to the highest volume last quartile. Mean PSM rates between community and teaching hospitals were not significantly different.
Conclusions:
The province-wide PSM rate for pT2 disease prostate cancer undergoing RP is higher than those published from “centres of excellence.” Results from larger volume centres were not statistically significantly better, which contradicts previously published data. Factors, such as individual surgeon, patient selection, pathological processing and interpretation, may explain the differences.
Résumé
Contexte :
Après une chirurgie pour traiter un cancer de la prostate, la présence de marges chirurgicales positives (MCP) varie d’un établissement à l’autre. Des données montrent que les chirurgiens et les centres qui traitent des nombres élevés de patients obtiennent de meilleurs résultats oncologiques. Cela dit, les études de plus grande envergure ayant noté la présence de MCP après une prostatectomie radicale (PR) ont été menées dans de grands « centres d’excellence » et ne sont donc pas fondées sur la population. Action Cancer Ontario a entrepris une vérification de rapports de pathologie afin de déterminer le taux provincial de MCP pour le cancer de la prostate et les taux de MCP en fonction du nombre de chirurgies dans le but de comprendre les lacunes dans la qualité des soins avant de lancer des initiatives d’amélioration de la qualité.
Méthodologie :
Les données ont été obtenues par le Pathology Project Audit (2005, 2006). Des rapports de pathologie ont été soumis par voie électronique à Action Cancer Ontario par des hôpitaux de la province par le biais du Système de gestion d’information pathologique. Un programmeur expérimenté en pathologie cancéreuse a extrait l’information concernant les MCP des rapports de pathologie portant sur des échantillons provenant de cas admissibles de cancer de la prostate traités par PR. Seuls les rapports fournissant un stade pathologique ont été inclus dans l’analyse. Les rapports concernant les biopsies et résections transurétrales de la prostate ont été exclus. Un échantillon convenable de 1346 rapports de 2006 et 728 rapports de 2005 a été analysé. Une analyse par régression a permis d’évaluer les associations entre le nombre de cas traités et les marges chirurgicales.
Résultats :
Le taux médian de MCP pour la province pour les cas de stade pT2 était de 33 %, et se situait entre 0 et 100 % dans 43 hôpitaux où le nombre de PR se chiffrait entre 12 et 625. On n’a noté aucune corrélation significative (p > 0.05) entre le nombre d’interventions et les MCP lors d’une analyse de régression logistique tenant compte des rapports de cotes (intervalle de confiance [CI] à 95 %) pour les marges chirurgicales positives par quartile (1er = 1,6 [0,93–2,96]; 2e = 0,97 [0,58–1,62]; 3e = 1,44 [0,91–2,29]) en comparaison avec le dernier quartile pour le nombre le plus élevé. Les taux de MCP n’étaient pas significativement différents dans les hôpitaux communautaires et les hôpitaux universitaires.
Conclusions :
Le taux provincial de MCP pour les cas de cancer de la prostate de stade pT2 subissant une PR est plus élevé que les taux provenant des « centres d’excellence ». Les résultats des centres traitant des nombres plus élevés n’étaient pas significativement meilleurs sur le plan statistique, ce qui contredit les données publiées antérieurement. Des facteurs comme le chirurgien concerné, la sélection des patients, et l’analyse et l’interprétation pathologiques peuvent expliquer les différences.
Introduction
Radical prostatectomy (RP) is the only treatment modality that reduces mortality among men with localized prostate cancer.1 However, recurrences do occur2,3 with multiple factors, such as pre-treatment serum prostate-specific antigen (PSA), stage, Gleason grade and surgical margin status, are all important.3,4 Surgical margin status is the variable most open to variation and is influenced by case selection,5 stage,2 site of margin,6 surgeon experience,7,8 surgical approach9–11 and pathological interpretation, including interobserver variability.12 Although controversial, a positive surgical margin (PSM) is usually defined as tumour at the inked margin of the resected specimen.12 Evidence consistently supports the premise that patients with a PSM are at increased risk of biochemical recurrence after RP,2,3 yet not all such patients fail.13 The PSM represents the only variable known to influence cancer recurrence that is modifiable in many cases.
Many factors, particularly stage, contribute to a PSM.2 Prior data suggest a PSM range of 10% to 48%.2,7 The existence of PSM among men with organ-confined prostate cancer may occur due to the unique anatomy in close proximity to critical surrounding structures and a deficient capsule particularly at the apex.12 In attempting to minimize morbidity (e.g., nerve-sparing techniques), close dissection to the gland may lead to prostatic incision.
A consistent finding in heath services research has been the strong association between the volume of cases a hospital or surgeon treats and clinical outcomes,14 including morbidity15,16 and oncological control7,8,17–21 with RP. With respect to prostate cancer, data regarding oncological control have focused on the learning curve22 and surgeon volume data,7,8,17–21 as opposed to hospital volume, which has also been demonstrated to influence patient morbidity,16 with RP and oncological outcome in other malignancies.23 Thus, both hospital and surgeon volume, although related,24 appear important in determining outcomes. In the United Kingdom, specialized cancer centres have been created where volume needs to be maintained based on hospital and surgeon volume.25 The implication is that increased volume will reduce morbidity and also improve oncological outcome, such as biochemical failure, which is known to be related to PSM status.26 Smaller centres feel disadvantaged by such decisions and have called for more data.
The current state of knowledge, with respect to volume outcome associations in RP, is deficient in several ways. Firstly, despite the growing literature, no one has examined the PSM question using a population-based dataset. All studies to date have been from “centres of surgical excellence” (i.e., large volume series with few surgeons traditionally from high volume oncology centres in North America). Secondly, only 2 studies have examined PSM and surgeon volume,7,18 with no detailed analysis of hospital factors. In this study we examined population-based PSM data among men with clinically organ-confined prostate cancer and assessed relevant volume-outcome associations.
Methods
Sources of data
By law, in Ontario, Canada, all pathology reports with a cancer diagnosis must be submitted to the Ontario Cancer Registry. For this study, pathology reports of patients having RP, which were submitted to Cancer Care Ontario by Ontario hospitals electronically via the Pathology Information Management System, were audited.27 Data were extracted as part of the Pathology Project Audit data output (2005, 2006) by an experienced pathology coder. The sample included 1346 reports from 2006 and 728 from 2005. In 2005, 2 consecutive months of reports were audited. In 2006, the goal was to sample about 40% of the total RP submitted pathology reports. This was a consecutive sample, although it was adjusted so that at least 10 pathology reports from each of the 43 hospitals (including 10 university teaching centres) were audited.
Only reports that provided a pathological stage were included in analysis. Excluded from this data capture were biopsy and TURP reports. Although data exist for all cases, we limited this analysis to patients with pathologically organ-confined disease (pT2; n = 1577). The rationale for this was that we did not have complete data on clinical stage or serum PSA levels. Furthermore, organ-confined cancers are rare when serum PSA is above 20 ng/mL.28 Therefore, by limiting our cohort to men with organ-confined tumours, our range of patient inclusion is likely to be tight relative to pT3 tumours. Individual surgeon data were not available.
Margin involvement was determined by the local pathologist at the hospital. The information was extracted by an experienced cancer pathology coder based upon eligible RP cancer specimen pathology reports. Furthermore, prior to the audit, pathology and clinical experts provided input into the interpretation of the reports to the extractor.
Statistical analysis
For analyses, hospitals were ranked for total RP volume in the specified time periods studied, not on the number of pT2 cases. Power calculations indicate that a sampling of 2 years is sufficient to demonstrate a volume-outcome relationship PSM rates. Logistic regression was conducted using the GENMOD Procedure (SAS Institute Inc., Cary, NC) to assess volume-margin associations, as well as PSM rate in hospital settings. Over-dispersion was accounted for using the generalized estimating approach. The Wilcoxon Rank Sum Test was used for continuous comparisons.
An alternative to examining the surgical volume continuously is to categorize surgical volume by quartile values. These quartile values can break down the surgical volume as follows: Category 1: 0–73 RPs (minimum to Q1 number of RPs done); Category 2: 74–121 RPs (Q1 to median number of RPs done); Category 3: 122–182 RPs (median to Q3 number of RPs done); and Category 4: 183+ RPs (Q3 to maximum number of RPs done).
In the categories above, Q1 represents the 25th percentile; hence, 25% of the sampled hospitals conducted less than 73 RPs. Analyses were performed using SAS 9.1.3 (SAS Institute Inc., Cary, NC). The advantage of using categorical over using the continuous surgical volume is that, in our case, surgical volume is neither linearly related to the PSM rates (which would be assumed for linear regression), nor is it linearly related to the log odds of PSM (which would be assumed for logistic regression). Hence, using surgical volume categories for logistic regression may be the better alternative.
Community hospitals were also compared to teaching hospitals and this was done in increments of 30, 50 and 60, where possible by volume of RP to delineate any relationships. Due to having data on only 43 hospitals, our study power is somewhat limited. This is because we only have 10 teaching hospitals and 33 non-teaching hospitals. For an analysis with 80% power and a Type I Error of 0.05, we would need an odds ratio (OR) of 6 or higher for non-teaching hospitals versus teaching hospitals to have statistically significant evidence of an association between type of hospital and pT2 PSM rate. We would also need an OR of 2.2 or higher for every decrease of 50 patients in surgical volume to have statistically significant evidence of an association between pT2 PSM rate and surgical volume. However, we sampled 58% of the provincial total RPs, which is a large number. This counteracts the smaller number of hospitals to a large degree, meaning that our estimates of PSM rates should be adequate, and the confidence intervals around our estimates of the odds ratios should also be statistically sound.
Results
The median province-wide surgical PSM rate among men with pT2 disease was 33%. Hospital rates of PSM ranged from 0% to 100% with the volume of RP ranging from 12 to 625 over the period (Fig. 1). The median surgical volume is higher in the teaching hospitals (median 194 RPs) than in the community hospitals. (median 121 RP) for the period. Considering PSM, teaching hospitals had a lower rate (26%) compared to community institutions (34%). However, when formally tested, there was no significant difference between the teaching and community hospitals with regards to the pT2 PSM rates, respectively, or with respect to surgical volume or the sampling rate (Table 1).
Fig. 1.

This demonstrates each hospital’s pT2 positive surgical margin rate and surgical volume. Part A represents all hospitals (each hospital a black circle) whilst Part B has the community hospitals (red triangles) and teaching hospitals (blue circles).
Table 1.
Distribution of variables of collected for 43 Ontario hospitals; p value is for testing differences between teaching and non-teaching hospitals, using the Wilcoxon Rank Sum Test
| Overall | Community hospitals | Teaching hospitals | p value | ||||
|---|---|---|---|---|---|---|---|
| N | Median (IQR) Range | N | Median (IQR) Range | N | Median (IQR) Range | ||
| pT2 Reports PSM rate % | 43 | 33 (21–42) 0–100 |
33 | 34 (21–42) 0–100 |
10 | 26 (18–41) 14 – 53 |
0.52 |
| Surgical volume (Total RPs) | 43 | 121 (73–182) 12 – 625 |
33 | 121 (77–165) 12 – 234 |
10 | 194 (52–320) 49 – 625 |
0.14 |
| Sampling rate (%) | 43 | 42 (23–52) 5 – 88 |
33 | 43 (38–52) |
10 | 22 (16–47) | 0.11 |
IQR: interquartile range; PSM: positive surgical margin.
To further ease visualization of any potential trends between hospital volume and PSM rates, a smoothing spline was fitted through the data (Fig. 1). A clear linear pattern was not obvious but, generally, as the surgical volume for hospitals increased, the PSM margin rate decreased. However, there was much variability in the PSM rates. To evaluate this, further logistic regression was performed.
We also demonstrated the distribution of pT2 PSM rates, respectively, versus surgical volume, stratified by quartiles (Fig. 2). The first quartile had higher PSM rates than the last group, showing that as surgical volume increased, PSM rates decreased. The 2 middle groups, however, did not follow this trend. When examining the pT2 rates using categories for the surgical volume, we saw from the OR that the odds of having a PSM generally increased as the total volume of surgeries decreased (Table 2). However, these results were not significant (p > 0.05).
Fig. 2.
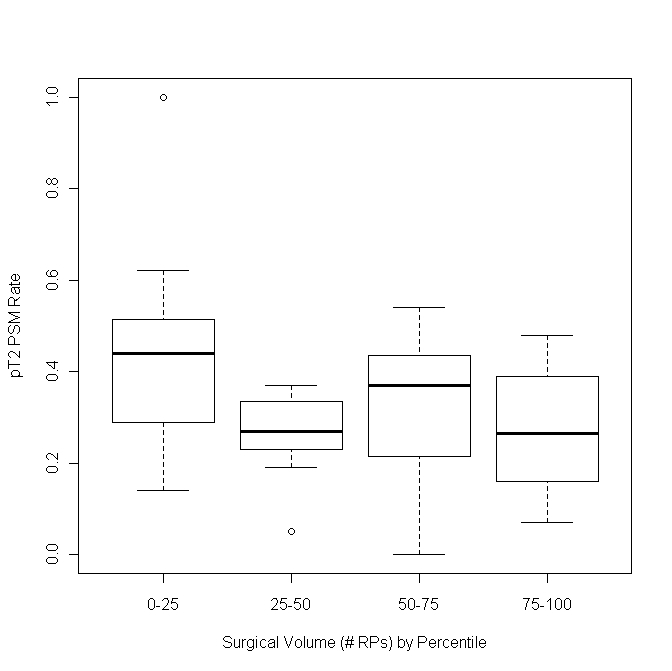
This demonstrates in box plots the distribution of pT2 positive surgical margin (PSM) rates, respectively, versus surgical volume (stratified by quartiles). On the horizontal axis 0=quartile 1: 0–73 RPs (minimum to Q1 number of RPs done); quartile 2: 74–121 RPs (Q1 to median number of RPs done); quartile 3: 122–182 RPs (median to Q3 number of RPs done); quartile 4: 183+ RPs. The first quartile has higher PSM rates than the last group, showing that as surgical volume increases, PSM rates decrease but the middle quartiles do not follow this same trend. RP: radical prostatectomy.
Table 2.
Univariate logistic regression results for the pT2 PSM rate and comparing community to teaching hospitals; in the interquartile comparisons the last quartile being the hospitals with the highest volumes were the referent group
| Overall | Non-teaching hospitals only | Teaching hospitals only | ||||
|---|---|---|---|---|---|---|
| Odds ratio (95% CI) | p Value | Odds ratio (95% CI) | p Value | Odds ratio (95% CI) | p Value | |
| Surgical volume | ||||||
| For every 50-patient decrease | 1.06 (0.99 – 1.15) | 0.10 | 1.14 (0.94 – 1.38) | 0.17 | 1.04 (0.93 – 1.15) | 0.52 |
| 0 – Q1 | 1.66 (0.93 – 2.96) | 0.15 | Not conducted due to small sample sizes per category | |||
| Q1 – Median | 0.97 (0.58 – 1.62) | |||||
| Median – Q3 | 1.44 (0.91 – 2.29) | |||||
| Q3+ | Reference | |||||
| Min – Q1 | 1.66 (0.92 – 2.99) | 0.24 | ||||
| Q1 – Q3 | 1.22 (0.80 – 1.85) | |||||
| Q3 + | Reference | |||||
| Teaching hospital | ||||||
| No vs. Yes | 1.32 (0.84 – 2.09) | 0.23 | NA | NA | NA | NA |
CI: confidence interval; PSM: postive surgical margin.
When examining whether differences in the PSM rate existed between community and non-teaching hospitals via logistic regression, we saw that the odds of a PSM increased by 32% for pT2 and overall surgeries. However, when formally tested, these odds ratios were not significantly different from 1; hence, there is not enough evidence to conclude that there is a statistically significant difference in the PSM rates for teaching and non-teaching hospitals. In particular, results from community hospitals were not significantly different (p > 0.05) compared to teaching hospitals or by hospital volume alone (i.e., large volume vs. small volume) when comparing volumes in increments of 30, 50 and 60 RP (data not shown). Also, all results were unchanged even when outliers were included in each analysis (data not shown).
Finally, it should be noted that when we examined the log OR, it did not appear that the relationship between PSM rate and surgical volume was in fact linear, and there were only a few points with which to examine the relationship between surgical volume and PSM rate for higher values of surgical volume. Hence, the models where surgical volume was treated as a continuous variable should be interpreted with caution.
Discussion
The implications of our data are significant. The major finding is that the overall PSM rate among men with pT2 disease (of 33%) is significantly higher than those from “centres of excellence” (6.8%–13.7%).2,3,7 It is our view that our study reflects “real-world” experience. In this context the United Kingdom has adopted the Calmin-Hine principle requiring that patients should have access to a uniformly high quality of care to ensure the maximum possible cure rates and best quality of life. This has led to more specialized cancer centres and situations where volume needs to be maintained (they recommend a centre should perform a combined total of 50 radical cystectomies and RP/year).25 Our data demonstrate that although intuitive, such cancer centres may be founded on principles that do not hold at a population-based level.
Surgical technique is increasingly being considered a risk factor for PSM in RP.7,8 Eastham and colleagues first reported that the technique used by individual surgeons is an independent risk factor for PSM even after adjusting for case mix, surgery date and volume.7 This is relevant for inadvertent prostatic capsular incision which confers a higher rate of biochemical recurrence, often triggering secondary therapies (radiotherapy/hormonal manipulation).29 Surrogates for surgical technique (e.g., rate of secondary therapy), but not PSM, have been considered in surgeon volume population-based studies19 where surgeon volume was again important.
The second major finding of our study is a lack of association between PSM and hospital volume and or centre type. Clearly, there are low volume hospitals with low PSM rates and large volume hospitals with higher PSM rates. Although this contrasts with other surgical procedures, this type of association has been observed before for morbidity statistics where medium volume surgeons have achieved morbidity outcomes similar to high-volume surgeons.24 Data on individual surgeons would help clarify this association as one prior surgeon-volume study demonstrated that surgical volume is not a predictor of PSM when analyses are restricted to intermediate and low volume surgeons but was among very high volume surgeons.18 University teaching hospitals have been demonstrated to have lower RP morbidity30 than community hospitals, but in this study had no significant influence on PSM rates.
Limitations of our study are that the data represented only a sampling, yet this was period-based and small differences should be compensated by the moderately large numbers. Also, individual surgeon data and biochemical recurrence data were not available, nor were preoperative patient data to account for patient selection, such as PSA, biopsy pathology or patient age and size. However, this being a population-based study, it did reflect “real-world” practice and, as such, decisions were made based on the data in this study, particularly from a cancer care perspective. Despite these limitations we are still able to make respectable observations and comments about (1) the “true” margin status for RP were about 30% in organ-confined disease over a large population rather than the lower rates recorded at an individual centre and (2) that statistically significant differences in PSM may not be present according to hospital volume outside centres of excellence.
These data have, however, shown that a gap in care does exist; this gap has led to the initiation of several quality improvement initiatives. In 2008, Cancer Care Ontario completed the Guideline for the optimization of surgical and pathological quality performance for radical prostatectomy in prostate cancer management. There was consensus that a PSM rate of 25% or less should be achievable. Because a volume-outcome relationship was not been observed in Ontario, Cancer Care Ontario has undertaken many strategies to bring Ontario surgeons and pathologists together to discuss continuous quality improvement initiatives. This has included provincial workshops, local education meetings and a list serv discussion group. Future initiatives will hopefully decrease this rate even further.
Conclusion
In our study, a population-based PSM rate for pT2 disease prostate cancer undergoing RP was higher than published results from “centres of excellence.” There were no statistically significant differences based on volume, which is not consistent with previously published data. Factors, such as individual surgeon, patient selection, pathological processing and interpretation,12 may explain differences. Further studies to determine key points of technique are required to determine factors associated with PSM and strategies to reduce them.
Footnotes
Competing interests: None declared.
This paper has been peer-reviewed.
References
- 1.Bill-Axelson A, Holmberg L, Ruutu M, et al. Radical prostatectomy versus watchful waiting in early prostate cancer. N Engl J Med. 2005;352:1977–84. doi: 10.1056/NEJMoa043739. [DOI] [PubMed] [Google Scholar]
- 2.Swindle P, Eastham JA, Ohori M, et al. Do margins matter? The prognostic significance of positive surgical margins in radical prostatectomy specimens. J Urol. 2008;179:S47–51. doi: 10.1016/j.juro.2008.03.137. [DOI] [PubMed] [Google Scholar]
- 3.Hong SK, Han BK, Chung JS, et al. Evaluation of pT2 subdivisions in the TNM staging system for prostate cancer. BJU Int. 2008;102:1092–6. doi: 10.1111/j.1464-410X.2008.07897.x. Epub 2008 Jul 29. [DOI] [PubMed] [Google Scholar]
- 4.Hull GW, Rabbani F, Abbas F, et al. Cancer control with radical prostatectomy alone in 1,000 consecutive patients. J Urol. 2002;167:528–34. doi: 10.1016/S0022-5347(01)69079-7. [DOI] [PubMed] [Google Scholar]
- 5.Boorjian SA, Blute ML. Surgical management of high risk prostate cancer: The Mayo Clinic experience. Urol Oncol. 2008;26:530–2. doi: 10.1016/j.urolonc.2008.03.009. [DOI] [PubMed] [Google Scholar]
- 6.Eastham JA, Kuroiwa K, Ohori M, et al. Prognostic significance of location of positive margins in radical prostatectomy specimens. Urology. 2007;70:965–9. doi: 10.1016/j.urology.2007.08.040. [DOI] [PubMed] [Google Scholar]
- 7.Eastham JA, Kattan MW, Riedel E, et al. Variations among individual surgeons in the rate of positive surgical margins in radical prostatectomy specimens. J Urol. 2003;170:2292–5. doi: 10.1097/01.ju.0000091100.83725.51. [DOI] [PubMed] [Google Scholar]
- 8.Vickers AJ, Bianco FJ, Serio AM, et al. The surgical learning curve for prostate cancer control after radical prostatectomy. J Natl Cancer Inst. 2007;99:1171–7. doi: 10.1093/jnci/djm060. [DOI] [PubMed] [Google Scholar]
- 9.Ahyai SA, Zacharias M, Isbarn H, et al. Prognostic significance of a positive surgical margin in pathologically organ-confined prostate cancer. BJU Int. 2010;106:478–83. doi: 10.1111/j.1464-410X.2009.09162.x. Epub 2010 Jan 29. [DOI] [PubMed] [Google Scholar]
- 10.Tewari AK, Srivastava A, Mudaliar K, et al. Anatomical retro-apical technique of synchronous (posterior and anterior) urethral transection: a novel approach for ameliorating apical margin positivity during robotic radical prostatectomy. BJU Int. 2010;106:1364–73. doi: 10.1111/j.1464-410X.2010.09318.x.. [DOI] [PubMed] [Google Scholar]
- 11.Doumerc N, Yuen C, Savdie R, et al. Should experienced open prostatic surgeons convert to robotic surgery? The real learning curve for one surgeon over 3 years. BJU Int. 2010;106:378–84. doi: 10.1111/j.1464-410X.2009.09158.x. Epub 2010 Jan 8. [DOI] [PubMed] [Google Scholar]
- 12.Evans AJ, Henry PC, Van der Kwast TH, et al. Interobserver variability between expert urologic pathologists for extraprostatic extension and surgical margin status in radical prostatectomy specimens. Am J Surg Pathol. 2008;32:1503–12. doi: 10.1097/PAS.0b013e31817fb3a0. [DOI] [PubMed] [Google Scholar]
- 13.Shikanov S, Song J, Royce C, et al. Length of positive surgical margin after radical prostatectomy as a predictor of biochemical recurrence. J Urol. 2009;182:139–44. doi: 10.1016/j.juro.2009.02.139. [DOI] [PubMed] [Google Scholar]
- 14.Halm EA, Lee C, Chassin MR. Is volume related to outcome in health care? A systematic review and methodologic critique of the literature. Ann Intern Med. 2002;137:511–20. doi: 10.7326/0003-4819-137-6-200209170-00012. [DOI] [PubMed] [Google Scholar]
- 15.Bianco FJ, Jr, Riedel ER, Begg CB, et al. Variations among high volume surgeons in the rate of complications after radical prostatectomy: further evidence that technique matters. J Urol. 2005;173:2099–103. doi: 10.1097/01.ju.0000158163.21079.66. [DOI] [PMC free article] [PubMed] [Google Scholar]
- 16.Nuttall M, van der Meulen J, Phillips N, et al. A systematic review and critique of the literature relating hospital or surgeon volume to health outcomes for 3 urological cancer procedures. J Urol. 2004;172:2145–52. doi: 10.1097/01.ju.0000140257.05714.45. [DOI] [PubMed] [Google Scholar]
- 17.Briganti A, Capitanio U, Chun FK, et al. Impact of surgical volume on the rate of lymph node metastases in patients undergoing radical prostatectomy and extended pelvic lymph node dissection for clinically localized prostate cancer. Eur Urol. 2008;54:794–804. doi: 10.1016/j.eururo.2008.05.018. [DOI] [PubMed] [Google Scholar]
- 18.Chun FK, Briganti A, Antebi E, et al. Surgical volume is related to the rate of positive surgical margins at radical prostatectomy in European patients. BJU Int. 2006;98:1204–9. doi: 10.1111/j.1464-410X.2006.06442.x. [DOI] [PubMed] [Google Scholar]
- 19.Jeldres C, Suardi N, Capitanio U, et al. High surgical volume is associated with a lower rate of secondary therapy after radical prostatectomy for localized prostate cancer. BJU Int. 2008;102:463–7. doi: 10.1111/j.1464-410X.2008.07705.x. [DOI] [PubMed] [Google Scholar]
- 20.Klein EA, Bianco FJ, Serio AM, et al. Surgeon experience is strongly associated with biochemical recurrence after radical prostatectomy for all preoperative risk categories. J Urol. 2008;179:2212–6. doi: 10.1016/j.juro.2008.01.107. discussion 2216–7. [DOI] [PMC free article] [PubMed] [Google Scholar]
- 21.Vickers AJ, Bianco FJ, Gonen M, et al. Effects of pathologic stage on the learning curve for radical prostatectomy: evidence that recurrence in organ-confined cancer is largely related to inadequate surgical technique. Eur Urol. 2008;53:960–6. doi: 10.1016/j.eururo.2008.01. [DOI] [PMC free article] [PubMed] [Google Scholar]
- 22.McNeill AS, Nabi G, McLornan L, et al. Endoscopic extraperitoneal radical prostatectomy: critical analysis of outcomes and learning curve. BJU Int. 2010;106:1537–43. doi: 10.1111/j.1464-410X.2010.09322.x.. [DOI] [PubMed] [Google Scholar]
- 23.Schrag D, Panageas KS, Riedel E, et al. Hospital and surgeon procedure volume as predictors of outcome following rectal cancer resection. Ann Surg. 2002;236:583–92. doi: 10.1097/00000658-200211000-00008. [DOI] [PMC free article] [PubMed] [Google Scholar]
- 24.Harmon JW, Tang DG, Gordon TA, et al. Hospital volume can serve as a surrogate for surgeon volume for achieving excellent outcomes in colorectal resection. Ann Surg. 1999;230:404–11. doi: 10.1097/00000658-199909000-00013. discussion 411–3. [DOI] [PMC free article] [PubMed] [Google Scholar]
- 25.McCabe JE, Jibawi A, Javle PM. Radical cystectomy: defining the threshold for a surgeon to achieve optimum outcomes. Postgrad Med J. 2007;83:556–60. doi: 10.1136/pgmj.2007.058214. [DOI] [PMC free article] [PubMed] [Google Scholar]
- 26.Stephenson AJ, Wood DP, Kattan MW, et al. Location, extent and number of positive surgical margins do not improve accuracy of predicting prostate cancer recurrence after radical prostatectomy. J Urol. 2009;182:1357–63. doi: 10.1016/j.juro.2009.06.046. [DOI] [PubMed] [Google Scholar]
- 27.Hall S, Schulze K, Groome P, et al. Using cancer registry data for survival studies: the example of the Ontario Cancer Registry. J Clin Epidemiol. 2006;59:67–76. doi: 10.1016/j.jclinepi.2005.05.001. [DOI] [PubMed] [Google Scholar]
- 28.Stamey TA, Yang N, Hay AR, et al. Prostate-specific antigen as a serum marker for adenocarcinoma of the prostate. N Engl J Med. 1987;317:909–16. doi: 10.1056/NEJM198710083171501. [DOI] [PubMed] [Google Scholar]
- 29.Chuang AY, Epstein JI. Positive surgical margins in areas of capsular incision in otherwise organ-confined disease at radical prostatectomy: histologic features and pitfalls. Am J Surg Pathol. 2008;32:1201–6. doi: 10.1097/PAS.0b013e318162a8bf. [DOI] [PubMed] [Google Scholar]
- 30.Yuan Z, Cooper GS, Einstadter D, et al. The association between hospital type and mortality and length of stay: a study of 16.9 million hospitalized Medicare beneficiaries. Med Care. 2000;38:231–45. doi: 10.1097/00005650-200002000-00012. [DOI] [PubMed] [Google Scholar]