

Abstract
Prefrontal cortex (PFC) dysfunction is common in patients with Huntington’s disease (HD), a dominantly inherited neurological disorder, and has been linked to cognitive disruption. We previously reported alterations in neuronal firing patterns recorded from PFC of the R6/2 mouse model of HD. To determine if PFC dysfunction results in behavioral impairments, we evaluated performance of wild-type (WT) and R6/2 mice in a fear conditioning and extinction behavioral task. Fear conditioning and extinction retrieval were similar in both genotypes, but R6/2s exhibited less fear during extinction by freezing less than WTs. A fear reinstatement test after extinction retrieval indicated that faster extinction was not due to poor memory for conditioning. During initial extinction and extinction retrieval training, neuronal activity was recorded from prelimbic (PL) cortex, a subregion of PFC known to be important for fear expression. In WTs, a large number of neurons were activated by the conditioned stimulus during initial extinction and this activation was significantly impaired in R6/2s. Notably, there was no genotype difference in PFC activity during extinction retrieval. Thus, altered extinction is likely a result of reduced fear expression due to impairments in PL activation. Collectively, our results suggest that PFC dysfunction may play a key role in R6/2 cognitive impairments.
Keywords: fear extinction, Huntington’s disease, prefrontal cortex, electrophysiology, R6/2
Introduction
Cognitive changes, including impairments in attention, working memory, and executive function (Lawrence et al., 1996; Lawrence et al., 1998; Rosenblatt, 2007; Verny et al., 2007; Zakzanis, 1998), are paramount in HD. Functional imaging studies, moreover, have linked cognitive deficits to abnormal prefrontal function (Montoya et al., 2006; Paulsen et al., 2004; Thiruvady et al., 2007; Wolf et al., 2008; Wolf et al., 2009; Wolf et al., 2007). Working memory performance, for example, is impaired with increasing task loads in HD. This impairment is accompanied by decreased task-related activation in dorsolateral prefrontal cortex (PFC). Interestingly, this is true for both asymptomatic HD gene carriers and symptomatic patients (Wolf et al., 2009; Wolf et al., 2007).
The R6/2 mouse, a widely studied HD transgenic mouse model, expresses exon 1 of the human HD gene and recapitulates many pathological characteristics observed in HD patients (reviewed in Crook and Housman, 2011; Heng et al., 2008). Neuropathology in cortex, such as intranuclear inclusions (Davies et al., 1997; Meade et al., 2002) and altered dendritic morphology (Klapstein et al., 2001), has been reported in R6/2 mice. Furthermore, in vitro electrophysiological assessments have described alterations to intrinsic properties and synaptic events measured in cortical pyramidal cells of R6/2 mice (see Cepeda et al., 2010 for review). Cognitive disruptions have also been observed in R6/2 mice, such as impairments in discrimination learning in tasks such as the Morris water maze and T-maze (Lione et al., 1999). We recently reported that neurons in PFC of R6/2 mice exhibit altered firing patterns during behavior. Relative to wild-type (WT) controls, PFC neurons in R6/2s had a high firing rate, displayed less burst activity, and less synchronous firing between pairs of simultaneously recorded units (Walker et al., 2008). Our goal here is to extend these findings by evaluating performance and neuronal activity in R6/2 mice during a PFC-relevant behavioral task. A potential complication, however, is that rodent analogs of tasks that assess attention, working memory, or executive function require several weeks of training and good motor control (Buccafusco, 2009), whereas R6/2 mice develop a behavioral phenotype soon after weaning followed by a relatively rapid deterioration of motor abilities (Carter et al., 1999). To avoid this complication, we evaluated performance of R6/2 mice in an extinction of conditioned fear paradigm. While the amygdala is known to be critical for acquisition of conditioned fear (LeDoux, 2000), a large body of research has been dedicated to the contribution of PFC to extinction. The infralimbic (IL) subregion of PFC has been shown to be important in the retrieval, or memory, of extinction (Quirk et al., 2006). In contrast, prelimbic (PL) neurons appear to be necessary for the expression of conditioned fear. Stimulation of PL neurons during extinction increases freezing while IL stimulation reduces freezing (Vidal-Gonzalez et al., 2006). Furthermore, temporary inactivation of PL one day after acquisition of conditioned fear produces less freezing to cue and context (Corcoran and Quirk, 2007; Sierra-Mercado et al., 2006; Sierra-Mercado et al., 2010) and single-unit recordings in rats have demonstrated that PL activation is related to expression of conditioned fear responses, especially during the early extinction phase of training (Burgos-Robles et al., 2009). Unlike many other PFC-relevant tasks, fear conditioning and extinction training occurs rapidly. Furthermore, the behavioral paradigm lends itself nicely to the use of electrophysiology to evaluate task-related neuronal activity. We hypothesize altered fear extinction in R6/2 mice accompanied by altered PFC processing of conditioned stimuli.
Methods
Animals
Male R6/2 mice (B6CBA-TgN[HDexon1]62Gpb), which are transgenic for exon 1 of the human HD gene (Mangiarini et al., 1996), were shipped from Jackson Laboratories (Bar Harbor, ME) at ~5–6 weeks of age along with corresponding WT controls. Data were obtained from a total of 29 mice: WT (n =14) and R6/2 (n=15). All mice were kept on a 12-hour light cycle (lights on at 0700) and individually housed with ad libitum access to food and water. Although group housing is known to provide environmental enrichment and social benefits to mice (Balcombe, 2006), we opted for individual housing to facilitate comparisons of our results with studies from our lab as environmental enrichment is known alter the phenoptype of R6/2 mice (Wood et al., 2010). In fact, individual housing is appropriate for mice with a surgically implanted headstage (see below). All experiments were performed on mice 7–8 weeks of age, which encompasses a behaviorally symptomatic time, but excludes the period of severe weight loss and diabetes onset that typically develops after 10 weeks of age (Carter et al., 1999; Hurlbert et al., 1999; Lione et al., 1999; Mangiarini et al., 1996).
Genotype confirmation and CAG repeat length sequencing
Genomic DNA was extracted from tail tissue samples in 25 μL cell lysis buffer (50 mM Tris, pH 8.0; 25 mM EDTA; 100 mM NaCl; 0.5% IGEPAL CA-630; 0.5% Tween 20) and proteinase K (10 mg/mL; 60 μg/reaction) at 55°C for 2 hours with gentle mixing after the first hour. DNA was diluted with 400 μL filter-sterilized HPLC water, heated to 100°C for 10 min, centrifuged for 2 min at 17,000× g, and stored at 4°C. PCR and analytical agarose gel electrophoresis were used to determine CAG repeat length. Primers were 31329 (5′-ATGAAGGCCTTCGAGTCCCTCAAGTCCTTC-3′) and 33934 (5′-17GGCGGCTGAGGAAGCTGAGGA-3′) (Mangiarini et al., 1996). Each reaction consisted of 2.0 μL DNA template (40 to 100 ng/μL), 0.4 μl each primer (20 μM), 7.2 μL filter-sterilized HPLC water, and 10.0 μL 2x Biomix™ Red (Bioline USA Inc., Taunton, MA) for 20 μL total volume. Cycling conditions were 94°C for 90 s followed by 30 cycles of 94°C for 30 s, 62°C for 45 s, 72°C for 90 s with a final elongation at 72°C for 10 min. Electrophoresis of samples was performed in 3.0% NuSieve® 3:1 analytical agarose (Lonza Rockland, Inc., Rockland, ME) with 0.2 μg/mL ethidium bromide at 5V/cm for 180 min using a 100 bp ladder as DNA standard.
Gels were evaluated with Kodak Image Station 4000R and Kodak Molecular Imaging software (Carestream Molecular Imaging, New Haven, CT) to confirm genotype and determine CAG repeat length. Clone Manager software (Sci-Ed Software, Cary, NC) primers was used to align the huntingtin gene sequence acquired from the National Center for Biotechnology Information (www.ncbi.nlm.nih.gov). Alignment of primers to template indicated that the DNA fragment amplified by PCR is 86 bp longer than the CAG repeat region. The average CAG repeat length for mice used in this experiment was 127.4 + 3.87.
Surgical Procedures
A subset of WT (n=8) and R6/2 (n=9) mice were prepared for subsequent single-unit recording at ~6–7 weeks of age under aseptic conditions. A micro-wire bundle constructed of eight, 25μm formvar insulated recording leads and two, uninsulated 50μm ground wires friction fitted to plastic strip connectors with gold pins was lowered unilaterally into the PFC as previously described (Walker et al., 2008). Coordinates for electrode implantation were 1.90mm anterior and 0.5mm lateral relative to bregma and 1.50mm ventral to the cortical surface. All mice were allowed to recover for at least 5 days during which time they were monitored for signs of pain and administered analgesics as needed.
Behavioral Procedures
Because R6/2 mice are known to show deficits in contextual fear conditioning (Bolivar et al., 2003), two distinct contexts were used for acquisition and extinction of conditioned fear. Acquisition took place in a standard operant chamber (Med Associates, St Albans, VT) with two Plexiglas walls and two stainless steel walls and a rigid floor constructed of round stainless steel bars. The operant chamber was wiped down with 70% ethanol immediately before the animal was conditioned. Extinction training occurred in an open-field environment in a Plexiglas tub [24 wide (W) X 45.5 long (L) X 20 high (H) cm] lined with wood-chip bedding. The tub and bedding were only used for one extinction session and was replaced before another mouse was to be trained. Both training arenas were housed in separate sound-attenuating chambers outfitted with red 25-watt house lights and one-way mirrors in the door to observe the animals during training.
Behavioral training for this experiment occurred over the course of four days at approximately 7–8 weeks of age and was similar to methods previously used for mice (Wellman et al., 2007). On Day 1, mice were habituated to both training contexts for ~30 min each. Acquisition of conditioned fear took place on Day 2 with three conditioned stimulus (CS) and unconditioned stimulus (US) pairings. The CS was a 30s, 3.5Khz tone (~85dB) and the US was a 2s, 0.5mA footshock that co-terminated with the CS. The mouse was returned to the colony and on Day 3 trained in extinction with 40 CS-alone trials with a 5s inter-trial interval (ITI). On Day 4, the mouse was placed in the extinction context and received 20 CS-alone trials (5s ITI) to evaluate retrieval of extinction. Freezing during the tone was measured as the conditioned response (CR) in real time by an experimenter for acquisition and extinction sessions.
A separate group of surgically naïve WT (n=6) and R6/2 (n=6) mice were evaluated in a fear reinstatement paradigm to determine if differences in extinction performance were due to differences in the memory for conditioning. Habituation, conditioning, extinction, and extinction retrieval sessions occurred as described above. After testing for extinction retrieval, mice were returned to the animal colony for one hour and then placed in the operant chamber conditioning context. After a two-minute habituation period, one unsignalled, US footshock was delivered. Following a two-minute stimulus-free period, 10-CS alone trials (5s ITI) occurred during which freezing was measured.
Freezing was analyzed for all phases of training by using a two-way repeated measures ANOVA (genotype × trial). In the presence of a significant interaction, Tukey post hoc analysis was used to compare freezing between genotypes within individual trials.
Electrophysiology
Neuronal activity was recorded from PL during both extinction sessions. The electrode assembly was connected to a light-weight, flexible wire harness, which was equipped with six, field-effect transistors that provided unity-gain amplification to individual micro-wires, as reported previously (Miller et al., 2008; Walker et al., 2008). The harness was connected to a swiveling commutator that allowed the mouse freedom of movement throughout the recording session. Each recording session occurred in an open-field environment inside a sound-attenuating chamber (61 L X 51 W X 71 H cm). A Plexiglas tub (24 W X 45.5 L X 20 H cm) containing woodchip bedding served as the open field.
Neuronal discharges were acquired by the Multichannel Acquisition Processor (MAP) system through a preamplifier (Plexon, Dallas, TX, USA). The MAP system allows for direct computer control of signal amplification, frequency filtering, discrimination, and storage. To detect spiking activity, signals were band-pass filtered (154 Hz – 8.8 kHz) and digitized at a rate of 40 kHz. Initial spike sorting was performed online prior to the beginning of the recording session (Sort Client software from Plexon, Dallas, TX, USA). After establishing a voltage threshold >2.5 times background noise, a large number of waveform samples (~100 to 1,000) were collected and principal component analysis was used to discriminate neurons. An oscilloscope and audio monitor were used to confirm that recorded signals were free of noise and that individual units were well isolated. Autocorrelograms and inter-spike interval (ISI) histograms were inspected to confirm the isolation of each unit. If template drift occurred, principal components were recalculated offline using Spike2 (CED, Cambridge, England) or Offline Sorter (Plexon, Dallas, TX) and units were re-isolated.
Electrophysiology data were analyzed using Neuroexplorer software (NEX Technologies) and custom Matlab (Mathworks) scripts. To characterize PL activity during initial extinction and extinction retrieval sessions, peri-stimulus time histograms (PSTHs) were constructed by summing spikes into 50ms bins for 1s preceding and 2s following CS onset for trials 2–12 of initial extinction and all extinction retrieval trials. Group PTSHs for WT and R6/2 mice were constructed by first determining a baseline mean firing rate during the 1s prestimulus period for each neuron and expressing each bin for the PTSH as a percentage change from the baseline rate. Finally, each bin was averaged across all neurons within a genotype. Group PSTHs were compared using a two-way repeated measures (genotype X bin) ANOVA.
CS-response profiles of individual neurons were determined by first calculating 99% confidence limits for PSTHs based on the 1s pre-CS period (Abeles, 1982). Neurons were then classified as excited if two or more bins after tone onset crossed the upper limit and inhibited if two or more bins cross the lower limit. PSTHs that did not meet the criteria for excitation or inhibition were classified as having a no change response. Proportions of excitatory, inhibitory and no change responses for WT and R6/2 mice were compared using a chi-square test.
The relationship between PL neuronal firing and freezing behavior during trials 2–12 of initial extinction was investigated by discriminant analysis, which is a multivariate statistical technique that builds a model to predict group membership based on the linear combination of two or more predictor (independent) variables measured on an interval scale (Pohar et al., 2004; Statsoft inc, 2010). If the model results in a low rate of misclassification of samples, then the relationship between the two predictor variables may be significant in explaining group membership. An average neuronal response was determined for each animal by transforming all individual PSTHs to percentage change from baseline as described earlier and the grand mean of the 100ms following the tone was calculated across all histograms for that animal. The mean behavioral response for an animal was calculated by taking the average percent time freezing during the tone on trials 2–12 of initial extinction. Genotype was the grouping (dependent) variable and predictor (independent) variables were mean percent change in firing rate and mean percent freezing. Discriminant analysis was applied using a quadratic model for boundary calculation.
To test the hypothesis that genotype classification with discriminant analysis occurred by chance (Statsoft inc, 2010; Wastell, 1987), a series of shuffling experiments were performed. First, the values of one of the individual parameters, such as genotype, were randomly shuffled while the order of the other two parameters (percent freezing and percent change in PL activity) was preserved. Next, discriminant analysis was recalculated for the new data set and the error rate (percent of misclassified cases) was recorded. This procedure was repeated 20 times and then a one sample t-test was used to compare the mean error rate from the shuffled data set to the error rate obtained in the original, un-shuffled data. If the error rates after shuffling were significantly greater than those in the original data, then the null hypothesis was rejected.
A total of five shuffling experiments were performed: three for individual parameters (genotype, percent freezing, and percent change in PL activity) shuffled alone, one for percent freezing and percent change in PL activity shuffled simultaneously with genotype preserved, and one for all three parameters shuffled simultaneously.
Histology
After all training was complete, brains were harvested from mice with implanted micro-wire bundles to evaluate placement of electrodes. Mice were deeply anesthetized with chloropent and current (30nA) was briefly passed (~3s) through the wires to create a lesion at the recording site. Mice were then transcardially perfused with saline followed by 10% neutral buffered formalin. Brains were extracted and submerged in a solution of 10% potassium ferrocyanide in 10% formalin for 24hrs to create a small blue dot at the site of the lesion (“Prussian blue reaction”). The tissue was then cryoprotected in a 30% sucrose/10% formalin solution until saturated, frozen and sectioned on a sliding microtome (50μm) and mounted on 2% pig gelatin subbed glass slides. Tissue was then Nissl stained with Cresyl violet and electrode placements were evaluated in conjunction with a stereotaxic atlas (Paxinos and Franklin, 2001).
Results
Reduced fear responding in R6/2 mice during extinction
WT and R6/2 mice were trained in a fear conditioning and extinction task. Fear conditioning occurred in an operant chamber with three pairings of a tone CS and a US footshock. As shown in Figure 1 (left panel), all mice acquired conditioned fear as freezing increased with subsequent CS-US pairs [main effect of trial F(2,28) = 48.353; p<0.001]. Furthermore, freezing was similar between WT and R6/2 [main effect of genotype F(1,14) = 0.396; p >0.05] and the rate of conditioning was similar [genotype × trial interaction F(2,28) = 1.750; p>0.05] for both groups.
Figure 1.

Percent freezing during fear conditioning, extinction, and extinction retrieval training. WT (squares) and R6/2 (triangles) mice displayed similar levels of freezing during fear conditioning on day one (left). During extinction, WT mice froze significantly longer than R6/2 mice during training blocks 1–3. Extinction retrieval was comparable between genotypes. Asterisks (*) indicate significant difference (p<0.05) between genotypes based on Tukey-posthoc procedures.
One day after fear conditioning, mice were placed in an open-field environment, and 40 CS-alone trials occurred to evaluate retrieval of conditioning and extinction learning. To obtain statistical power, initial data analysis was performed on freezing data collapsed into blocks of 4 consecutive trials (Fig. 1, center panel). While freezing decreased across training for all mice [F(9,126) = 34.882; p<0.001], there was a difference between genotypes [F(1,14) = 11.368, p<0.001] and this effect varied across blocks of trials [genotype × block interaction F(9,126) = 5.398, p<0.001]. Further analysis showed that relative to WT, R6/2 mice spent significantly less time freezing during blocks 1, 2 (p<0.001), and 3 (p<0.05). Retrieval of extinction was evaluated 24h after initial extinction with 20 more CS alone trials. Freezing decreased significantly across trials [Fig. 1, right; F(19,266) = 11.682, p<0.001], but there was no difference in performance between genotypes [main effect of F(1,14) = 0.125, p>0.05; genotype × trial interaction F(19, 266) = 0.878, p>0.05].
Because there appears to be a relatively specific behavioral effect during the early trials of the first extinction session, the first 16 trials (blocks 1–4) were more closely examined in a separate analysis (Fig. 2). Consistent with analysis on blocked data, freezing significantly decreased during these trials [F(15, 210) = 29.658, p<0.001], but was significantly different between genotypes [F(1,14) = 17.480, p<0.001] and the difference varied across trials [genotype × trial interaction F(15, 210) = 3.696, p<0.001]. Interestingly, post-hoc comparisons of freezing between genotypes on individual trials showed no difference between WT and R6/2 mice during the very first presentation of the tone (p>0.05), suggesting retrieval of conditioned fear is similar for both genotypes. On trials 2–11, however, R6/2 mice spent significantly less time freezing during the tone than WT mice (p<0.05). For the remainder of the trials analyzed (12–16), both WT and R6/2 mice spent relatively little time freezing and there was no significant difference between genotypes. Although initial cue retrieval was comparable for both genotypes, R6/2 mice freeze less than WT mice during extinction training.
Figure 2.

Percent freezing during trials 1–12 of extinction. Although freezing was comparable on trial 1, R6/2 mice (triangles) froze less than WT (squares) during trials 2–11. Asterisks(*) indicate significant difference (p<0.05) between genotypes based on Tukey-posthoc procedures.
Although similar acquisition and retrieval of conditioned fear indicate otherwise, it is possible that altered extinction by R6/2 mice could be due to a weaker consolidation of the CS-US association. To test this hypothesis, a separate group of mice was trained on a fear reinstatement paradigm. Figure 3A shows that similar to the original cohort, all mice acquired conditioned fear [main effect of trial F(2,20) = 17.422, p<0.01]; there was no difference between WT or R6/2 mice [main effect of genotype F(1,20) = 3.696 p>0.05; trial × genotype interaction F(2,20)=0.003, p>0.05] All mice extinguish fear responses [Fig. 3B; main effect of block F(9,90) = 24.349, p<0.01], but there was a difference between genotypes [main effect of genotype F(1,10)=11.488, p<0.01], which varied as a function of training block [block × genotype interaction F(9,90) = 4.711, p<0.01]. Post-hoc comparisons showed that R6/2 mice spent less time freezing than WT mice during blocks 1–5 (p<0.05). During extinction retrieval testing (Fig. 3C), freezing responses decreased across trials in all mice [main effect of trial F(19,190) = 10.824, p<0.01], but there was no overall difference between genotype [main effect of genotype F(1,10) = 1.280, p>0.05]. Freezing responses, however, varied between genotypes as a function of trials [trial × genotype interaction F(19,190) = 1.876, p<0.05]. In contrast to the original group of mice, post-hoc analysis showed that mean freezing in the WT mice was significantly higher on trials 1 and 2 of the extinction retrieval session (p<0.05). This is likely due to the fact that some WT mice (n=3) exhibited a high degree of fear recovery (>65% mean freezing across trials 1 and 2), which was not evident in the original WT cohort. High-fear recovery has been reported in rats and is likely a naturally occurring behavioral dichotomy for this paradigm (Burgos-Robles et al., 2009; Milad and Quirk, 2002).
Figure 3.
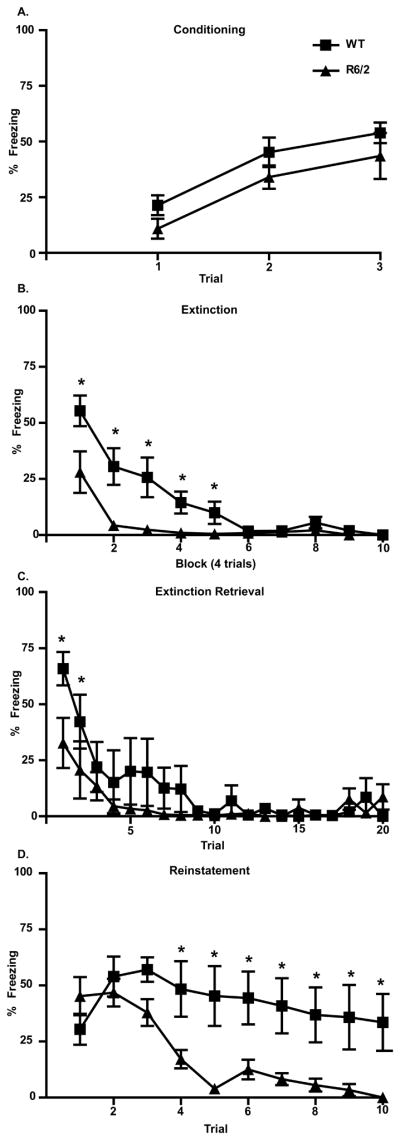
Percent freezing during fear conditioning, extinction, extinction retrieval, and fear reinstatement. (A) WT (squares) and R6/2 (triangles) mice displayed similar levels of freezing during fear conditioning, but R6/2 mice froze less during the first 5 blocks of extinction training (B) and the first 2 trials of extinction retrieval compared WT mice (C). (D) During the fear reinstatement test, there were no differences in freezing on trials 1–3, but WT mice froze significantly more on trials 4–10. Asterisks (*) indicate a significant difference (p<0.05) between genotypes based on Tukey-posthoc procedures.
One hour after extinction retrieval was tested, mice were placed in the operant chamber conditioning context and received 1-unsignalled footshock US, followed by 10 CS-alone presentations during which freezing was measured. As illustrated in Figure 3D, freezing changed across trials [F(9,90) = 8.657, p<0.001], but there was a significant difference between genotypes [F(1,10) = 6.482, p<0.05], which varied as a function of trial [F(9,90) = 4. 487, p<0.001]. Interestingly, when data from WT and R6/2 mice were compared across individual trials, freezing was not different during initial fear reinstatement (trials 1–3; p>0.05). When considered with evidence of similar freezing during conditioned-fear acquisition and the first trial of extinction, our reinstatement data suggest that consolidation of the CS-US association is not weaker in R6/2 mice and cannot explain the difference in extinction between genotypes. Furthermore, freezing was significantly lower in R6/2 mice for trials 4–10 during the reinstatement session (p<0.001). This may be due to the fact that freezing across 10 CS-alone trials was relatively stable in WTs, but decreased rapidly after the third presentation of the CS in R6/2 mice, a finding consistent with faster extinction observed in earlier training sessions. Although interpretation of the difference in freezing between WTs and R6/2s is limited by the fact that some WT mice in this cohort may have unusually high levels of fear which was evident during extinction retrieval testing. Regardless, these data demonstrate that reduced fear responding during extinction in R6/2s cannot be explained by weaker fear consolidation.
Altered signaling in PL cortex of R6/2 mice during extinction of conditioned fear
Next, we sought to determine if differences in behavioral performance could be explained by differential patterns of activation in PFC of WT and R6/2 mice. Micro-wire bundles were chronically implanted into PL cortex (Fig. 4A) to record single-unit activity during extinction sessions. PL is a subregion of medial PFC that plays an important role in expression of conditioned fear during the early phases of extinction training (Burgos-Robles et al., 2009). Figure 4B shows a group PSTH comparing the CS-induced activation patterns for trials 2–12 of initial extinction when R6/2 mice display significantly lower levels of freezing. After CS onset (time 0 on the x-axis), PL neurons recorded from WT mice showed a large increase in activity relative to baseline firing. This pattern of activation was attenuated in R6/2 mice. Statistical analysis indicated that although the amount of activity changed across time for both groups [main effect of bin [F(59,5340) = 2.210, p<0.0001], the average neuronal response was greater in WT mice when compared to R6/2s [main effect of genotype F(1,5340) = 9.236, p<0.01]. This effect did not vary as a function of bin [bin × genotype interaction F(59,5340) = 1.169, p>0.05]. Interestingly, analysis of group PSTHs during extinction retrieval testing (Fig. 4C) showed that activity changed across time [main effect of bin F(59, 5880) =1..572, p<0.05] but there were no differences in the magnitude of activity [main effect of genotype [F(1,5880) = 0.002, p>0.05] for WT and R6/2 mice and the effect did not vary as a function of time [bin × genotype interaction F(59, 588) = 1.185, p>0.05], which was consistent with similar levels of freezing during this phase of the task.
Figure 4.

Electrophysiology during initial extinction and extinction retrieval training. Data from WT mice is coded with gray shading and black represents R6/2 data throughout. (A) Histological analysis confirmed that all electrodes were located in PL cortex. (B & C) Group PSTH data from initial extinction and extinction retrieval, respectively. Data are presented as percent change from the 1 s baseline period in 50 ms bins with CS-onset at time zero. WT mice had significantly greater CS-induced activation during extinction training (B) but not retrieval (C). Inset for B are representative waveforms from putative cortical pyramidal cells; calibration 250 μs, 25 μv.
To examine PL neuronal response patterns during both extinction sessions more closely, we used confidence limits to classify individual PSTHs as excited, inhibited, or not changing (Fig. 5A). Figure 5B shows the proportion of each type of response in WT and R6/2 mice during trials 2–12 of the first extinction session. The most prominent response type for both genotypes was no change in neuronal activity; >50% of PSTHS did not cross the upper or lower confidence limits. Consistent with analysis of group PSTHs, however, a significantly larger proportion of neurons produced excitatory responses in WT mice relative to R6/2 [Χ2(1) = 8.823, p<0.01]. Interestingly, the ratio of excitation to inhibition [Χ2(1) = 0.4193, p>0.05] and inhibition to no change [Χ2(1) = 1.179, p>0.05] was not different in WT and R6/2 mice. Similarly, there were no differences in the proportion of excitatory responses during extinction retrieval [Fig. 5C; Χ2(1)=2.416, p>0.05] and the ratio of excitatory to inhibitory responses was similar [Χ2(1)=1.1884, p>0.05]. There were, however, significantly more neurons inhibited when compared to unresponsive neurons in WT mice [Χ2(1)=6.198, p<0.05]. Overall, analysis of individual CS-response profiles was consistent with group PSTHs and showed greater post-CS activation in PL cortex of WT mice during the early trials of extinction, but not during retrieval of extinction.
Figure 5.

Neuronal response profiles during extinction and extinction retrieval. (A) PSTHs for all neurons recorded were classified by plotting the mean (gray dashed line) and 99% confidence limits (solid gray line) for each histogram. If fewer than two bins crossed the upper or lower confidence limit, the neuron was considered to have a no-change response (left). A neuron was considered inhibited (center) if >2 bins crossed the lower limit and excited (right) if the upper limited was exceeded by 2 or more bins. (B) There were significantly more neurons classified as excited in WT than R6/2 mice during extinction trials 2–12. There was no difference in inhibitory responses. (C) The proportion of excitatory responses was equivalent during extinction retrieval for both genotypes, but WT had more inhibited neurons.
The relationship between neuronal activity and freezing behavior in WT and R6/2 mice
Next, discriminant analysis was used to determine if the altered neuronal activity in PL cortex can explain the tendency for faster extinction in R6/2 mice. As shown in Figure 6A, the predictor variables used were mean percent time spent freezing (x-axis) and mean percent change in neuronal activity (y-axis). Consistent with the observation reported above, data points from R6/2 mice appear to cluster toward the lower end of both scales near the origin of the graph. The thick black line on the plot is the function derived by discriminant analysis that separates the data into two categories. As shown, discriminant analysis performed with zero-percent error and correctly classified all data points by genotype. This suggests that the relationship between neuronal activation in PL and freezing behavior can be used to predict genotype.
Figure 6.

Relationship between freezing behavior and PL neuronal responses during fear extinction. (A) Scatter plot of the mean percent time freezing (x-axis) versus mean percent change in PL activity (y-axis) for WT (gray) and R6/2 (black) mice. Each data point represents an individual animal. The thick black curve is the function derived by discriminant analysis that segregates the data into two classes, which correspond to genotype with zero percent error. (B) Example of discriminant analysis calculated after a three-way shuffle (genotype + percent freezing + percent change in PL activity). Note the high rate of misclassification (31%) present in the shuffled data. (C) Shuffling of each parameter alone or in combination resulted in significantly higher error rates than in the original, un-shuffled data sets. Data in (C) are mean +SEM after 20 shuffles. Asterisks (***) indicate p<0.001 from a one-sample t-test comparing the mean to 0% error.
To validate these results, a series of shuffling experiments were performed. An example of discriminant analysis performed on shuffled data (genotype + percent freezing + percent change) is shown in Fig. 6B. In this case, 31% of cases were misclassified, which is a stark contrast to the zero percent error in the original data set. In fact, Figure 6C shows that all five shuffling methods yielded mean error rates significantly greater than in the original data set [genotype t(10)= 10.45, p<0.0001; percent freezing t(10)= 17.71, p<0.0001; percent change t(10)=10.97, p<0.0001; percent freezing + percent change t(10)=12.95, p<0.0001; genotype + percent freezing + percent change t(10)=9.655, p<0.0001]. Thus, the relationship between the amount of neuronal firing in PL and amount of freezing during extinction is a powerful measurement and can be used to discriminate between genotypes.
Discussion
Our results indicate that R6/2 mice have altered performance on a PFC-relevant behavioral task. Although these mice showed similar amounts of freezing as WT during acquisition of conditioned fear, they froze less than WT during the initial CS-alone trials of extinction. In fact, R6/2s reached baseline levels of freezing by the sixth trial on average, whereas WTs did not do so until trial 12. Similar performance during extinction retrieval testing indicates memory for extinction was equivalent for both genotypes. A reinstatement test demonstrated that reduced fear expression during exctinction is not due to a weaker CS-US association in R6/2 mice. We also found that relative to WT fewer neurons in PL, a PFC region known to be important for expression of fear responses during extinction (Sierra-Mercado et al., 2010; Sotres-Bayon and Quirk, 2010), were excited by the CS in R6/2 mice during extinction, but not retrieval of extinction. Discriminant analysis indicated that levels of freezing during extinction were related to PL activity and genotypes can be extrapolated from this relationship. Thus, impaired fear expression in R6/2s is likely caused by impaired PL activation.
Fear conditioning, anxiety, and HD
It has been reported that R6/2 mice display normal cued fear conditioning (measured one day after acquisition), but contextual conditioning is impaired (Bolivar et al., 2003). The deficit in contextual fear conditioning is likely due to impaired plasticity in the hippocampus of R6/2 mice (Murphy et al., 2000), a brain region important for expression of conditioned fear to context (Rudy et al., 2004). Our results also indicate normal cued fear conditioning as R6/2s were not different from WTs on the first trial of extinction and the first three trials of reinstatement. Bolivar et al., (2003), however, showed R6/2 mice expressed less fear-related behavior during acquisition, which contrasts with our results. This difference is likely because the authors did not measure CS-induced freezing, a commonly used indicator of fear in rodents (Bouton, 1980), but instead monitored activity suppression detected by infrared beam breaks. Furthermore, their behavioral measures occurred after the presentation of the US shock. The defining feature of Pavlovian conditioning, including fear conditioning, is that the CS becomes predictive of the US, and behavioral responses previously associated with the US are now elicited by the CS (LeDoux, 2000; Pavlov and Anrep, 1927). It is likely that Bolivar et al. (2003) were not measuring conditioning-related behavioral activity but perhaps shock-induced anxiety. In fact, there is evidence of reduced anxiety in R6/2 mice as measured in an elevated plus maze (File et al., 1998) and a light-dark box paradigm (Hickey et al., 2005). Other HD models also show reduced anxiety, including R6/1 mice (Naver et al., 2003) and transgenic HD rats (Nguyen et al., 2006; von Horsten et al., 2003). Faster extinction in R6/2s could be interpreted as reduced anxiety as well, although the effect of HD on anxiety varies by model and may be task- and age-dependent. In the light-dark box paradigm, Menalled et al. (2009) showed that R6/2s show increased anxiety in late stages (12+ weeks), while BACHD mice have increased anxiety throughout the entire disease course. Interestingly, YAC128 and HdhQ111 knock-in mice did not show differences in anxiety relative to their respective WTs. CAG140 knock-in mice, furthermore, also display increased anxiety as demonstrated by excessive freezing during fear conditioning (Hickey et al., 2008). It is interesting to speculate that a disruption of anxiety-like behavior could play a role in the extinction alterations observed in our study. One way to examine the relationship between anxiety and fear conditioning would be to compare behavior during the pre-tone or post-shock periods. We cannot make such comparisons, however, as our behavioral data were collected only while the tone-CS was active. Thus, future studies should assess anxiety as a contributing factor to differences in extinction between R6/2 and WT mice.
The role of PL in fear conditioning and extinction
Our electrophysiology results support the role of PL in fear conditioning and extinction. In contrast to the role of IL, evidence suggests PL is important for expression of fear. Stimulation of PL neurons during extinction increases freezing (Vidal-Gonzalez et al., 2006), while temporary inactivation of PL one day after acquisition of conditioned fear produces less freezing to cue and context (Corcoran and Quirk, 2007; Sierra-Mercado et al., 2006; Sierra-Mercado et al., 2010), but does not affect extinction retrieval (Sierra-Mercado et al., 2010). A recent electrophysiology study in rats has further implicated PL in fear expression. For example, during periods of high conditioned fear expression, such as late acquisition and early extinction, PL neurons show a sustained CS-induced excitation, and this response is significantly correlated with freezing behavior during early extinction (Burgos-Robles et al., 2009).
Although our results confirm that excitatory responses in PL are related to high levels of freezing, we did not observe sustained neuronal responses during the CS. One explanation could be species differences in conditioned freezing. In rats, freezing is usually quantified in real time by marking the onset and offset and then summing each interval to obtain total freezing time per trial. This calculation is relatively easy because baseline activity in rats is low and freezing intervals tend to be long. Mice, in contrast, have higher levels of baseline activity and freezing intervals tend to be shorter. In fact, alternative behavioral sampling methods have been used to measure freezing in mice (see Wellman et al., 2007 for example). Therefore, short excitatory responses observed in our study may still be correlated with freezing behavior, but we did not have the ability to apply second-by-second analysis of freezing and neuronal activity. Another explanation could be related to the design of the behavioral paradigm. Burgos-Robles et al (2009) had a long ITI (2–6 min), which permitted PSTHs with a 30s baseline period and large (1s) bin width. Our short (5s) ITI required a much shorter baseline period (1s) and smaller bin width (50ms). Perhaps the combination of a longer baseline period and averaging over a larger bin size produced more apparent sustained responses.
PL is only one part of the PFC-amygdala network thought to mediate expression and inhibition of fear responses (reviewed in Sotres-Bayon and Quirk, 2010). During periods of fear expression, tone-CS information is relayed through the basal amygdala (BA) to the PL and integrated with signals from other brain regions. PL neurons then drive glutamatergic neurons in BA, which in turn excites the central amygdala (CeA) to produce fear related behaviors, such as freezing. When fear responses are inhibited, such as after extinction learning, BA projections to IL are activated to integrate tone-CS information with signals from other brain regions. Excitatory IL projections then activate GABAergic intercalated cells of the amygdala, which inhibit CeA activity, and fear behaviors are suppressed. PL and IL also interact to inhibit each other during fear expression or fear inhibition, respectively. Thus, a lack of CS-induced activation in PL of R6/2 mice during extinction could produce lower levels of fear responding through two interacting mechanisms: less excitatory drive to BA that would produce fear responses and less inhibitory drive to IL that would inhibit fear responses.
It is possible that altered extinction learning in R6/2 mice is due to amygdala dysfunction. The basolateral amygdala complex (BLA) is known to be important for both tone-CS and contextual conditioning (reviewed in LeDoux, 2000) and the BLA has also been implicated in extinction learning (reviewed in Quirk and Mueller, 2008). Interestingly, ex vivo magnetic resonance imaging of brains from R6/2 mice show atrophy of amygdala (Sawiak et al., 2009a; Sawiak et al., 2009b). R6/2 mice also have impaired performance in a conditioned taste aversion task, suggesting BLA dysfunction (Ciamei and Morton, 2009). Although we did not record from the amygdala during this task, comparable performance relative to WTs during acquisition, extinction retrieval, and reinstatement suggest proper amygdala function in our sample. Future studies should investigate the contribution of the amygdala to fear conditioning and extinction alterations in HD mice.
Conclusion
Collectively, our data suggest that PFC dysfunction in R6/2 mice results in reduced expression conditioned fear responses relative to WT over the course of multiple CS-alone trials. Neural recordings from PL suggest that this is due to hypoactivation of the PFC-amygdala circuitry that drives fear responses. Thus, reduced fear expression is part of the R6/2 phenotype.
Acknowledgments
This work was supported by the National Institute of Neurological Disorders and Stroke grant R01 NS35663 to GVR and F31NS066603 to AGW and by the Indiana METACyt Initiative of Indiana University, funded in part through a major grant from the Lilly Endowment, Inc. The authors would like to thank Faye Caylor for administrative and editorial assistance, Paul Langley, Scott Barton, and Austin Dicken for technical support, and Dr. Cara Wellman for helpful comments on the manuscript.
Footnotes
Publisher's Disclaimer: This is a PDF file of an unedited manuscript that has been accepted for publication. As a service to our customers we are providing this early version of the manuscript. The manuscript will undergo copyediting, typesetting, and review of the resulting proof before it is published in its final citable form. Please note that during the production process errors may be discovered which could affect the content, and all legal disclaimers that apply to the journal pertain.
References
- Abeles M. Quantification, smoothing, and confidence limits for single-units’ histograms. J Neurosci Methods. 1982;5:317–25. doi: 10.1016/0165-0270(82)90002-4. [DOI] [PubMed] [Google Scholar]
- Balcombe JP. Laboratory environments and rodents’ behavioural needs: a review. Lab Anim. 2006;40:217–35. doi: 10.1258/002367706777611488. [DOI] [PubMed] [Google Scholar]
- Bolivar VJ, Manley K, Messer A. Exploratory activity and fear conditioning abnormalities develop early in R6/2 Huntington’s disease transgenic mice. Behav Neurosci. 2003;117:1233–42. doi: 10.1037/0735-7044.117.6.1233. [DOI] [PubMed] [Google Scholar]
- Bouton MEM. Conditioned fear assessed by freezing and by the suppression of three different baselines. Animal learning & behavior. 1980;8:429–434. [Google Scholar]
- Burgos-Robles A, Vidal-Gonzalez I, Quirk GJ. Sustained conditioned responses in prelimbic prefrontal neurons are correlated with fear expression and extinction failure. J Neurosci. 2009;29:8474–82. doi: 10.1523/JNEUROSCI.0378-09.2009. [DOI] [PMC free article] [PubMed] [Google Scholar]
- Carter RJ, Lione LA, Humby T, Mangiarini L, Mahal A, Bates GP, et al. Characterization of progressive motor deficits in mice transgenic for the human Huntington’s disease mutation. J Neurosci. 1999;19:3248–57. doi: 10.1523/JNEUROSCI.19-08-03248.1999. [DOI] [PMC free article] [PubMed] [Google Scholar]
- Cepeda C, Cummings DM, Andre VM, Holley SM, Levine MS. Genetic mouse models of Huntington’s disease: focus on electrophysiological mechanisms. ASN Neuro. 2010;2:e00033. doi: 10.1042/AN20090058. [DOI] [PMC free article] [PubMed] [Google Scholar]
- Ciamei A, Morton AJ. Progressive imbalance in the interaction between spatial and procedural memory systems in the R6/2 mouse model of Huntington’s disease. Neurobiol Learn Mem. 2009;92:417–28. doi: 10.1016/j.nlm.2009.06.002. [DOI] [PubMed] [Google Scholar]
- Corcoran KA, Quirk GJ. Activity in prelimbic cortex is necessary for the expression of learned, but not innate, fears. J Neurosci. 2007;27:840–4. doi: 10.1523/JNEUROSCI.5327-06.2007. [DOI] [PMC free article] [PubMed] [Google Scholar]
- Crook ZR, Housman D. Huntington’s Disease: Can Mice Lead the Way to Treatment? Neuron. 2011;69:423–35. doi: 10.1016/j.neuron.2010.12.035. [DOI] [PMC free article] [PubMed] [Google Scholar]
- Davies SW, Turmaine M, Cozens BA, DiFiglia M, Sharp AH, Ross CA, et al. Formation of Neuronal Intranuclear Inclusions Underlies the Neurological Dysfunction in Mice Transgenic for the HD Mutation. Cell. 1997;90:537–548. doi: 10.1016/s0092-8674(00)80513-9. [DOI] [PubMed] [Google Scholar]
- File SE, Mahal A, Mangiarini L, Bates GP. Striking changes in anxiety in Huntington’s disease transgenic mice. Brain Res. 1998;805:234–40. doi: 10.1016/s0006-8993(98)00736-7. [DOI] [PubMed] [Google Scholar]
- Heng MY, Detloff PJ, Albin RL. Rodent genetic models of Huntington disease. Neurobiol Dis. 2008;32:1–9. doi: 10.1016/j.nbd.2008.06.005. [DOI] [PubMed] [Google Scholar]
- Hickey MA, Gallant K, Gross GG, Levine MS, Chesselet MF. Early behavioral deficits in R6/2 mice suitable for use in preclinical drug testing. Neurobiol Dis. 2005;20:1–11. doi: 10.1016/j.nbd.2005.01.024. [DOI] [PubMed] [Google Scholar]
- Hickey MA, Kosmalska A, Enayati J, Cohen R, Zeitlin S, Levine MS, et al. Extensive early motor and non-motor behavioral deficits are followed by striatal neuronal loss in knock-in Huntington’s disease mice. Neuroscience. 2008;157:280–95. doi: 10.1016/j.neuroscience.2008.08.041. [DOI] [PMC free article] [PubMed] [Google Scholar]
- Hurlbert MS, Zhou W, Wasmeier C, Kaddis FG, Hutton JC, Freed CR. Mice transgenic for an expanded CAG repeat in the Huntington’s disease gene develop diabetes. Diabetes. 1999;48:649–51. doi: 10.2337/diabetes.48.3.649. [DOI] [PubMed] [Google Scholar]
- Klapstein GJ, Fisher RS, Zanjani H, Cepeda C, Jokel ES, Chesselet MF, et al. Electrophysiological and morphological changes in striatal spiny neurons in R6/2 Huntington’s disease transgenic mice. J Neurophysiol. 2001;86:2667–77. doi: 10.1152/jn.2001.86.6.2667. [DOI] [PubMed] [Google Scholar]
- Lawrence AD, Sahakian BJ, Hodges JR, Rosser AE, Lange KW, Robbins TW. Executive and mnemonic functions in early Huntington’s disease. Brain. 1996;119:1633–1645. doi: 10.1093/brain/119.5.1633. [DOI] [PubMed] [Google Scholar]
- Lawrence AD, Sahakian BJ, Robbins TW. Cognitive functions and corticostriatal circuits: insights from Huntington’s disease. Trends Cog Sci. 1998;2:379–388. doi: 10.1016/s1364-6613(98)01231-5. [DOI] [PubMed] [Google Scholar]
- LeDoux JE. Emotion circuits in the brain. Annu Rev Neurosci. 2000;23:155–84. doi: 10.1146/annurev.neuro.23.1.155. [DOI] [PubMed] [Google Scholar]
- Lione LA, Carter RJ, Hunt MJ, Bates GP, Morton AJ, Dunnett SB. Selective discrimination learning impairments in mice expressing the human Huntington’s disease mutation. J Neurosci. 1999;19:10428–37. doi: 10.1523/JNEUROSCI.19-23-10428.1999. [DOI] [PMC free article] [PubMed] [Google Scholar]
- Mangiarini L, Sathasivam K, Seller M, Cozens B, Harper A, Hetherington C, et al. Exon 1 of the HD gene with an expanded CAG repeat is sufficient to cause a progressive neurological phenotype in transgenic mice. Cell. 1996;87:493–506. doi: 10.1016/s0092-8674(00)81369-0. [DOI] [PubMed] [Google Scholar]
- Meade CA, Deng YP, Fusco FR, Del Mar N, Hersch S, Goldowitz D, et al. Cellular localization and development of neuronal intranuclear inclusions in striatal and cortical neurons in R6/2 transgenic mice. J Comp Neurol. 2002;449:241–69. doi: 10.1002/cne.10295. [DOI] [PubMed] [Google Scholar]
- Menalled L, El-Khodor BF, Patry M, Suarez-Farinas M, Orenstein SJ, Zahasky B, et al. Systematic behavioral evaluation of Huntington’s disease transgenic and knock-in mouse models. Neurobiol Dis. 2009;35:319–36. doi: 10.1016/j.nbd.2009.05.007. [DOI] [PMC free article] [PubMed] [Google Scholar]
- Milad MR, Quirk GJ. Neurons in medial prefrontal cortex signal memory for fear extinction. Nature. 2002;420:70–4. doi: 10.1038/nature01138. [DOI] [PubMed] [Google Scholar]
- Miller BR, Walker AG, Shah AS, Barton SJ, Rebec GV. Dysregulated Information Processing by Medium Spiny Neurons in Striatum of Freely Behaving Mouse Models of Huntington’s Disease. J Neurophysiol. 2008;100:2205–16. doi: 10.1152/jn.90606.2008. [DOI] [PMC free article] [PubMed] [Google Scholar]
- Montoya A, Price BH, Menear M, Lepage M. Brain imaging and cognitive dysfunctions in Huntington’s disease. J Psychiatry Neurosci. 2006;31:21–9. [PMC free article] [PubMed] [Google Scholar]
- Murphy KP, Carter RJ, Lione LA, Mangiarini L, Mahal A, Bates GP, et al. Abnormal synaptic plasticity and impaired spatial cognition in mice transgenic for exon 1 of the human Huntington’s disease mutation. J Neurosci. 2000;20:5115–23. doi: 10.1523/JNEUROSCI.20-13-05115.2000. [DOI] [PMC free article] [PubMed] [Google Scholar]
- Naver B, Stub C, Moller M, Fenger K, Hansen AK, Hasholt L, et al. Molecular and behavioral analysis of the R6/1 Huntington’s disease transgenic mouse. Neuroscience. 2003;122:1049–57. doi: 10.1016/j.neuroscience.2003.08.053. [DOI] [PubMed] [Google Scholar]
- Nguyen HP, Kobbe P, Rahne H, Worpel T, Jager B, Stephan M, et al. Behavioral abnormalities precede neuropathological markers in rats transgenic for Huntington’s disease. Hum Mol Genet. 2006;15:3177–94. doi: 10.1093/hmg/ddl394. [DOI] [PubMed] [Google Scholar]
- Paulsen JS, Zimbelman JL, Hinton SC, Langbehn DR, Leveroni CL, Benjamin ML, et al. fMRI biomarker of early neuronal dysfunction in presymptomatic Huntington’s Disease. Am J Neuroradiol. 2004;25:1715–21. [PMC free article] [PubMed] [Google Scholar]
- Pavlov IP, Anrep GVe. Conditioned reflexes; an investigation of the physiological activity of the cerebral cortex. Oxford Univ. Press; London: 1927. [DOI] [PMC free article] [PubMed] [Google Scholar]
- Paxinos G, Franklin K. The Mouse Brain in Stereotaxic Coordinates, Deluxe Second Edition (with CD-ROM) Academic Press; 2001. [Google Scholar]
- Pohar M, Blas M, Turk S. Comparison of Logistic Regression and Linear Discriminant Analysis: A simulation study. Metodoloski zvezki. 2004;1:143–161. [Google Scholar]
- Quirk GJ, Garcia R, Gonzalez-Lima F. Prefrontal mechanisms in extinction of conditioned fear. Biol Psychiatry. 2006;60:337–43. doi: 10.1016/j.biopsych.2006.03.010. [DOI] [PubMed] [Google Scholar]
- Quirk GJ, Mueller D. Neural mechanisms of extinction learning and retrieval. Neuropsychopharmacology. 2008;33:56–72. doi: 10.1038/sj.npp.1301555. [DOI] [PMC free article] [PubMed] [Google Scholar]
- Rosenblatt A. Neuropsychiatry of Huntington’s disease. Dialogues Clin Neurosci. 2007;9:191–7. doi: 10.31887/DCNS.2007.9.2/arosenblatt. [DOI] [PMC free article] [PubMed] [Google Scholar]
- Rudy JW, Huff NC, Matus-Amat P. Understanding contextual fear conditioning: insights from a two-process model. Neuroscience & Biobehavioral Reviews. 2004;28:675–685. doi: 10.1016/j.neubiorev.2004.09.004. [DOI] [PubMed] [Google Scholar]
- Sawiak SJ, Wood NI, Williams GB, Morton AJ, Carpenter TA. Use of magnetic resonance imaging for anatomical phenotyping of the R6/2 mouse model of Huntington’s disease. Neurobiol Dis. 2009a;33:12–9. doi: 10.1016/j.nbd.2008.09.017. [DOI] [PubMed] [Google Scholar]
- Sawiak SJ, Wood NI, Williams GB, Morton AJ, Carpenter TA. Voxel-based morphometry in the R6/2 transgenic mouse reveals differences between genotypes not seen with manual 2D morphometry. Neurobiol Dis. 2009b;33:20–7. doi: 10.1016/j.nbd.2008.09.016. [DOI] [PubMed] [Google Scholar]
- Sierra-Mercado D, Corcoran KA, Lebron-Milad K, Quirk GJ. Inactivation of the ventromedial prefrontal cortex reduces expression of conditioned fear and impairs subsequent recall of extinction. European Journal of Neuroscience. 2006;24:1751–1758. doi: 10.1111/j.1460-9568.2006.05014.x. [DOI] [PubMed] [Google Scholar]
- Sierra-Mercado D, Padilla-Coreano N, Quirk GJ. Dissociable roles of prelimbic and infralimbic cortices, ventral hippocampus, and basolateral amygdala in the expression and extinction of conditioned fear. Neuropsychopharmacology. 2010;36:529–38. doi: 10.1038/npp.2010.184. [DOI] [PMC free article] [PubMed] [Google Scholar]
- Sotres-Bayon F, Quirk GJ. Prefrontal control of fear: more than just extinction. Curr Opin Neurobiol. 2010;20:231–5. doi: 10.1016/j.conb.2010.02.005. [DOI] [PMC free article] [PubMed] [Google Scholar]
- Statsoft inc. Electronic statistics textbook. Statsoft; Tulsa, OK: 2010. [Google Scholar]
- Thiruvady DR, Georgiou-Karistianis N, Egan GF, Ray S, Sritharan A, Farrow M, et al. Functional connectivity of the prefrontal cortex in Huntington’s disease. J Neurol Neurosurg Psychiatry. 2007;78:127–33. doi: 10.1136/jnnp.2006.098368. [DOI] [PMC free article] [PubMed] [Google Scholar]
- Verny C, Allain P, Prudean A, Malinge MC, Gohier B, Scherer C, et al. Cognitive changes in asymptomatic carriers of the Huntington disease mutation gene. Eur J Neurol. 2007;14:1344–50. doi: 10.1111/j.1468-1331.2007.01975.x. [DOI] [PubMed] [Google Scholar]
- Vidal-Gonzalez I, Vidal-Gonzalez B, Rauch SL, Quirk GJ. Microstimulation reveals opposing influences of prelimbic and infralimbic cortex on the expression of conditioned fear. Learn Mem. 2006;13:728–33. doi: 10.1101/lm.306106. [DOI] [PMC free article] [PubMed] [Google Scholar]
- von Horsten S, Schmitt I, Nguyen HP, Holzmann C, Schmidt T, Walther T, et al. Transgenic rat model of Huntington’s disease. Hum Mol Genet. 2003;12:617–24. doi: 10.1093/hmg/ddg075. [DOI] [PubMed] [Google Scholar]
- Walker AG, Miller BR, Fritsch JN, Barton SJ, Rebec GV. Altered information processing in the prefrontal cortex of Huntington’s disease mouse models. J Neurosci. 2008;28:8973–82. doi: 10.1523/JNEUROSCI.2804-08.2008. [DOI] [PMC free article] [PubMed] [Google Scholar]
- Wastell DG. A simple randomisation procedure for validating discriminant analysis: a methodological note. Biol Psychol. 1987;24:123–7. doi: 10.1016/0301-0511(87)90019-6. [DOI] [PubMed] [Google Scholar]
- Wellman CL, Izquierdo AA, Garrett JE, Martin KP, Carroll JJ, Millstein RR, et al. Impaired stress-coping and fear extinction and abnormal corticolimbic morphology in serotonin transporter knock-out mice. J Neurosci. 2007;27:684–91. doi: 10.1523/JNEUROSCI.4595-06.2007. [DOI] [PMC free article] [PubMed] [Google Scholar]
- Wolf RC, Sambataro F, Vasic N, Schonfeldt-Lecuona C, Ecker D, Landwehrmeyer B. Aberrant connectivity of lateral prefrontal networks in presymptomatic Huntington’s disease. Exp Neurol. 2008;213:137–44. doi: 10.1016/j.expneurol.2008.05.017. [DOI] [PubMed] [Google Scholar]
- Wolf RC, Vasic N, Schonfeldt-Lecuona C, Ecker D, Landwehrmeyer GB. Cortical dysfunction in patients with Huntington’s disease during working memory performance. Hum Brain Mapp. 2009;30:327–39. doi: 10.1002/hbm.20502. [DOI] [PMC free article] [PubMed] [Google Scholar]
- Wolf RC, Vasic N, Schonfeldt-Lecuona C, Landwehrmeyer GB, Ecker D. Dorsolateral prefrontal cortex dysfunction in presymptomatic Huntington’s disease: evidence from event-related fMRI. Brain. 2007;130:2845–57. doi: 10.1093/brain/awm210. [DOI] [PubMed] [Google Scholar]
- Wood NI, Carta V, Milde S, Skillings EA, McAllister CJ, Ang YL, et al. Responses to environmental enrichment differ with sex and genotype in a transgenic mouse model of Huntington’s disease. PLoS One. 2010;5:e9077. doi: 10.1371/journal.pone.0009077. [DOI] [PMC free article] [PubMed] [Google Scholar]
- Zakzanis KK. The subcortical dementia of Huntington’s disease. J Clin Exp Neuropsychol. 1998;20:565–78. doi: 10.1076/jcen.20.4.565.1468. [DOI] [PubMed] [Google Scholar]