Abstract
A strategy for spectroscopy tissue diagnosis using a small number of wavelengths is reported. The feasibility to accurately quantify tissue information using only 16 wavelengths is demonstrated with several wavelength reduction simulations of the existing esophageal data set. These results are an important step for the development of a miniaturized, robust and low-cost spectroscopy system. This system is based on a sub-millimeter high-selective filter array that offers prospects for a simplified miniature spectrographic detector for a future diagnostic tool to improve the diagnosis of dysplasia. Several thin-film optical filters are optimized and fabricated and its spectral performance is shown to be sufficient for the selection of specific wavelength bands.
OCIS codes: (170.3890) Medical optics instrumentation; (170.6510) Spectroscopy, tissue diagnostics; (120.2230) Fabry-Perot; (310.0310) Thin films
1. Introduction
The majority of lower esophageal adenocarcinomas appear in patients with Barrett's esophagus (BE), a premalignant condition in which the normal squamous epithelium is replaced by metaplastic columnar epithelium. Adenocarcinomas develop through increasing grades of dysplasia, which is the precursor lesion of epithelial cancers. Detection of dysplasia is essential for managing this type of cancer since the chances of an effective treatment increase if the disease is diagnosed at an early stage, significantly improving the survival rate [1–4].
Dysplastic lesions arising in BE are difficult to identify and to diagnose using standard methods, such as conventional white-light endoscopy [5]. Therefore, clinicians take systematic patterned biopsies to screen for dysplasia. Moreover, dysplasia can be difficult to diagnose due to the poor intra- and inter-observer agreement among gastrointestinal pathologists [6–9].
Optical techniques, such as diffuse reflectance and fluorescence spectroscopy, provide contrast based on tissue morphology and biochemistry to help differentiate non-dysplastic from dysplastic lesions in BE. These techniques can be used to guide biopsy during white-light endoscopy [1,2,9,10]. Several groups have successfully applied diffuse reflectance and fluorescence spectroscopy for detecting and classifying dysplasia in BE [1,11–14].
Diffuse reflectance spectra can be analyzed using a well-developed analytical model to obtain tissue optical parameters, such as the wavelength dependent scattering parameter, and hemoglobin concentration and oxygen saturation [15]. Intrinsic fluorescence spectroscopy is used to extract the relative contributions of tissue fluorophores, such as NAD(P)H and collagen [16]. These parameters are subsequently correlated to histopathologic diagnosis and analyzed using statistical methods to develop quantitative diagnostic algorithms.
Research prototypes designed to perform diffuse reflectance and fluorescence spectroscopy are generally accurate in the quantification of tissue parameters and in diagnosis. However, these prototypes suffer from several drawbacks. Regular optical fibers usually have low collection efficiency, thus requiring high quantum efficiency detectors (such as charge coupled device cameras - CCDs). In addition, these research prototypes (not yet commercially available) include costly, bulky and sophisticated illumination equipment (xenon arc lamps, UV lasers). Therefore, the development of a low complexity, miniature, and cost-effective spectroscopy system without the need of optical fibers, spectrograph or CCD cameras could potentially increase the collection efficiency, while simplifying the device. Previous studies have aimed to develop a system with some of these features using LEDs (light-emitting diodes) as the illumination sources and photodiodes as the detector [17,18]. Yu et al. [17] developed an optical device to quantitatively assess tissue optical properties using a silicon photodiode for detection. However, a xenon lamp, a monochromator and optical fibers were still used. Lo et al. [18] described a spectroscopy system that can integrate LEDs for illumination and wavelength selection, and silicon photodiodes for detection. Even though this study represents a big step towards decreasing the cost and size of conventional spectroscopy systems, only five LED wavelengths are used, which may not be enough to accurately extract other physiological parameters besides hemoglobin. The addition of extra LEDs can compromise a full integration and size reduction.
In this study we propose the development of a potentially robust sub-millimeter narrow-band pass filter array that offers prospects for a simplified miniature spectrographic detector for a future spectrographic diagnostic tool to improve diagnosis of dysplasia.
In this paper we describe a strategy for spectroscopy diagnosis using a reduced number of wavelengths. The long term goal of this study is the development of a simple spectral instrument based on thin-film optical filters and silicon photodiodes for signal detection. Here we focus on diffuse reflectance spectroscopy. Nevertheless, the instrument has potential for fluorescence measurements which is the subject of future work.
2. Diffuse reflectance spectroscopy model
In diffuse reflectance spectroscopy (DRS) white-light is delivered to the tissue and photons are absorbed and elastically scattered multiple times by tissue constituents. The detected scattered photons carry information about tissue structure and composition. Using a well-developed model based on the diffusion approximation [15], quantitative information about tissue constituents that contribute to reflectance can be extracted. In this method, the reflectance spectra are fit to the Zonios et al. [15] model to determine the values of the reduced scattering, , and absorption, , coefficients of the tissue (in mm−1). These coefficients can be expressed as [19]:
| (1) |
| (2) |
In Eq. (1), λ is the wavelength (in μm) and is equal to 0.7 μm ( is the reference wavelength for the extraction of parameter A). The second term is used to accurately model reflectance at wavelengths below 0.4 μm.
For Eq. (2) is a correction factor to account for the vessel packaging effect (related to the fact that hemoglobin is restrained to blood vessels that are more or less transparent to light depending on the incident wavelength), and theta = / 150 and corresponds to the volume fraction of blood sampled, where a hemoglobin concentration of 150 mg/mL is assumed for whole blood. is defined by:
| (3) |
where is the effective blood vessel radius (in mm) and is the absorption coefficient of whole blood (in mm−1):
| (4) |
where α is the hemoglobin oxygen saturation; and are the molar extinction coefficient spectra of the oxygenated and deoxygenated hemoglobin, respectively.
The measured reflectance spectra in the data set used in the present study were fit over the 350 to 750 nm range using a nonlinear least-squares fitting algorithm. From the fitting six DRS parameters are extracted at each tissue spot: A, related to scatterer density (mm−1); B, related to the average scatterer size; C, related to scattering by small particles; , the total concentration of hemoglobin (mg/mL);, the effective blood vessel radius (mm); and α, the oxygen saturation of hemoglobin.
3. Instrumentation
The designed system will be composed of thin-film optical filters and silicon photodiodes that will, respectively, select and detect several light wavelengths. In addition, commercial small-size ultraviolet (UV) and white LEDs will be incorporated in the system as the illumination sources for fluorescence and diffuse reflectance spectroscopy, respectively. UV LEDs are already available at the die level (Nitride Semiconductors Co., Ltd., The Fox Group Inc., among others) whereas white LEDs with high luminous efficacy have already been developed [20]. The use of these components eliminates the need for expensive illumination and detection equipment (high-power xenon arc lamp, CCD camera, spectrograph), and optical fibers to delivery and collect light from tissues.
This miniaturized spectroscopy system could be integrated in standard clinical endoscopes making these instruments more compact and portable. Its dimensional advantage can also enable a future integration in a smaller and less invasive device, such as the endoscopic capsule. Once a CMOS co-integration process is used, the dimensions of each optical microsensor (thin-film optical filter and photodiode) can be scaled down to 50x50 μm2 to enable integration into an endoscopic capsule. The fabrication of the system in a compatible CMOS process will also allow the mass production of the microsensors at reduced costs. With this integration essential diagnostic functions will be added to current capsule imaging functions. In this particular application, numerous microsystems should be built and positioned around the capsule and not only in its front (such as the cameras of the commercial capsules), so that a wide tissue area can be assessed. It is known that the majority of endoscopes that integrate spectroscopy functions use point spectroscopy instead of imaging spectroscopy. Despite of being a promising method for detecting early stage cancer, point spectroscopy techniques suffer from undersampling, missing contextual information often needed to distinguish diseased from surrounding normal tissues. Incorporating optical detectors all around the capsule may solve this drawback. The promising developments in the field of the capsule locomotion and stopping mechanisms [21–23] will make it possible to place the capsule into gentle contact with the tissue when data are taken. The use of a detection system directly in contact with the tissue enables collection of most of the reemitted light, which represents a significant advantage over conventional systems [17,18]. Figure 1 depicts the several components of a conventional and a miniaturized spectroscopy system.
Fig. 1.
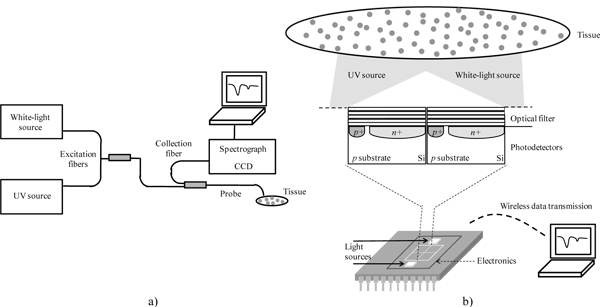
Spectroscopy systems. (a) Conventional system with excitation and collection fibers, white-light and UV illumination sources, spectrograph and CCD for detection. (b) Miniaturized system with LEDs as light sources, optical filters and photodetectors for wavelength selection and detection, respectively (not scaled). Data transmission is intended to be wireless.
3.1 Wavelength reduction analysis
The possibility of replacing the spectrograph by a series of optical filters in the 350 to 750 nm spectral range was first investigated using an existing diffuse reflectance data set. These data were taken from esophageal tissue using a system described elsewhere [1]. For this study, simulations on wavelength reduction were performed on the data set in order to assess the feasibility of reducing the 400 wavelengths used to perform diagnosis to only 16, while still achieving a good accuracy in the extraction of tissue optical properties (sixteen was considered the minimum number of wavelengths from which one could accurately extract tissue information, as will be detailed in section 4.1).
If that is feasible, the optical microsensors used for light collection will be composed by a 16 narrow-band pass filter array (4 by 4), placed on top of an array of silicon photodiodes. The array area will be approximately 200x200 μm2. The final encapsulation of the dies on a single chip will also require some space for wiring that will depend on the number of bonding pads (each bonding pad has a maximum size of 100x100 μm2) and the encapsulation package. Each optical microsensor will be collecting different wavelength bands from slightly different locations in the tissue surface. However, since the maximum center to center separation of photodiodes will be around 150 μm it is reasonable to believe that no significant spatial heterogeneity will be introduced across wavelengths. Moreover, the analog photodiodes array readout electronics signals will be converted to digital using a compact Sigma-delta converter, already studied by the research group [24]. Each photodiode will have one converter. It is important to notice that the addition of readout electronics will not increase the size of the optical microsensors since this converter can be designed with only 19 MOSFETs [24]. This scheme will be able to make a conversion in less than 1 microsecond. Thus, in order to avoid any potential spatial heterogeneity that might occur, the position of the optical array might be slightly moved to scan the tissue area under analysis, enabling several measurements, in different locations, by each optical microsensor. With this approach a matrix with 16 different spectral measurements in each specific location can be obtained.
For the wavelength reduction analysis, diffuse reflectance algorithms (section 2) were implemented using MATLAB tools (from The MathWorksTM). Based on previously published results [1], several slightly different combinations of 16 wavelengths were chosen and simulated. For all the simulations the following wavelengths were fixed: 350 and 750 nm (the first and last wavelength in the analysis); 420, 540 and 580 nm (corresponding to oxy-hemoglobin absorption peaks); and 700 nm (reference wavelength). The remaining wavelengths were selected to cover the full visible range. The spacing between selected points must take into account the filters fabrication constraints, namely their FWHM (Full-Width-Half-Maximum), i.e., the filters transmittance spectrum should not considerably overlap. Thus, the best 16 wavelengths group is composed by those 6 fixed points and by 10 more wavelengths which are more or less equally spaced along the spectrum, corresponding to filters which by design don’t overlap.
The diffuse reflectance data were then processed and data points from all wavelengths were eliminated, with exception for those corresponding to the selected 16 wavelengths. Thus, instead of having a continuous array of 400 wavelengths (from 350 to 750 nm), and the corresponding reflectance intensity values, a discrete set of 16 specific data points is obtained. The remaining spectrum intensities are achieved by linear interpolation within the range of the discrete data set. This newly generated spectrum is then used to extract the tissue spectroscopy parameters. In the system to be developed, optical microsensors will directly provide these 16 intensity values from which the reflectance spectrum will be reconstructed. In this procedure unknown data points are being calculated, and therefore one must be aware that the results might not be exactly the same as when using the original spectrum. Still, the overall advantages of having such a miniaturized system may offset the error.
The feasibility study outputs the group of the 16 wavelengths that better fits the original continuous spectrum. These 16 wavelengths will be selectively detected using one stack of TiO2 and SiO2 thin-films, as detailed next below.
3.2 Thin-film optical filters
A 16 narrow-band optical filter array has been designed based on Fabry-Perot thin-film optical resonators. In addition to the optical filter array only a white-light and a UV source for reflectance and fluorescence illumination, respectively, will be required, thus avoiding a full spectrograph. The filtering system should be designed to yield a narrow-band pass around the selected wavelengths. This way, the instrument will have the high selectivity, at the desired wavelength, required for the application.
The Fabry-Perot resonators consist of two flat parallel mirrors separated by a pre-defined distance, with a resonance cavity in the middle. The thickness of the resonance cavity determines the transmitted wavelength. In this study, the mirrors are dielectric mirrors composed of a stack of TiO2 and SiO2 thin-films (high and low refractive index materials, respectively, in the visible spectrum) that offer good performance characteristics with high reflectivity and low absorption losses [25–27]. The refractive indexes of these materials (for a TiO2 thickness of 52 nm and a SiO2 thickness of 95 nm) were measured by ellipsometry (Table 1 ). Titania and silica have been selected because of the IC (integrated circuit) compatibility and the well characterization of their deposition process. Also, the refractive index of SiO2 for the spectral band between 350 nm and 750 nm is almost wavelength independent (1.476 to 1.455, respectively, with variations smaller than 3%).The selected wavelengths for this study are closely spaced. Hence, the optical filters must be highly selective with a FWHM less than 20 nm to avoid misidentification in the analysis by possible overlapping of emitted wavelengths.
Table 1. Measured Refractive Indexes (n) of the Dielectric Materials SiO2 and TiO2.
| Wavelength (nm) | 350 | 370 | 380 | 400 | 420 | 450 | 480 | 510 |
|---|---|---|---|---|---|---|---|---|
| n of SiO2 | 1.476 | 1.473 | 1.472 | 1.470 | 1.468 | 1.465 | 1.463 | 1.462 |
| n of TiO2 | 2.931 | 2.889 | 2.834 | 2.77 | 2.699 | 2.62 | 2.556 | 2.504 |
| Wavelength (nm) | 540 | 560 | 580 | 600 | 620 | 650 | 700 | 750 |
|---|---|---|---|---|---|---|---|---|
| n of SiO2 | 1.460 | 1.459 | 1.459 | 1.458 | 1.458 | 1.457 | 1.456 | 1.455 |
| n of TiO2 | 2.461 | 2.434 | 2.411 | 2.39 | 2.375 | 2.351 | 2.318 | 2.294 |
4. Results and discussion
4.1 Wavelength reduction simulations
The selection of wavelengths for the design of thin-film optical filters was based on simulations of wavelength reduction on an existing diffuse reflectance data set. The data set consisted of 53 histologically confirmed non-dysplastic tissue sites and 10 high-grade dysplastic esophageal tissue sites. The goal is to investigate if it is possible to accurately extract tissue properties using reflectance intensity values of only 16 wavelengths, and interpolating the remaining spectrum intensities to cover the whole 350 to 750 nm range.
For the simulations diffuse reflectance parameters were extracted from high-grade dysplastic and normal squamous esophageal tissue. Several combinations of 16 wavelengths were simulated. The combination that provided the best results comprises the following discrete points: 350, 370, 380, 400, 420, 450, 480, 510, 540, 560, 580, 600, 620, 650, 700, and 750 nm. For this wavelength selection a compromise between the accuracy in parameters extraction and the constraints inherent to the filters fabrication process (e.g. materials, number of layers, FWHM, and maximum transmission) had to be achieved. This wavelength choice is important for the intended diagnosis and will be dependent on the clinical situation for which the system is going to be used for. Since the esophagus is expected as the first application of the microsystem, the used clinical data set is suitable for the simulations. Examples of DRS spectra of high-grade dysplasia and non-dysplastic squamous tissue are shown in Fig. 2 .
Fig. 2.
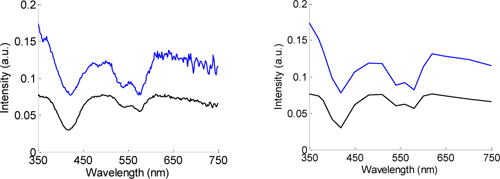
Examples of DRS spectra for normal (upper line) and high-grade dysplastic tissue (bottom line), for (a) the full wavelength range (original spectrum) (b) and only 16 wavelengths (reconstructed spectrum).
The reduced scattering and absorption coefficients were determined for 16 different wavelengths, using the original spectrum and the reconstructed spectrum of high-grade dysplastic and non-dysplastic tissue sites (Fig. 3 ). In general, the extracted coefficients using the reconstructed spectrum are in good agreement with the coefficients extracted from the original spectrum, with a strong and positive correlation: correlation coefficients of 0.951 and 0.933 for the reduced scattering coefficient of high-grade dysplasia and non-dysplastic tissue sites, respectively; and, 0.966 and 0.987 for the absorption coefficient of high-grade dysplasia and non-dysplastic tissue sites, in that order. Thus, it is expected that the miniaturized system and the conventional systems will have very comparable performance in the quantification of tissue optical information.
Fig. 3.
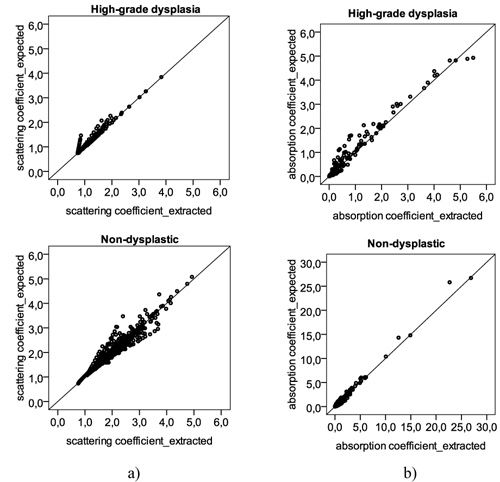
Scatter plots with the (a) reduced scattering coefficient and (b) absorption coefficient, determined for several different wavelengths: 350, 370, 380, 400, 420, 450, 480, 510, 540, 560, 580, 600, 620, 650, 700, and 750 nm. For each of these wavelengths, a different coefficient will be determined in each tissue site: a total of 10 high-grade dysplastic tissue sites and 53 non-dysplastic tissue sites were used, corresponding to 160 (10 times 16) and 848 (53 times 16) different values of reduced scattering and absorption coefficient. Y-axis represents the values of the coefficients extracted with the original spectrum; X-axis represents the values of the coefficients determined with the reconstructed spectrum, using only 16 points. The 45 degree black line represents a perfect agreement between the expected values, from the original spectrum, and the extracted values, from the reconstructed spectrum.
An even more reduced number of wavelengths for spectra analysis would be useful to further reduce the size and complexity of the optical microsensors. However a trade-off between this number and an accurate extraction of optical parameters had to be achieved. Sixteen was considered the limit beyond which one could accurately determine those parameters.
For demonstration, Fig. 4 presents the same results of Fig. 3 but extracted using only 10 wavelengths (350, 380, 400, 420, 480, 540, 580, 600, 700 and 750), instead of 16. In this approach, the extracted coefficients using the reconstructed spectrum have weaker correlations with the coefficients determined from the original spectrum, when compared with the previous strategy. Specifically, for the reduced scattering coefficient of non-dysplastic tissue sites, there is a weak and not very significant correlation between the expected and extracted values, with a correlation coefficient of 0.326. From the obtained results it is clear the performance improvement of using 16 over 10 wavelengths for quantitative spectroscopy.
Fig. 4.
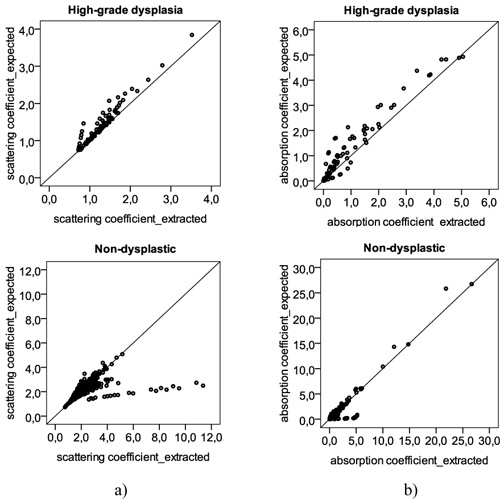
Scatter plots with the (a) reduced scattering coefficient and (b) absorption coefficient, determined for several different wavelengths: 350, 370, 380, 400, 420, 450, 480, 510, 540, 560, 580, 600, 620, 650, 700, and 750 nm. Y-axis represents the values of the coefficients extracted with the original spectrum; X-axis represents the values of the coefficients determined with the reconstructed spectrum, using only 10 points.
The theoretical parameters extraction performance of the miniaturized system was then assessed. Scatter plots displaying the expected (using the full spectrum) and extracted (using only 16 wavelengths) parameter values are presented in Fig. 5 for four DRS parameters: two parameters extracted from the reduced scattering coefficient (A and B), and two parameters extracted from the absorption coefficient ( and ).
Fig. 5.
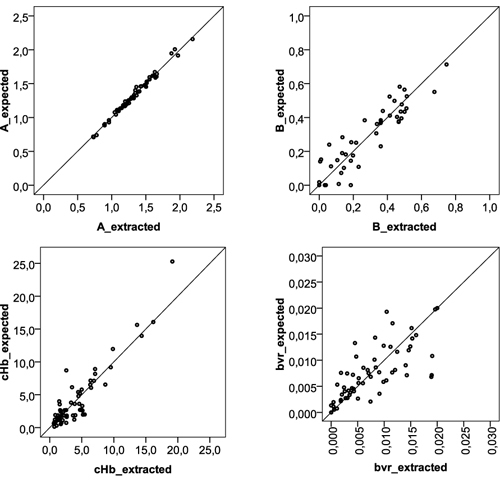
Scatter plots with the tissue parameter values for four DRS parameters: A, B, (hemoglobin concentration), and (effective blood vessel radius), extracted using the full spectrum (expected values) and only 16 wavelengths (extracted values).
Overall, the reported results demonstrate that reflectance tissue parameters can be relatively well determined using a reduced number of wavelengths, and thus these parameters can be used with confidence for the development of predictive models to identify normal and malignant tissues. Still, for some tissue sites, optical parameters could not be accurately extracted, which might be due to loss of spectral information with interpolation. The use of a different interpolation method could minimize this error. Also, in further studies an alternative approach will be evaluated: a model discretization will be applied and the parameter results will be compared to the ones obtained using linear interpolation.
This rough methodology is applied as an initial approach to select the 16 central wavelengths to fabricate the optical filters, and to demonstrate the feasibility of wavelength reduction for the assessment of tissue optical properties.
4.2 Optical filtering system
The obtained results show the viability of using 16 wavelengths to extract tissue biochemical and morphological information. The selection of these wavelengths can be achieved using a 16 narrow-band pass optical filter array. This array is composed of three groups of optical filters to cover different regions of the spectrum: near-UV/violet (350 to 450 nm); red (620 to 750 nm); central band of the visible spectrum (480 to 600 nm). Thin-film optics software TFCalcTM 3.5 was used for the structural optimization of the optical filters. Simulations were performed using the previously measured refractive indexes (Table 1). In each group, the filters are composed by 11 layers of TiO2 and SiO2, and can be easily tuned to a different wavelength by adjusting the thickness of the resonance cavity, e.g., the 6th layer (Table 2 ). This enables the fabrication of several optical filters in each region of the spectrum while minimizing the global deposition time.Meanwhile, 6 of the 16 optical filters were fabricated in order to adjust the manufacturing process before proceeding with the fabrication of the remaining filters. Thin-film optical filters fabrication needs to be well controlled and optimized, because the position of the peak is highly sensitive to thickness variation. For example, a thickness variation of only 1 nm in each of the TiO2 layers, relative to what was initially designed, is enough to move the peak to a different central wavelength. As demonstrated in Fig. 6 , an increase of 1 nm in the thickness of each of the TiO2 layers significantly affects the central peak position of the 540 nm filter (this effect might be noticed not only in the peak central wavelength, but also in its FWHM and transmission efficiency). For that reason, the filters were deposited by Ion Beam Deposition (IBD) in a 1 nanometer resolution system (Nordiko 3000).
Table 2. Layer Thicknesses of the 16 Fabry-Perot Optical Filters.
| |
Maximum wavelength transmission |
|||||||||||||||
|---|---|---|---|---|---|---|---|---|---|---|---|---|---|---|---|---|
| |
350 |
370 |
380 |
400 |
420 |
450 |
480 |
510 |
540 |
560 |
580 |
600 |
620 |
650 |
700 |
750 |
| Layer thicknesses (nm) | ||||||||||||||||
| TiO2 | 36 | 52 | 72 | |||||||||||||
| SiO2 | 68 | 95 | 116 | |||||||||||||
| TiO2 | 36 | 52 | 72 | |||||||||||||
| SiO2 | 68 | 95 | 116 | |||||||||||||
| TiO2 | 36 | 52 | 72 | |||||||||||||
| SiO2 | 94 | 110 | 120 | 136 | 154 | 182 | 140 | 164 | 192 | 206 | 227 | 242 | 182 | 210 | 255 | 301 |
|---|---|---|---|---|---|---|---|---|---|---|---|---|---|---|---|---|
| TiO2 | 36 | 52 | 72 | |||||||||||||
| SiO2 | 68 | 95 | 116 | |||||||||||||
| TiO2 | 36 | 52 | 72 | |||||||||||||
| SiO2 | 68 | 95 | 116 | |||||||||||||
| TiO2 | 36 | 52 | 72 | |||||||||||||
Fig. 6.
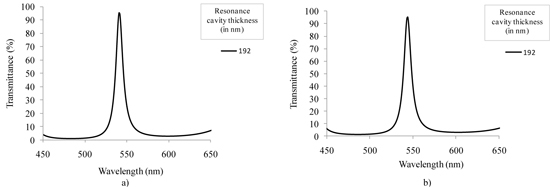
Simulated spectral transmittance for the 540 nm optical filter, with maximum intensity peaks at: (a) 540 and (b) 543 nm, when there is an increase of 1 nm in the thickness of each of the TiO2 layers.
Prior to filters fabrication, simple SiO2 and TiO2 films were deposited on silicon substrates to calibrate deposition rates and indexes of refraction. Subsequently, multilayer filters were deposited on a glass substrate.
The fabricated narrow-band pass filters were analyzed by cross section SEM (Scanning Electron Microscope) in order to assess layer thicknesses and interface quality between the SiO2 and TiO2 layers. Figure 7 depicts the cross-section of one of the analyzed optical filters (filter with peak centered at 560 nm).
Fig. 7.
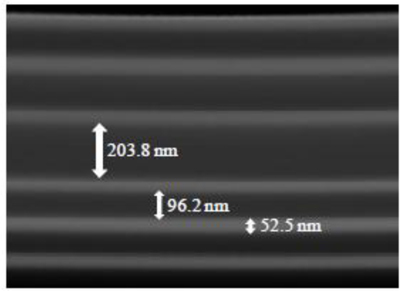
SEM photograph showing the cross-section of the Fabry-Perot optical filter with the peak centered at 560 nm (magnification 200,000 times).
Figure 7 demonstrates the clear separation between the SiO2 and TiO2 layers, with very low interface mixing (brighter layers correspond to TiO2). The mirrors thicknesses are in good agreement with the outlined values, whereas the resonance cavity thickness is slightly lower than what was initially designed (206 nm). Very good film flatness is shown along the entire area. This feature allows guarantee the parallelism of the mirrors concerning to the resonance cavity, which is crucial for reproducible optical measurements.
The transmittance of the fabricated filters was then assessed using a spectrophotometer from Shimadzu (UV-3101PC), and is demonstrated in Fig. 8 . All the measurements were performed with the placement of a wide-band pass filter (200 nm wide) on top of the optical filters. This wide-band pass filter eliminates the tails of the filters outside the 450-650 nm spectral region. At this stage, this filter was fabricated on a glass substrate and placed on top of the 6 Fabry-Perot optical filters. In the final device, a thin-film wide-band pass filter will be processed directly on top of the narrow-band optical filters array, and its effect will be combined in the measurements with the optical effect of the silicon photodiodes. A wide-band pass filter is easily obtained with a multilayer structure, composed by 11 layers of SiO2 and TiO2, which can be represented by: SiO2/TiO2/ SiO2/TiO2/ SiO2/TiO2/ SiO2/TiO2/ SiO2/TiO2/SiO2. All these layers have a thickness equal to 88 nm.
Fig. 8.
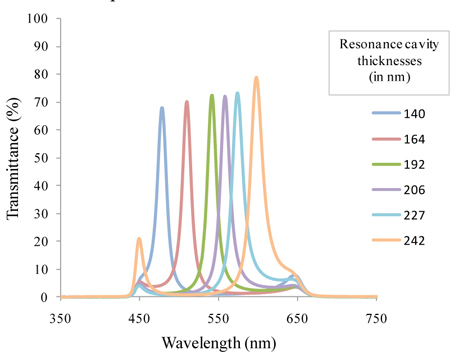
Measured transmittance spectra for the 6 fabricated Fabry-Perot optical filters with the wide-band pass filter included.
Optical spectra measurements show that a multilayer structure composed of (TiO2,SiO2)2TiO2/SiO2/TiO2(SiO2,TiO2)2 is the best option in terms of optical characteristics and fabrication process. The results show that each filter is sensitive to a specific spectral band, with FWHM < 20 nm, and a ratio of maximum transmittance to background noise greater than 70/20. The FWHM translates the quality of the filter in terms of its ability to select a narrow band of the electromagnetic spectrum, and therefore, ideally, should be as low as possible. Additionally, the transmittance peak should be high, with at least twice the intensity of any background noise that might appear in the considered spectral range, so that we can clearly discriminate the specific wavelengths, without noise overlap (if it is less, the background noise will significantly affect the measurements) [25]. The filters peaks are slightly deviated from what was designed, being centered at: 478; 510; 540; 558; 574; and 598 nm. These differences between the design and the outcome of the fabrication process are mainly explained by the etching that might occur in some of the layers immediately below, when the multilayer is deposited. Indeed, the total thickness of the multilayers was measured using a profilometer, and the result was 2% less than what was initially designed. This event will obviously shift the central transmitted wavelength. As mentioned before, the process is being optimized and adjustments on the deposition rates are on-going. The overall performance of the optical filters could be improved by increasing the number of dielectric layers, but the fabrication process complexity would also increase.
The integration of optical filters, photodiodes and readout electronics on a single-chip requires the system to fit in a microelectronic process, preferably CMOS. The CMOS process provides three photosensitive structures as vertical junction photodiodes. At a particular wavelength, their quantum efficiency varies according to their junction depth. For this particular spectral region, we will use pn-junction photodiodes fabricated in a standard 0.7 μm CMOS process, without additional masks or steps.
As an example, a simulation of the optical transmittance for the 540 nm filter was performed taking into account the effect of the previously described wide-band pass filter and the effect of using a n + /p-epilayer photodiode to read the signal. Previous studies from our group have shown the fabrication and characterization of this type of photodiode [28]. The thickness of the photodiode junction depth is fixed by the microelectronics foundry, and equals to 350 nm (this junction depth is included in the simulations). Figure 9(a) depicts the transmittance of the filter without the optical effect of the wide-band pass filter and photodiode, whereas Fig. 9(b) illustrates the transmittance of the narrow-band pass filter with both effects included in the simulation. From Fig. 9(b) it is clear the signal attenuation below 450 nm and after 650 nm to less than 12%. Also, the maximum transmittance is lower due to the effect of the wide-band pass filter and photodiode. This approach enables the collection of spectroscopy data only around the filter central wavelength.
Fig. 9.
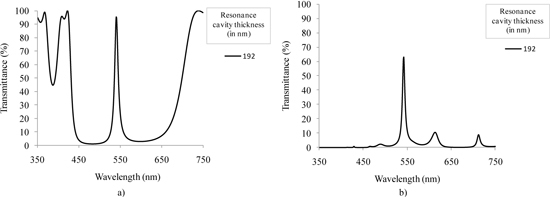
Simulated transmittance spectra for the 540 nm Fabry-Perot optical filter: (a) not including and (b) including the optical effect of the wide-band pass filter and the n + /p-epilayer photodiode.
A new study was carried out for assessing the performance of the fabricated optical filters when used for spectroscopy. This study consisted in measuring diffuse reflectance spectrum from a tissue phantom using the fabricated optical filters (together with the wide-band pass filter) placed in front of the UV-3101PC spectrophotometer detector, to determine how accurately each filter could detect the diffuse reflectance signal. The phantoms consist of a mixture of intralipid and hemoglobin (Sigma Aldrich Co.) and water. The intralipid and the water soluble hemoglobin are used for scattering and absorbing, respectively. All the collected spectra were normalized by the reflectance spectra measured from a standard (solid sample of BaSO4) to correct for the wavelength dependent response of the system.
For this study, a diffuse reflectance spectrum measured from the tissue phantom without using optical filters was first acquired (Fig. 10(a) ). After, consecutive diffuse reflectance measurements using each of the fabricated filters in front of the detection system were performed on the same tissue phantom (Fig. 10(b)). The resulting 6 Gaussian distributed spectra were integrated over the full wavelength range. The obtained 6 intensity values correspond to the signal that will be read by the optical microsensor. In a further processing, the filters transmittance spectra (Fig. 8) were also integrated, and the intensity read by the optical microsensor was divided by these 6 values. This way, one can obtain the final 6 data points that will compose the wavelength-reduced spectrum (Fig. 10(c)).
Fig. 10.
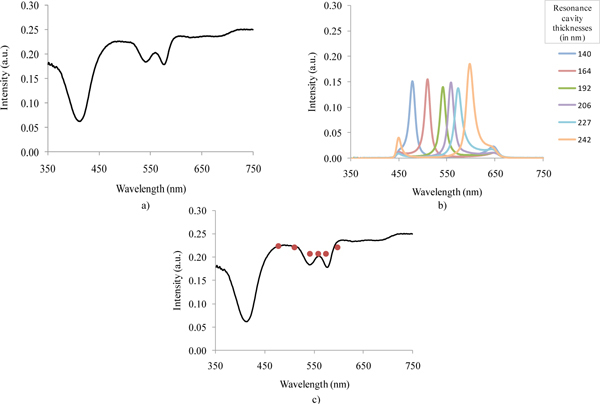
Diffuse reflectance spectra: (a) measured with the UV-3101PC spectrophotometer; (b) measured with the 6 fabricated narrow-band pass optical filters; and, (c) together with the 6 integrated intensity values that will be obtained using the miniaturized system.
The intensity values obtained with the fabricated filters are similar to the originally obtained reflectance intensities measured over the full wavelength range, except for the 540 and 580 nm valleys that are not as noticeable as desired. This divergence might be explained by the filters FWHM. The on-going optimizations to the fabrication process should enable the fabrication of more accurate filters, correctly centered at the specific wavelengths, and with a smaller FWHM. Overall, it is reasonable to consider that the results validate the possibility of replacing the spectrograph by an array of thin-film narrow-band pass filters.
5. Conclusions
Diffuse reflectance spectroscopy is used to analyze tissue and to extract quantitative information. This study demonstrates that it is possible to obtain tissue properties accurately using a small number of wavelengths. These results represent an important step towards the development of a much smaller, simpler, and cost-effective device compared with the conventional spectroscopy prototypes, and with similar throughput.
The wavelength-reduction simulations were performed using real esophageal tissue data and the values of tissue properties obtained with the selected 16 wavelengths are comparable with those obtained using 400 wavelengths. However, it is important to notice the significance of wavelength selection which may be different when using the system for other tissue types. After this feasibility study, thin-film narrow-band pass filters were fabricated and its optical performance was assessed. Reflectance measurements, performed on tissue phantoms, using the full wavelength range and the fabricated optical filters provided comparable results.
Overall, the results show the feasibility of replacing the spectrograph in a conventional system by a series of narrow-band pass optical filters in the new spectroscopy system. Also, with a future integration of LEDs for illumination and silicon photodiodes for detection, the instrument will be fully miniaturized while still providing similar results in terms of quantitative diagnostic information. The described results open the way to explore the integration of the developed instrument into endoscopic devices with clinical potential. Due to its reduced size, it could be incorporated in standard endoscopes making it more compact and portable. Moreover, it has a potential to be integrated, in the future, into smaller, less-invasive devices, such as the endoscopic capsules. The future directions include: filter optimization (specified band pass, FWHM, signal-to-noise ratio, and reliable reproducibility); assembling the 16 filters with the silicon photodiodes (in a 4 by 4 array), on a single-chip with readout electronics; accommodate on the same chip UV and white-light miniaturized sources.
Acknowledgments
This research was supported by the Portuguese Foundation of Science and Technology under the MIT|Portugal Program (SFRH / BD / 38978 / 2007) and PTDC/BIO/70017/2006.
References and links
- 1.Georgakoudi I., Jacobson B. C., Van Dam J., Backman V., Wallace M. B., Müller M. G., Zhang Q., Badizadegan K., Sun D., Thomas G. A., Perelman L. T., Feld M. S., “Fluorescence, reflectance, and light-scattering spectroscopy for evaluating dysplasia in patients with Barrett’s esophagus,” Gastroenterology 120(7), 1620–1629 (2001). 10.1053/gast.2001.24842 [DOI] [PubMed] [Google Scholar]
- 2.Tunnell J. W., Desjardins A. E., Galindo L., Georgakoudi I., McGee S. A., Mirkovic J., Mueller M. G., Nazemi J., Nguyen F. T., Wax A., Zhang Q. G., Dasari R. R., Feld M. S., “Instrumentation for multi-modal spectroscopic diagnosis of epithelial dysplasia,” Technol. Cancer Res. Treat. 2(6), 505–514 (2003). [DOI] [PubMed] [Google Scholar]
- 3.Fléjou J. F., “Barrett’s oesophagus: from metaplasia to dysplasia and cancer,” Gut 54(Suppl 1), i6–i12 (2005). 10.1136/gut.2004.041525 [DOI] [PMC free article] [PubMed] [Google Scholar]
- 4.Villette S., Pigaglio-Deshayes S., Vever-Bizet C., Validire P., Bourg-Heckly G., “Ultraviolet-induced autofluorescence characterization of normal and tumoral esophageal epithelium cells with quantitation of NAD(P)H,” Photochem. Photobiol. Sci. 5(5), 483–492 (2006). 10.1039/b514801d [DOI] [PubMed] [Google Scholar]
- 5.Cameron A. J., “Management of Barrett’s esophagus,” Mayo Clin. Proc. 73(5), 457–461 (1998). 10.4065/73.5.457 [DOI] [PubMed] [Google Scholar]
- 6.Reid B. J., Haggitt R. C., Rubin C. E., Roth G., Surawicz C. M., Van Belle G., Lewin K., Weinstein W. M., Antonioli D. A., Goldman H., Macdonald W., Owen D., “Observer variation in the diagnosis of dysplasia in Barrett’s esophagus,” Hum. Pathol. 19(2), 166–178 (1988). 10.1016/S0046-8177(88)80344-7 [DOI] [PubMed] [Google Scholar]
- 7.Petras R. E., Sivak M. V., Jr, Rice T. W., “Barrett’s esophagus. a review of the pathologist’s role in diagnosis and management,” Pathol. Annu. 26(Pt 2), 1–32 (1991). [PubMed] [Google Scholar]
- 8.Wang K. K., Wongkeesong M., Buttar N. S., American Gastroenterological Association , “American Gastroenterological Association medical position statement: Role of the gastroenterologist in the management of esophageal carcinoma,” Gastroenterology 128(5), 1468–1470 (2005). 10.1053/j.gastro.2005.03.076 [DOI] [PubMed] [Google Scholar]
- 9.Wong Kee Song L. M., “Optical spectroscopy for the detection of dysplasia in Barrett’s esophagus,” Clin. Gastroenterol. Hepatol. 3(7 Suppl 1), S2–S7 (2005). 10.1016/S1542-3565(05)00250-8 [DOI] [PubMed] [Google Scholar]
- 10.Yu C. C., Lau C., O’Donoghue G., Mirkovic J., McGee S., Galindo L., Elackattu A., Stier E., Grillone G., Badizadegan K., Dasari R. R., Feld M. S., “Quantitative spectroscopic imaging for non-invasive early cancer detection,” Opt. Express 16(20), 16227–16239 (2008). 10.1364/OE.16.016227 [DOI] [PMC free article] [PubMed] [Google Scholar]
- 11.Panjehpour M., Overholt B. F., Vo-Dinh T., Haggitt R. C., Edwards D. H., Buckley F. P., 3rd, “Endoscopic fluorescence detection of high-grade dysplasia in Barrett’s esophagus,” Gastroenterology 111(1), 93–101 (1996). 10.1053/gast.1996.v111.pm8698231 [DOI] [PubMed] [Google Scholar]
- 12.Vo-Dinh T., Panjehpour M., Overholt B. F., “Laser-induced fluorescence for esophageal cancer and dysplasia diagnosis,” Ann. N. Y. Acad. Sci. 838(Advances in Optical Biopsy and Optical Mammography), 116–122 (1998). 10.1111/j.1749-6632.1998.tb08192.x [DOI] [PubMed] [Google Scholar]
- 13.Pfefer T. J., Paithankar D. Y., Poneros J. M., Schomacker K. T., Nishioka N. S., “Temporally and spectrally resolved fluorescence spectroscopy for the detection of high grade dysplasia in Barrett’s esophagus,” Lasers Surg. Med. 32(1), 10–16 (2003). 10.1002/lsm.10136 [DOI] [PubMed] [Google Scholar]
- 14.Ortner M. A., Ebert B., Hein E., Zumbusch K., Nolte D., Sukowski U., Weber-Eibel J., Fleige B., Dietel M., Stolte M., Oberhuber G., Porschen R., Klump B., Hörtnagl H., Lochs H., Rinneberg H., “Time gated fluorescence spectroscopy in Barrett’s oesophagus,” Gut 52(1), 28–33 (2003). 10.1136/gut.52.1.28 [DOI] [PMC free article] [PubMed] [Google Scholar]
- 15.Zonios G., Perelman L. T., Backman V. M., Manoharan R., Fitzmaurice M., Van Dam J., Feld M. S., “Diffuse reflectance spectroscopy of human adenomatous colon polyps in vivo,” Appl. Opt. 38(31), 6628–6637 (1999). 10.1364/AO.38.006628 [DOI] [PubMed] [Google Scholar]
- 16.Müller M. G., Georgakoudi I., Zhang Q. G., Wu J., Feld M. S., “Intrinsic fluorescence spectroscopy in turbid media: disentangling effects of scattering and absorption,” Appl. Opt. 40(25), 4633–4646 (2001). 10.1364/AO.40.004633 [DOI] [PubMed] [Google Scholar]
- 17.Yu B., Lo J. Y., Kuech T. F., Palmer G. M., Bender J. E., Ramanujam N., “Cost-effective diffuse reflectance spectroscopy device for quantifying tissue absorption and scattering in vivo,” J. Biomed. Opt. 13(6), 060505 (2008). 10.1117/1.3041500 [DOI] [PubMed] [Google Scholar]
- 18.Lo J. Y., Yu B., Fu H. L., Bender J. E., Palmer G. M., Kuech T. F., Ramanujam N., “A strategy for quantitative spectral imaging of tissue absorption and scattering using light emitting diodes and photodiodes,” Opt. Express 17(3), 1372–1384 (2009). 10.1364/OE.17.001372 [DOI] [PubMed] [Google Scholar]
- 19.Mirkovic J., Lau C., McGee S., Yu C. C., Nazemi J., Galindo L., Feng V., Darragh T., de Las Morenas A., Crum C., Stier E., Feld M. S., Badizadegan K., “Effect of anatomy on spectroscopic detection of cervical dysplasia,” J. Biomed. Opt. 14(4), 044021 (2009). 10.1117/1.3194142 [DOI] [PMC free article] [PubMed] [Google Scholar]
- 20.Narukawa Y., Ichikawa M., Sanga D., Sano M., Mukai T., “White light emitting diodes with super-high luminous efficacy,” J. Phys. D Appl. Phys. 43(35), 354002 (2010). 10.1088/0022-3727/43/35/354002 [DOI] [Google Scholar]
- 21.Phee L., Accoto D., Menciassi A., Stefanini C., Carrozza M. C., Dario P., “Analysis and development of locomotion devices for the gastrointestinal tract,” IEEE Trans. Biomed. Eng. 49(6), 613–616 (2002). 10.1109/TBME.2002.1001976 [DOI] [PubMed] [Google Scholar]
- 22.Menciassi A., Moglia A., Gorini S., Pernorio G., Stefanini C., Dario P., “Shape memory alloy clamping devices of a capsule for monitoring tasks in the gastrointestinal tract,” J. Micromech. Microeng. 15(11), 2045–2055 (2005). 10.1088/0960-1317/15/11/008 [DOI] [Google Scholar]
- 23.M. Quirini, S. Scapellato, P. Valdastri, A. Menciassi, and P. Dario, “An approach to capsular endoscopy with active motion,” in Proceedings of the 29th Annual International Conference of the IEEE EMBS (Institute of Electrical and Electronics Engineers, New York, 2007), pp. 2827–2830. [DOI] [PubMed] [Google Scholar]
- 24.Rocha J. G., Minas G., Lanceros-Mendez S., “Pixel Readout Circuit for X-Ray Imagers,” IEEE Sens. J. 10(11), 1740–1745 (2010). 10.1109/JSEN.2010.2046406 [DOI] [Google Scholar]
- 25.H. A. Macleod, Thin-Film Optical Filters (E.D. Institute of Physics Publishing, 2001). [Google Scholar]
- 26.Minas G., Wolffenbuttel R. F., Correia J. H., “A lab-on-a-chip for spectrophotometric analysis of biological fluids,” Lab Chip 5(11), 1303–1309 (2005). 10.1039/b506817g [DOI] [PubMed] [Google Scholar]
- 27.Minas G., Wolffenbuttel R. F., Correia J. H., “An array of highly selective Fabry-Perot optical channels for biological fluid analysis by optical absorption using a white light source for illumination,” J. Opt. A, Pure Appl. Opt. 8(3), 272–278 (2006). 10.1088/1464-4258/8/3/008 [DOI] [Google Scholar]
- 28.G. Minas, J. C. Ribeiro, R. F. Wolffenbuttel, and J. H. Correia, “On-Chip integrated CMOS optical detection microsystem for spectrophotometric analyses in biological microfluidic systems,” in Proceedings IEEE Int. Symposium on Industrial Electronics (Institute of Electrical and Electronics Engineers, New York, 2005), pp. 1133–1138. [Google Scholar]


