Abstract
Reciprocating drug delivery is a means of delivering soluble drugs directly to closed fluid spaces in the body via a single cannula without an accompanying fluid volume change. It is ideally suited for drug delivery into small, sensitive and unique fluid spaces such as the cochlea. We characterized the pharmacokinetics of reciprocating drug delivery to the scala tympani within the cochlea by measuring the effects of changes in flow parameters on the distribution of drug throughout the length of the cochlea. Distribution was assessed by monitoring the effects of DNQX, a reversible glutamate receptor blocker, delivered directly to the inner ear of guinea pigs using reciprocating flow profiles. We then modeled the effects of those parameters on distribution using both an iterative curve-fitting approach and a computational fluid dynamic model. Our findings are consistent with the hypothesis that reciprocating delivery distributes the drug into a volume in the base of the cochlea, and suggest that the primary determinant of distribution throughout more distal regions of the cochlea is diffusion. Increases in flow rate distributed the drug into a larger volume that extended more apically. Over short time courses (less than 2 h), the apical extension, though small, significantly enhanced apically directed delivery of drug. Over longer time courses (>5 h) or greater distances (>3 mm), maintenance of drug concentration in the basal scala tympani may prove more advantageous for extending apical delivery than increases in flow rate. These observations demonstrate that this reciprocating technology is capable of providing controlled delivery kinetics to the closed fluid space in the cochlea, and may be suitable for other applications such as localized brain and retinal delivery.
Keywords: Intracochlear, guinea pig, microfluidic, implantable, regeneration, cochlea
Introduction
Reciprocating drug delivery is a means of delivering soluble drugs directly to closed fluid spaces in the body via a single cannula without an accompanying fluid net volume change. In this form of drug delivery, drug-containing solute is delivered, allowed to distribute, and is subsequently withdrawn through a single entry point. This offers several potential advantages over direct infusion for both animal and future human clinical applications. Drug distribution can be better controlled because drug solutions are less likely to flow to unwanted regions. Because there is no net transfer of fluid, issues of fluid accumulation are eliminated. Reciprocating perfusion also offers advantages over perfusion via paired cannulas (one for outflow and one for inflow) [1]. There is a reduced probability of fouling since the cannula is subjected to a pulse of positive pressure with every cycle. The surgery for one input cannula can be simpler, and consequently safer, than that for and input and output.
Reciprocating drug delivery to the cochlea provides a unique framework for understanding the potential for similar delivery to other organs or tissues. Tonotopically generated compound action potentials (CAPs) can serve as bioassays at discrete locations along the length of the cochlea to signal the presence of administered drug, thereby providing a real-time mapping of the distribution of compound as a function of distance from the infusion cannula. The molecule DNQX, a hair cell neurotransmitter antagonist that attenuates the CAP, is reversible and has little action on distortion product otoacoustic emissions (DPOAEs) generated primarily by the outer hair cells. Thus the CAP serves as a monitor of distribution of the drug and the DPOAE serves as a control for nonspecific effects of the delivery process itself. The use of such linearly distributed biological assays is a unique advantage in this application, allowing us to model drug distribution along the length of the cochlea without additional intervention. This is an attractive alternative to fluid sampling during delivery for the purpose of measuring concentration, a process that is challenging in any small fluid space such as the cochlea. Surgical intervention during sampling increases the potential for trauma, leading to hearing threshold increases, and the concentration is sensitive to sampling-associated changes in the small fluid volumes.
The focus of this paper is to analyze the effects of various reciprocating flow regimes on drug delivery kinetics. We characterized the effects of varying flow parameters on the efficiency and safety of drug delivery throughout the length of the cochlea. We then modeled the effects of those parameters on distribution using both an iterative curve-fitting approach and a computational fluid dynamic model. Our findings are consistent with the hypothesis that reciprocating delivery distributes the drug into a volume in the base of the cochlea, and suggest that the primary determinant of distribution throughout the rest of the cochlea is diffusion. Increases in flow rate distributed the drug into a larger volume that extended more apically. Over short time courses (less than 2 h), the apical extension, though small, significantly enhanced apical delivery of drug. Over longer time courses (>5 h) or greater distances (>3 mm), maintenance of drug concentration in the basal scala tympani may prove more advantageous for extending apical delivery than increases in flow rate.
An understanding of the kinetics of delivery to the cochlea gives us insight into uses of this type of delivery in other situations. For example, reciprocating delivery to specific regions of the brain might be advantageous by enabling rapid mixing and diffusion in a confined region without requiring infusion volumes that will ultimately flow to unintended targets. Intraventricular or intrathecal administration can be achieved with high precision and bypass the blood-brain barrier. Reciprocating delivery achieves the goal of maintaining appropriate pressure levels in these structures. Other fluid-filled structures like the eye are also candidates for this delivery paradigm.
The ultimate goal of this work is to develop a fully implantable system for intracochlear drug delivery. One of the challenges in delivering drugs and other agents into the inner ear is that much of the cochlea is relatively inaccessible. Many drugs administered systemically do not achieve therapeutic concentrations in the inner ear due to the presence of a blood-cochlea barrier. Intratympanic approaches such as sustained release biodegradable polymers [2, 3], nanoparticles [4–7], microcatheters [8], ion pumps [9], and osmotic pumps [10, 11] have been demonstrated using in vivo models but do not provide long-term, controlled and precise delivery of compounds to cochlear targets such as hair cells and spiral ganglion neurons. Many compounds are limited by diffusion into the cochlea through the round window membrane. New therapies arising from ongoing research into regeneration of hair cells will require direct administration of drugs to the inner ear. In order to address this need, numerous intracochlear delivery technologies are being developed, including direct injections [12, 13], osmotic pumps [10, 11] and delivery in conjunction with a cochlear prosthesis [14–17]. Many of these various methods have been recently reviewed [18, 19].
The technical approach taken is to develop and utilize successive generations of delivery systems that enable evaluation of the safety and efficiency of delivery in a guinea pig model. The first generation system utilized a recirculating paradigm [20, 21] with a commercially-available piston pump combined with tubing balanced for fluidic resistance and compliance. A second-generation pumping system has been designed that can match the previously documented reciprocating flow profiles profile using significantly simplified fluidic components. In the second-generation system, an actuator impinges on a membrane covered displacement chamber forcing fluid into the ear, and the relaxing membrane withdraws the fluid. For this study, the delivery profiles obtained from the microfabricated system were approximated with syringe pumps; this implementation is described in detail in the Methods section. This mechanism provides information critical to the design of a microfabricated pump and integrated fluidic system. Ultimately, sensors in-line with the flow will provide feedback to the control system that will accommodate changes to the flow profile as necessary to maintain dosing.
Methods
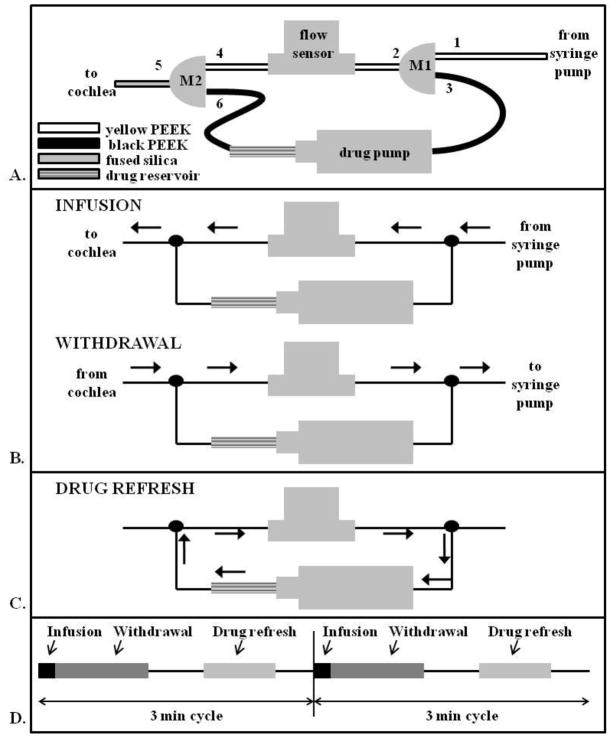
Experiments were conducted in a guinea pig model using a syringe pump delivery system, shown below in Figure 1. This system was configured to mimic the reciprocating flow profile of the micromechanical delivery system currently under fabrication and testing. The delivery profile is identical to that reported previously [22] and similar to that used in past work based on a recirculating delivery paradigm [21]. Briefly, a 1μl volume of fluid is injected into the scala tympani over a period of a few seconds at maximum flow rates ranging from 8.6 to 21μl/min. The same volume is then withdrawn back into the delivery system over the next 1–2 min. This volume of fluid represents approximately 20% of the volume of the guinea pig scala tympani, but it does not cause overpressurization of the space due to local compliant structures. The round window membrane at the base of the scala tympani is a flexible membrane that can bulge into the middle ear, and the patent cochlear aqueduct in the guinea pig can also help to absorb the momentary increased volume.
Figure 1.
A. Schematic of delivery system utilized comprising 2 3-port manifolds, a drug pump, and a flow sensor. Diameters of the PEEK and fused silica tubing are provided in the methods section. The Teflon tubing and syringe pump are located upstream of port 1 and are not shown in this schematic. B. During both the infusion and withdrawal portions of the reciprocating flow cycle, the drug perfusion loop is locked out of the fluid flow pathway by the high resistance black PEEK. C. Once in every reciprocating flow cycle, the fluid lines to the pump and cochlea are effectively blocked and the intervening portion filled with drug from the drug reservoir by activating the drug pump. The high resistance of the cannula in the cochleostomy and fixed volume at the syringe pump block flow in these directions during drug pump activation. D. The cycle of infusion, withdrawal, and drug refresh is repeated every 3 min.
A syringe pump connected through a flow sensor was used to infuse and withdraw the fluid to the cochlea. In a separately controlled loop, the drug was dispensed into the main infusion line by actuating a miniature pump during the rest period of the main loop. The setup is shown in Figure 1A and described in more detail below. Briefly, during an infusion/withdrawal cycle, the fluid flows directly from the syringe pump, through the flow sensor, and into the cochlea. The black tubing in the diagram has a higher fluidic resistance which prevents fluid from diverting through the secondary loop. When the main cycle is in a rest period, the drug pump is actuated to push drug in the main flow line. This ensures that fresh drug is infused in every cycle.
The syringe pump was set up outside of the physiology test chamber to minimize acoustic interference during measurements of hearing. A 3-ml syringe filled with artificial perilymph (AP, composition provided below), a solution that mimics the composition of the fluid (perilymph) present in the scala tympani, was connected to a 2-m length of large-bore Teflon tubing. The Teflon tubing was fed through the wall of the chamber and connected to yellow polyether ether ketone (PEEK) tubing (150 μm ID, Upchurch Scientific) inside a small aluminum box which electrically shielded a flow sensor (Sensirion, Staefa, Switzerland) mounted inside. The flow sensor measured the flow rate within the delivery circuit in real time. Approximately 1.5 ml of artificial perilymph (AP, described below) was pushed through the tubing to fill it and flush any air bubbles. Throughout the filling procedure, extra care was taken to inspect and remove any air in the system. The Teflon tubing was connected to yellow PEEK tubing at the entrance to the box, just upstream of port 1 of the custom-made 3-way manifold (M1 in Figure 1A), machined from sheets of polyimide. Port 2 of M1 consisted of yellow PEEK tubing as well, and port 3 of M1 consisted of higher resistance black PEEK tubing (75 μm ID, Upchurch Scientific). Port 2 was connected to the flow sensor. At this point, additional AP was flushed through the system. The flow sensor was connected to yellow PEEK at port 4 of a second custom 3-way manifold (M2). Port 5 of M2 consisted of 7 cm of fused silica (75 μm ID, 150 μm OD, Polymicro). The fused silica exited the isolation box and was later implanted into the scala tympani. In order to prime the system, more AP was flushed through the system. Port 3 of M1 was connected to the inlet side of a commercially available miniature pump (Wilson Greatbatch, Clarence, NY) (drug pump) that was previously primed with AP. The outlet of the drug pump was connected through a drug reservoir to black PEEK at port 6 of M2. For initial flow testing, the drug reservoir consisted of a short piece of yellow PEEK filled with AP which was later replaced with a modified glass syringe (500 μl, 3.26 mm diameter) containing the drug dissolved in AP. The 3-ml syringe was replaced with a 100 μl gas-tight syringe and placed on the syringe pump.
The fused silica was placed in a reservoir of AP. Both pumps were tested, and flow sensor data was monitored to ensure the desired delivery profile. If the profile was not achieved, the system was inspected for leaks and air bubbles and was refilled as necessary.
After testing was complete, a modified 500 μl glass syringe (drug reservoir) containing the drug diluted in AP was placed in-line in the system between the outlet of drug pump and port 6 of M2. The drug pump fluidic circuit allowed drug to be replenished in the infusion line between each cycle.
During an infusion/withdrawal cycle detailed in Figure 1B, the Labview software signaled the syringe pump to infuse 1 μl of AP at the desired flow rate. The fluid pulse traveled through the Teflon tubing, into port 1, out of port 2, into and out of the flow sensor, into port 4, out of port 4, and through the fused silica into the scala tympani. When the syringe pump was signaled to reverse direction, the fluid was withdrawn from the ear through the tubing and back into the syringe. This process was took approximately 1 min. and was repeated every 3 min.
The drug pump introduced the drug solution into the system. The flow path is shown in Figure 1C. During the 1–2 min. rest period of the syringe pump cycle, the drug pump was pulsed 3–5 times to push drug out of the drug loop through port 6, port 4, the flow sensor, and port 2 which was in the direct flow of the syringe pump circuit. Waste exited through port 3 and into the return side of the drug pump. Approximately 1.5 μl of drug was pushed through the circuit to ensure fresh drug was pushed into the scala tympani on each infuse/withdrawal cycle. This process was repeated at 3 min. intervals to refresh the drug in the line (Figure 1D).
The syringe pump was controlled by a custom-built Labview program that also continuously collected the flow sensor data. The drug pump was controlled by a purpose-designed controller and timer configuration.
Animal surgery, stimulus generation, and response monitoring were previously reported [21]. Details may be found in the supplemental materials. All experiments were conducted with 1 μl volume of fluid infused and withdrawn from the ear. Three maximum infusion flow rates were tested: 8.6, 13, and 21 μl/min. The withdrawal flow rate was maintained at 0.5–1 μl/min. All procedures were conducted with the approval of the Animal Care and Use Committee of the Massachusetts Eye and Ear Infirmary.
Results
Increasing reciprocating flow rates increased drug delivery distances apically along the length of the cochlea
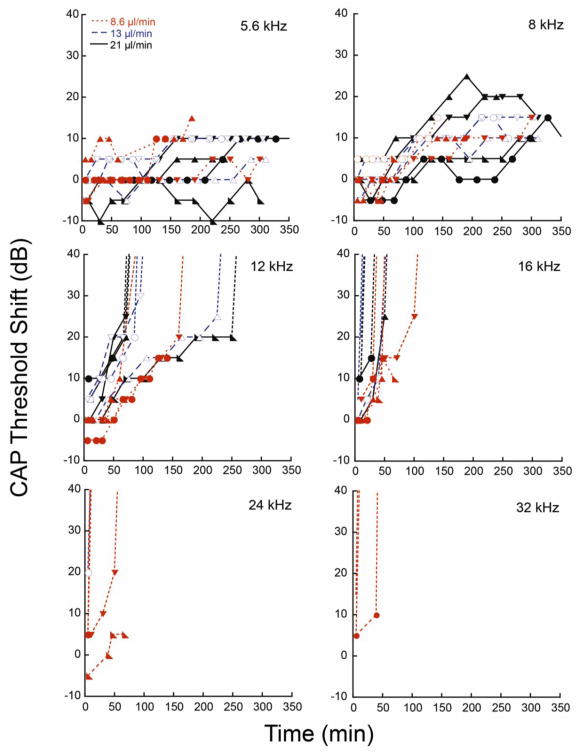
We examined the effects on the CAP of DNQX delivered at inflow rates of 8.6, 13, and 21μl/min. Flow profiles for these 3 outflow rates are shown in Figure 2. DNQX, a glutamate receptor antagonist, blocks excitation of the auditory nerve fibers to suppress the CAP thresholds without affecting the DPOAEs. Suppression of the CAP manifests as an increased threshold, though once threshold shifts exceeded 30 to 40 dB, they rapidly elevated and were no longer accurately quantifiable. The cannula was implanted near the base of the cochlea, between the 24 and 32 kHz regions (0.18 cm from the base of the cochlea). DNQX was delivered for up to 300min, and CAP thresholds were monitored at CFs ranging from 5.6 to 32 kHz. DNQX elevated CAP thresholds, and higher flow rates produced larger effects at earlier times (Figure 3). Thresholds near the cannula were elevated most quickly. Threshold elevations progressed apically with effects apparent at 16 kHz, 12 kHz, and 8 kHz sequentially. But even after 300 min, little to no effect was apparent at the 5.6 kHz location.
Figure 2.
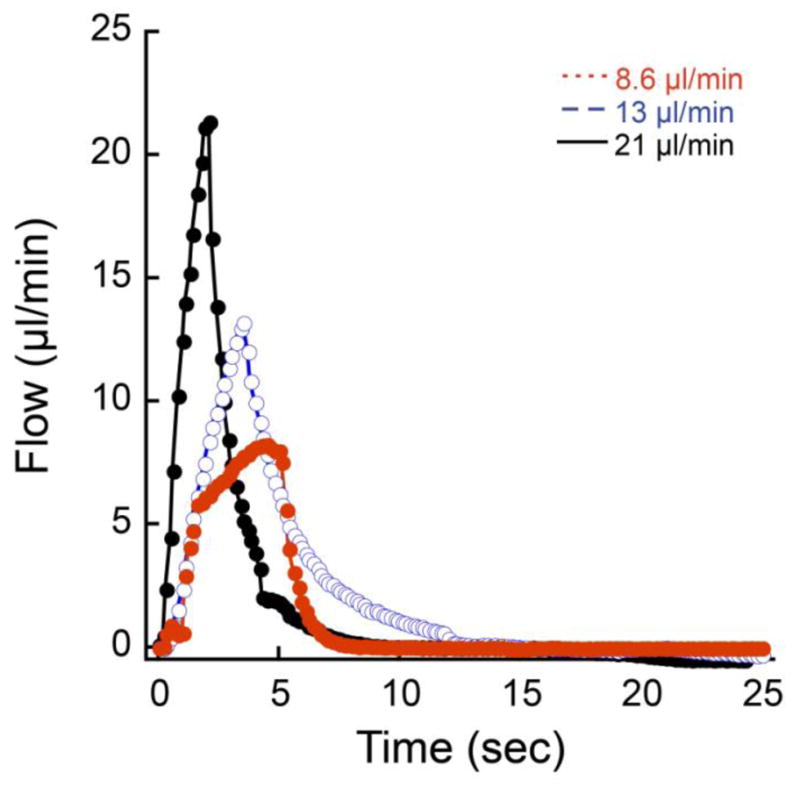
Different outflow rates (8.6, 13, and 21 μl/min) produced different flow profiles as measured at the flow sensor. In all 3 cases, a fixed volume (0.85 μl) was expelled over relatively short periods of the total outflow/inflow cycle. Inflow rates were very low and not obvious on the graph because the inflow portion of the cycle occurred over a period of nearly 2 min.
Figure 3.
CAP threshold shifts due to DNQX delivery are shown at various CFs (5.6, 8, 12, 16, 24, and 36 kHz). The three flow rate profiles (8.6, 13, and 21 μl/min) are compared for each CF. Dotted lines show the trend of the thresholds when the thresholds elevated beyond the measurement range. CFs at 16, 24, and 32 kHz rise too rapidly to access data for analysis, while CFs at 5.6 kHz do not rise appreciably. Data from 8 and 12 kHz were used in further analysis. Data are plotted from 12 animals.
The DNQX-induced CAP threshold shifts are plotted as a function of time for the 3 flow rates in Figure 3. Threshold shifts occurred later with the 8.6μl/min flow rate when compared to 13 and 21μl/min. Thresholds at 16, 24, and 32 kHz reached their peak values too rapidly to be useful for analysis. We restricted analysis to the 8 and 12 kHz regions where the kinetic data was more suitable for modeling. At these locations, more time was required for drug effects, and peak values were reached later, if at all. DPOAEs were monitored as an indicant of non-specific effects of the infusion process since DNQX selectively alters the CAP without altering DPOAEs. At these frequency locations, 8 and 12 kHz, the DPOAEs averaged less than ±5 dB threshold shift over the course of the delivery period, indicating to the effects were due to DNQX rather than by other factors.
Linear curve fits suggest delivery is diffusion dominated
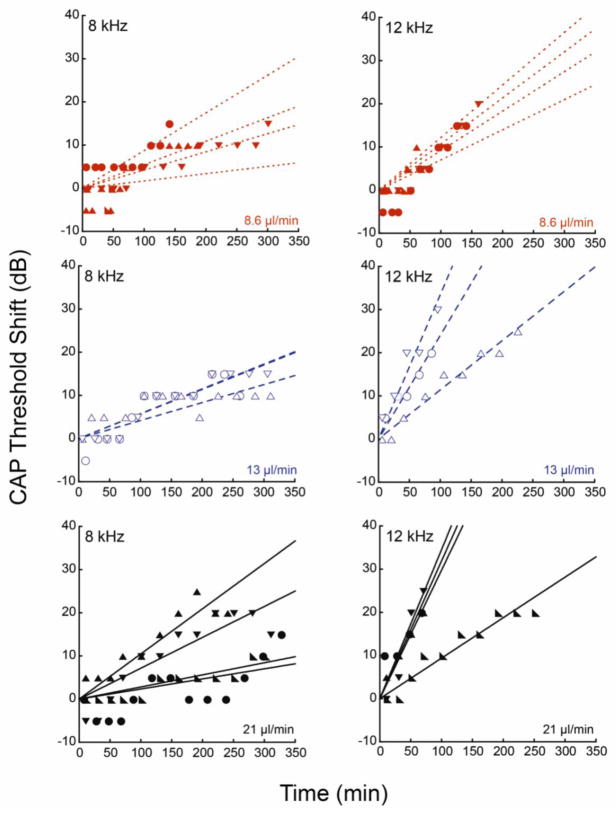
We first performed linear curve fits to the data (Figure 4) to approximate the rate of delivery to various points in the cochlea represented by responses at different CFs. The data for 12 kHz was truncated to remove saturated thresholds where true threshold shifts were not known. 8 and 12 kHz thresholds, shown below, were used for curve fitting and further analysis. Analysis of the slopes showed that increases in flow rate increased the rate of apically directed delivery. Maximum flow rates of 13 and 21 μl/min caused accelerated delivery toward the apex as compared to 8.6 μl/min. At the 12 kHz location, little difference between the two higher flow rates was apparent. ANOVA comparison of the slopes of the three flow rates resulted in p value equal to 0.08, and t-tests of pairs, 21 and 8 μl/min and 13 and 8 μl/min resulted in p=0.03 and 0.07, respectively. Averaging the slopes for the effects of drug at each flow rate at each CF (Figure 5) suggested that, at any given position, increases in flow rate increased the rate of delivery, but that the main determinant of rate of delivery was cochlear position. Since the 12 kHz region was closer to the cochleostomy site than the 8 kHz region, drug effects occurred more rapidly and to a greater extent. This suggested that delivery to more apical regions was dominated by diffusion.
Figure 4.
Linear fits to CAP threshold shifts were generated at 8 and 12 kHz for the three flow profiles. Data from each guinea pig was fitted individually. The solid circles show experimental data, and the dotted lines show the fits. Data are plotted from 12 animals.
Figure 5.
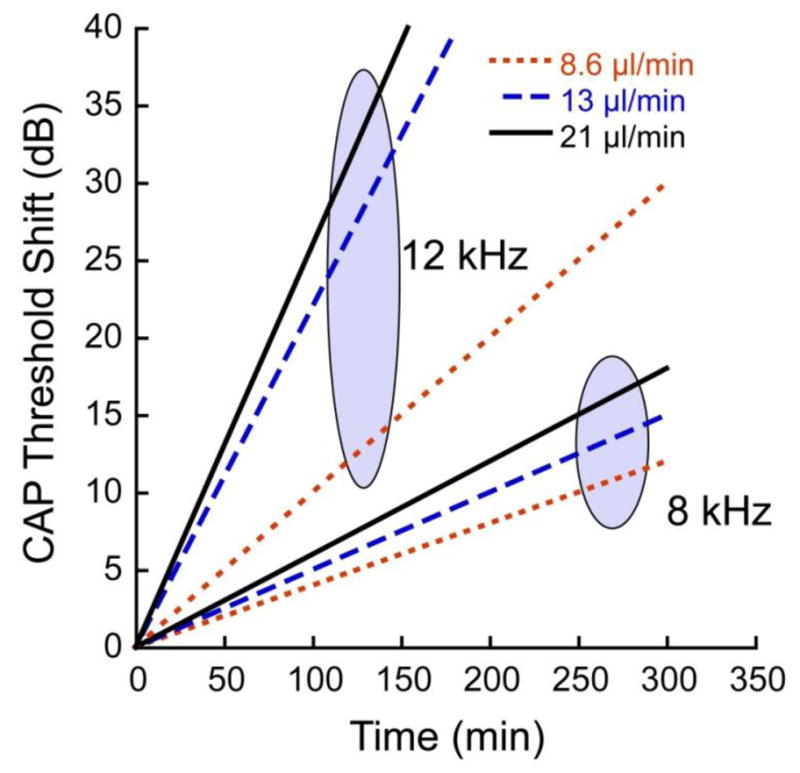
The averages of the fitted linear slopes for threshold shift as a function of time are plotted for each of the flow rates. For each CF region (8 and 12 kHz), the 3 fitted slopes are joined with an oval. In each case DNQX was administered via reciprocating delivery at the flow rates indicated. The infusion cannula was placed 0.18 cm from the base, or approximately 0.23 and 0.32 cm respectively from the 8 and 12 kHz regions. Within each CF region, the rate of threshold shift over time increased with flow rate, but rates were much higher in the 12 kHz region, which was closer (by 1.1 mm) to the infusion pipette than the 8 kHz region.
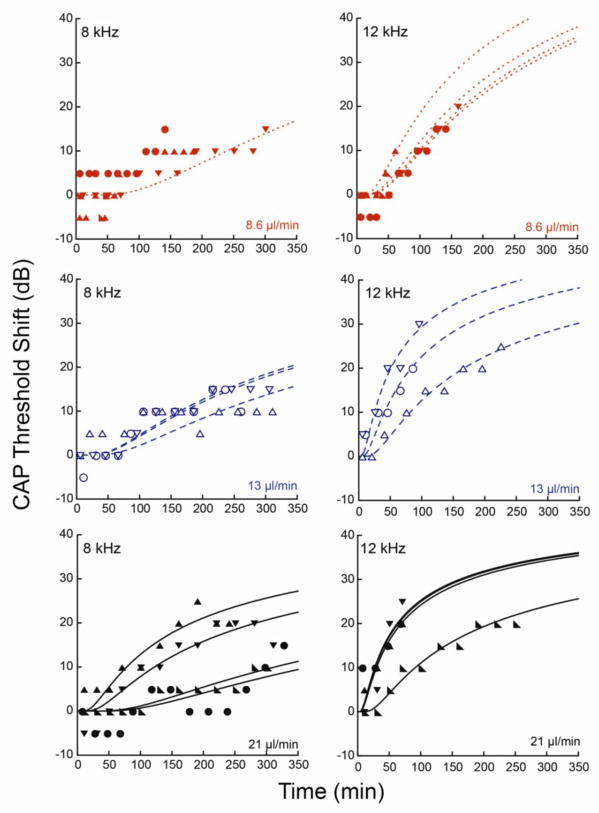
To understand the relative influences of diffusion and flow rate on apical delivery, the experimental data was fit to the solution of the 1-dimensional simple diffusion equation
In this simplified case, reaction and convection terms were neglected. Fick’s second law states: and the 1-D solution is: where c is drug concentration, t is time, x is location, D is diffusivity, and c0 is initial drug concentration. This solution holds when the initial drug concentration c0 is held constant as a boundary condition at the source. For the fit, c and t were obtained from the experimental data. Because the dose-response relationship for DNQX is not known in the cochlea, the experimental hearing threshold shifts could not be directly correlated to DNQX concentration and were used as surrogates for these values. Two fit parameters, c0 and D were utilized. The diffusivity of DNQX was assumed to be smaller than the formula weight would suggest, a presumption based on the fact that the drug was likely bound to perilymph protein, creating a larger molecular unit. While D was a fit parameter for the analysis, it was required to remain constant for all flow rates. C0 was allowed to change dependent on flow rate.
Higher flow rates force the effective insertion point for drug delivery apically
Using the diffusion equation, the software solved for x, which was defined as the effective location of the 8 or 12 kHz region. Using the effective location, an effective insertion point of the fused silica cannula is defined by subtracting x from the actual frequency location. The effective insertion point can be thought of as the point beyond which diffusion dominates apical delivery. It was thought that in a small region near the actual insertion point (0.18 cm from the base of the scala tympani), the complex geometry and flow from the implanted cannula allow for some mixing, which is flow rate dependent. The highest flow rate, 21 μl/min, would cause a greater region of mixing and thus extend the effective insertion point further apically. Beyond this small region, drug transport is dominated by diffusion. The flow rate enhances diffusion by increasing apically the point where diffusion becomes the main contributor to transport. Therefore, x, and thus effective insertion, varies with flow rate, such that higher flow rates cause more mixing and, thus, a more apical effective insertion point. A further constraint on the fit when solutions to the 8 and 12 kHz data were analyzed was that values for x must conform to the known distance between the two frequency locations (0.11 cm) for all flow rates.
Using the diffusion equation as the fit equation in Kaleidagraph, first c0 was found as the best fit to experimental data based on R value. Then D was altered to achieve the correct 8 to 12 kHz location distance. The value of D that generated the correct distance was 2.0 × 10⁻⁶ cm2/sec. This is lower than the predicted (based on molecular weight) diffusion coefficient of DNQX, which is 9.4 × 10⁻⁶ cm2/sec. Changes to D did not alter the overall shape of the curve. The analysis is shown in Figure 6. The values for c0 and x for each flow rate are summarized below in Table 1. ANOVA comparison of x for the three flow rates at 12 kHz resulted in p=0.007 showing strong statistical significance in the difference between flow rates.
Figure 6.
Analysis of diffusion equation fits to CAP threshold shifts at 8 and 12 kHz for three flow profiles. The experimental data are indicated with symbols, and the dashed lines show the fits. Each panel includes data from 3 to 5 guinea pigs with best fits for each guinea pig infusion (dashed lines). The top left panel shows data from 8 kHz at 8.6 μL/min. The low threshold shifts relative to the precision of our measurements precluded individual fits so we fit one curve to all of the data. Cannula placement relative to the 8 kHz and 12 kHz regions is as described in the legend for Figure 5.
Table 1.
Fit parameters for diffusion equation fits for three flow rates. The x values were used to determine the effective insertion locations for each flow rate and to illustrate the effect of changing flow rates on apical delivery.
| Flow rate (μl/min) | 21 | 13 | 8.6 |
| c0 (dB) | 50 | 60 | 90 |
| D (cm2/sec) | 2.0 × 10⁻⁶ | 2.0 × 10⁻⁶ | 2.0 × 10⁻⁶ |
| x for 12 kHz (cm) | 0.09 | 0.10 | 0.17 |
| x for 8 kHz (cm) | 0.2 | 0.2 | 0.27 |
| 8–12 kHz distance (cm) | 0.11 | 0.1 | 0.1 |
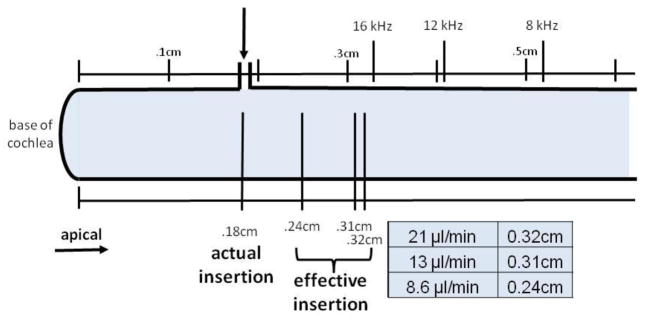
| Effective insertion location (cm) | 0.32 | 0.31 | 0.24 |
Flow rate is the dominant determinant near the inflow cannula while diffusion dominates away from the cannula
Diagrammed below in Figure 7, effective insertion locations were calculated from the known values [23] for 12 kHz (0.41 cm from base) and 8 kHz (0.52 cm from base), and x was subtracted to define the insertion location. Relative to the surgical insertion location, the two higher flow rates advanced the effective insertion point 0.13–0.14 cm apically. The 8.6 μl/min flow rate advanced the effective insertion point by a smaller amount (0.07 cm), as expected. While a relatively large difference in effective insertion points is seen between 8.6 μl/min and the higher two, little difference is apparent between 13 and 21 μl/min values.
Figure 7.
Schematic of the basal turn of the cochlea with the base to the left. The CF locations and actual insertion point are marked. The effective insertion points, as calculated using iterative fits for the diffusion equation, for each flow rate are shown relative to known CF locations. The effective insertion points for inflow rates of 13 and 21 μl/min were calculated to be near the 16 kHz location while that for the 8.6 μl/min inflow rate was calculated to be near the 24 kHz region.
The diffusion equation fit to the data suggests that increases in flow rate provide a larger effective mixing area and more apical effective drug insertion point. Mixing at the cannula insertion region advanced the effective insertion point to the 16 kHz region. Threshold shifts would be expected to occur rapidly at this location. As shown in Figure 3, thresholds saturated almost immediately at 16 kHz. Therefore, the effective insertion point finding agrees with the experimental result.
Fluid dynamic modeling incorporating drug/protein binding explains the apparent attenuation of the diffusion coefficient
The above analysis is based upon several assumptions that are consistent with the expected kinetic behavior of the delivery system, including the existence of a mixing region and effective insertion point, the dependence of the effective insertion point on flow rate, and an apparent attenuation of the diffusion coefficient of the drug, which we have assumed to be due to the presence of protein binding sites in the perilymph (though we cannot presently rule out other factors, such as tissue uptake or degradation of the drug). We conducted binding studies between DNQX and one of the principal protein components of the perilymph, albumin [24], using an LC/MS/MS analytical system (Apredica Inc., Watertown MA.) These studies utilized an equilibrium dialysis procedure [25] to generate supernatant comprising bound albumin-DNQX complexes, and binding rates are compared with known standards including warfarin and ranitidine. Albumin at a concentration of 20 μM, estimated from Ref. 24, was mixed with DNQX at a concentration of 20 μM, in order to perform the binding study. This DNQX concentration is much lower than used in our intracochlear infusion studies, but was used as a reference because of detection-related limitations in the LC/MS/MS instrument. For these conditions, a 4 hour exposure resulted in a bound fraction of DNQX of 11%, a relatively important level considering the reduced DNQX concentration (20 μM vs 300 μM) and the fact that albumin is only one of several proteins present in the perilymph. While this bound fraction is low relative to a warfarin-albumin control (49% after 4 hours), it does represent a significant loss mechanism and must be considered in our model.
In order to pursue this last point more fully, we have begun developing a more complex fluid dynamic model capable of solving the diffusion equation to account for the presence of binding sites in the fluid volume of the cochlea. This computational approach enables modeling of drug transport in the presence of binding events between the mobile drug molecule and stationary protein binding sites within the perilymph, as well as dissociation of these immobile bound complexes that reintroduces mobile drug molecules and active binding sites back into solution. For this approach, the diffusion coefficient of the drug species is no longer treated as a free parameter but is fixed at the expected value based on its molecular weight (http://oto2.wustl.edu/cochlea/). Fitting parameters include the binding constant for drug-protein binding, as well as the dissociation constant for these bound complexes. For simplicity, initial analysis using this computational model has been focused solely on probing the penetration distance of the drug as a function of the diffusion and in the presence or absence of binding and dissociation. Future analysis will incorporate known properties of the protein complexes in perilymph [24] as a basis for modeling the binding and dissociation and its influence on drug distribution along the length of the cochlea.
Computational modeling of the drug binding process is based upon the assumption that mobile drug diffuses according to its normal diffusion coefficient until a binding event occurs with an immobile protein binding site. While the apparent reduction in diffusion coefficient may be the result of binding events leading to slower motion of the DNQX-protein complexes in the fluid, our computational model suggests a more likely mechanism is the fact that some of the mobile drug will be lost to binding events that essentially fix the drug location, leaving only unbound drug to diffuse at its expected diffusion coefficient. It is this latter mechanism that we incorporated into a computational fluid dynamic model solved using MATLAB (MathWorks, Natick MA) partial differential equation solver software.
The governing equation for the diffusion-reaction equation for drug distribution and binding is as follows: where u is the concentration of drug, t is time, x is the distance from the actual insertion point, kb is the rate constant for drug-protein binding, v is the concentration of binding sites, kd is the rate constant for drug-binding site dissociation, and w is the concentration of bound, immobile drug-binding site complexes. This equation has been solved using the PDEPE module in MATLAB, with the simplified case where the dissociation term is neglected and the concentration of binding sites is assumed to be large relative to the concentration of the drug. The diffusion coefficient D has been fixed at the level of DNQX of 9.4 × 10⁻⁶ cm2/sec (http://oto2.wustl.edu/cochlea/) expected based on the molecular weight of DNQX. The rate constant for drug-protein binding has been treated as a free parameter in fitting the data.
Using the above assumptions, the PDEPE solver has been used to generate kinetic curves for DNQX transport as a function of the binding constant. Figure 8 illustrates the effect of drug binding and dissociation on the concentration of drug as a function of distance from the injection site. For comparison, we show the distribution based on the implied diffusion coefficient (2.0 × 10⁻⁶ cm2/sec) determined from the fits of the diffusion equation described above (Table 1). The cases illustrated in Figure 8 are diffusion without any protein binding (Figure 8A), diffusion with drug binding to protein but not dissociating (Figure 8B), and diffusion with drug binding to and dissociating from protein (Figure 8C). In Figure 8A, the complementary error function profile for drug diffusion using the standard diffusion coefficient (open circles) is compared with the concentration profile obtained using the implied diffusion coefficient (solid line) invoked in a previous section (D = 2.0 × 10⁻⁶ cm2/sec). As presented in that analysis, reduction of the diffusion coefficient is necessary to explain limited penetration of the drug during infusion experiments. In Figure 8B, the concentration profile obtained with a reduced diffusion coefficient (solid line) is reproduced by incorporating a drug binding term with diffusion at the normal rate (open circles). In this case kb is found to be 7.8 × 101/(mol sec). In Figure 8C, the concentration profile with a reduced diffusion coefficient (solid line) is again replicated by modeling diffusion at the normal rate with both binding and dissociation terms. In this case, kb is higher (7.8 × 10²/(mol sec), as expected, and the dissociation constant (kd) is set at 2.4 × 10⁻²/sec. This latter scenario is likely the most realistic, where DNQX diffuses at the normal rate but undergoes binding and unbinding events as it moves up the cochlea. kb and kd were fit parameters based on related values.
Figure 8.
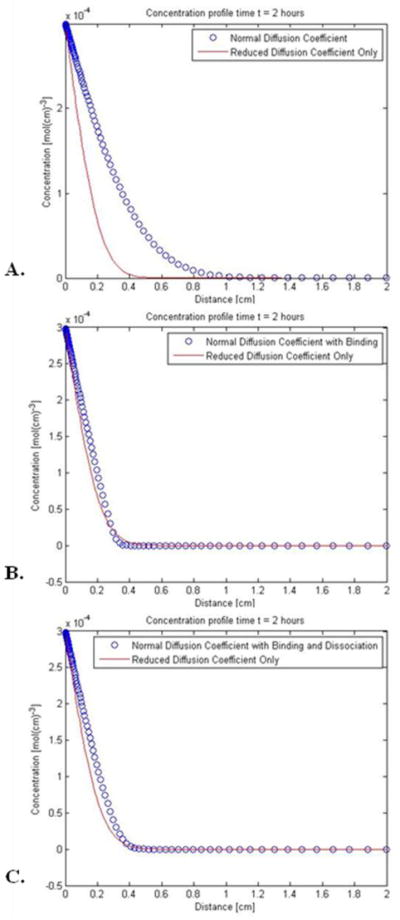
Kinetic model for DNQX diffusion in the presence or absence of binding and dissociation with proteins in the perilymph. A. Comparison of concentration profiles obtained with DNQX diffusing at the rate (9.4 × 10⁻⁶ cm2/sec, open circles) predicted by its diffusion coefficient versus the rate based on the implied diffusion coefficient (2 × 10⁻⁶ cm2/sec, solid line) invoked in the modeling of auditory data in a previous section. B. Alternative scenario to the previous panel, where DNQX diffuses normally but binds with proteins in the perilymph at a rate constant of 7.8 × 101/(mol sec). The diffusion with binding profile is shown with open circles and closely mimics the profile predicted for a reduced diffusion coefficient only (solid line). C. A second alternative scenario, where DNQX diffuses normally and undergoes binding and dissociation with proteins; this data is shown with open circles and again closely mimics the profile predicted for a reduced diffusion coefficient only (solid line.) Here kb is found to be 7.8 × 10²/(mol sec), and kd is 2.4 × 10⁻²/sec.
DISCUSSION
The drug delivery kinetics and computational model for reciprocating microfluidic delivery presented here provide a picture of the mechanism for distribution as a diffusion-dominated process with mixing of the injectate and attenuation of the drug penetration as a result of drug binding to protein complexes within the cochlear fluid. Our data are consistent with the paradigm that reciprocating delivery deposits dissolved drug into a limited region near the site of delivery. Increases in flow rate during reciprocating delivery increased the mixing volume. Thus flow rate provides a means of controlling the spatial distribution of the injectate. Beyond this region of local deposition, diffusion was the primary driver of drug dispersion apically. The rate of diffusion was dominated by the diffusion coefficient of the drug and was attenuated by drug binding to protein in the perilymph.
Our initial results are based primarily from iteratively fitting our data with a one-dimensional mathematical model based on the diffusion equation. More complex models enable additional effects related to binding and dissociation of drug molecules with proteins present in the perilymph to be incorporated. In all of our analyses, the test frequencies with which we monitored drug effects served as a surrogate for distance from the injection site, and the elevation of response threshold induced by the drug at different test frequencies was a surrogate for drug concentration at different distances from the injection site. The existence of these surrogates for distance and concentration provide a convenient means to utilize acute drug infusion studies in the guinea pig cochlea to establish a pharmacokinetic model for drug delivery to the inner ear. This approach will provide a platform for future studies to predict the diffusion and binding of regenerative compounds for inner ear therapy.
The well-known tonotopic spatial arrangement within mammals of various frequencies within the cochlea [26] enables precise mapping of the concentration profile of DNQX as a function of distance from the infusion site. High correlation (R=0.986) to the frequency-location relation for the guinea pig was found when many published measures were compared [23]. The precise map determining that the 8 and 12 kHz regions are 1.1 mm in the guinea pig cochlea [23] apart enables the use of this distance as a requirement in the fitting of the data. This requirement could only be met if the distance of each of each frequency point from the effective injection site became shorter as the flow rate was increased. This led to the conclusion that higher reciprocating flow rates caused the drug to be distributed into larger volumes, which in turn reduced the distance the drug needed to diffuse from the injection site to reach the 8 and 12 kHz sites. This reduction in diffusion distance from the injection site is consistent with the existence of an effective insertion point that moves apically down the cochlea as the flow rate is increased. Best fits using the simple 1-D model were obtained when the diffusivity was lower than that expected from the diffusion coefficient of DNQX alone. Initial analysis using a more complex computational model confirmed our assumption that protein binding in the perilymph may play an important role in the diffusivity. Further development of the computational fluid model is expected to address this added complexity and to continue to refine our understanding.
The general concepts governing reciprocating delivery that we have deduced are relatively robust, though there are a number of limitations of our current analysis that may affect the precision of our predicted drug distributions. These limitations include unknown values for protein and tissue binding rates with the drug, neglect of the rate of clearance of DNQX (or the mechanism by which it occurs), and neglect of the magnitude of loss of drug through the cochlear aqueduct, which is patent in guinea pigs.
A general limitation of this approach is the use of threshold elevation as a surrogate for concentration. This assumption is flawed because the threshold shift with DNQX eventually saturates as the concentration rises. In addition, dose-response data for DNQX in the cochlea is not well understood, although it is known that most of the observable threshold shift occurs between 100 and 300 μM [27]. For simplicity, our model assumes a linear relationship between threshold shift (in dB) and drug concentration; this assumption is not critical because across the limited range of threshold shifts observed in these experiments, assuming a logarithmic relation makes little difference.
The use of DNQX to induce threshold shifts allows the use of a bioresponse as a surrogate for a chemical assay. With the knowledge of the CF locations, progress of the drug apically can be monitored without the need of sampling or other measurement techniques. The tubular configuration of the cochlea provides a simpler geometry to monitor and model delivery as the drug transits along the length. The model being developed for this system could be generalized to extend our understanding of reciprocating drug delivery in other systems. This delivery paradigm will likely be useful in other systems including delivery to the CSF, eye, and other fluid-filled spaces, particularly those that are sensitive to small volume and pressure changes.
Experiments conducted over longer time periods will enable a more realistic assessment of drug distribution at distances extending further apically down the length of the cochlea. Apical delivery in a guinea pig to a distance of 16 mm (the length of the scala tympani) [28] from the cannula insertion would take about 30 hours for DNQX diffusing at its normal rate without consideration of binding. This penetration depth is defined by the point at which the DNQX concentration is at 25% of the value at the source. By this definition, DNQX would take 70 hours to reach the apex in the presence of binding and dissociation, assuming rate constants obtained from the fitting in Figure 8C. Clearly the role of protein binding and dissociation will need to be incorporated in future models of microfluidic drug delivery to provide realistic assessments of drug penetration over longer time courses.
Supplementary Material
Acknowledgments
The project described was supported by Award Number R01DC006848 from the National Institute on Deafness and Other Communication Disorders. The content is solely the responsibility of the authors and does not necessarily represent the official view of the National Institute on Deafness and other Communication Disorders or the National Institutes of Health.
Footnotes
Publisher's Disclaimer: This is a PDF file of an unedited manuscript that has been accepted for publication. As a service to our customers we are providing this early version of the manuscript. The manuscript will undergo copyediting, typesetting, and review of the resulting proof before it is published in its final citable form. Please note that during the production process errors may be discovered which could affect the content, and all legal disclaimers that apply to the journal pertain.
References
- 1.Bakken E, Heruth K. Temporal control of drugs. Ann N Y Acad Sci. 1991;618:422–427. [Google Scholar]
- 2.Arnold W, Senn P, Hennig M, Michaelis C, Deingruber K, Scheler R, Steinhoff HJ, Riphagen F, Lamm K. Novel slow- and fast-type drug release round-window microimplants for local drug application to the cochlea: an experimental study in guinea pigs. Audiol Neurootol. 2005;10:53–63. doi: 10.1159/000082575. [DOI] [PubMed] [Google Scholar]
- 3.Endo T, Nakagawa T, Kita T, Iguchi F, Kim TS, Tamura T, Iwai K, Tabata Y, Ito J. Novel strategy for treatment of inner ears using a biodegradable gel. Laryngoscope. 2005;115:2016–2020. doi: 10.1097/01.mlg.0000183020.32435.59. [DOI] [PubMed] [Google Scholar]
- 4.Tamura T, Kita T, Nakagawa T, Endo T, Kim TS, Ishihara T, Mizushima Y, Higaki M, Ito J. Drug delivery to the cochlea using PLGA nanoparticles. Laryngoscope. 2005;115:2000–2005. doi: 10.1097/01.mlg.0000180174.81036.5a. [DOI] [PubMed] [Google Scholar]
- 5.Praetorius M, Brunner C, Lehnert B, Klingmann C, Schmidt H, Staecker H, Schick B. Transsynaptic delivery of nanoparticles to the central auditory nervous system. Acta Otolaryngol. 2007;127(5):486–490. doi: 10.1080/00016480600895102. [DOI] [PubMed] [Google Scholar]
- 6.Ge X, Jackson RL, Liu J, Harper EA, Hoffer ME, Wassel RA, Dormer KJ, Kopke RD, Balough BJ. Distribution of PLGA nanoparticles in chinchilla cochleae. Otolaryngol Head Neck Surg. 2007;137:619–623. doi: 10.1016/j.otohns.2007.04.013. [DOI] [PubMed] [Google Scholar]
- 7.Gao X, Wang Y, Chen K, Grady BP, Dormer KJ, Kopke RD. Magnetic assisted transport of PLGA nanoparticles through a human round window membrane model. J Nanotechnol Eng Med. 2010;1 [Google Scholar]
- 8.Silverstein H. Use of a new device, the MicroWick, to deliver medication to the inner ear. Ear Nose Throat J. 1999;78(8):595–600. [PubMed] [Google Scholar]
- 9.Simon DT, Kurup S, Larsson KC, Hori R, Tybrandt K, Goiny M, Jager EWH, Berggren M, Canlon B, Richter-Dahlfors A. Organic electronics for precise delivery of neurotransmitters to modulate mammalian sensory function. Nature Materials. 2009;8:742–746. doi: 10.1038/nmat2494. [DOI] [PubMed] [Google Scholar]
- 10.Chen Z, Mikulec AA, McKenna MJ, Sewell WF, Kujawa SG. A method for intracochlear drug delivery in the mouse. J Neurosci Methods. 2006;150:67–73. doi: 10.1016/j.jneumeth.2005.05.017. [DOI] [PubMed] [Google Scholar]
- 11.Prieskorn DM, Miller JM. Technical report: chronic and acute intracochlear infusion in rodents. Hear Res. 2000;140:212–215. doi: 10.1016/s0378-5955(99)00193-8. [DOI] [PubMed] [Google Scholar]
- 12.Oestreicher E, Arnold W, Ehrenberger K, Felix D. New approaches for inner ear therapy with glutamate receptors. Acta Otolaryngol. 1999;119:174–178. doi: 10.1080/00016489950181611. [DOI] [PubMed] [Google Scholar]
- 13.Stover T, Yagi M, Raphael Y. Cochlear gene transfer: round window versus cochleostomy inoculation. Hear Res. 1999;136:124–130. doi: 10.1016/s0378-5955(99)00115-x. [DOI] [PubMed] [Google Scholar]
- 14.Pettingill LN, Richardson RT, Wise AK, O’Leary S, Shepherd RK. Neurotrophic factors and neural prostheses: potential clinical applications based uon findings in the auditory system. IEEE Trans Biomed Eng. 2007;54(6):1–5. doi: 10.1109/TBME.2007.895375. [DOI] [PMC free article] [PubMed] [Google Scholar]
- 15.Garnham C, Reetz G, Jolly C, Miller J, Salt A, Beal F. Drug delivery to the cochlea after implantation: consideration of the risk factors. Cochlear Implants Int. 2006;6(S1):12–14. doi: 10.1179/cim.2005.6.Supplement-1.12. [DOI] [PubMed] [Google Scholar]
- 16.Staecker H, Jolly C, Garnham C. Cochlear implantation: an opportunity for drug development. Drug Discov Today. 2010;15(7/8):314–321. doi: 10.1016/j.drudis.2010.02.005. [DOI] [PubMed] [Google Scholar]
- 17.Richardson RT, Wise AK, Thompson BC, Flynn BO, Atkinson PJ, Fretwell NJ, fallon JB, Wallace GG, Shepherd RK, Clark GM, O’Leary SJ. Polypyrrole-coated electrodes for the delivery of charge and neurotrophins to cochlear neurons. Biomaterials. 2009;30:2614–2624. doi: 10.1016/j.biomaterials.2009.01.015. [DOI] [PMC free article] [PubMed] [Google Scholar]
- 18.Swan EEL, Mescher MJ, Sewell WF, Tao SL, Borenstein JT. Inner ear drug delivery for auditory applications. Adv Drug Del Rev. 2008;60:1583–1599. doi: 10.1016/j.addr.2008.08.001. [DOI] [PMC free article] [PubMed] [Google Scholar]
- 19.Borkholder DA. State-of-the-art mechanisms of intracochlear drug delivery. Curr Opin Otolaryngol Head Neck Surg. 2008;16:472–477. doi: 10.1097/MOO.0b013e32830e20db. [DOI] [PMC free article] [PubMed] [Google Scholar]
- 20.Fiering J, Mescher MJ, Swan EEL, Holmboe ME, Murphy BA, Chen Z, Peppi M, Sewell WF, McKenna MJ, Kujawa SG, Borenstein JT. Local drug delivery with a self-contained, programmable, microfluidic system. Biomedical Microdevices. 2009;11(3):571–578. doi: 10.1007/s10544-008-9265-5. [DOI] [PMC free article] [PubMed] [Google Scholar]
- 21.Chen Z, Kujawa SG, McKenna MJ, Fiering JO, Mescher MJ, Borenstein JT, Swan EEL, Sewell WF. Inner Ear drug delivery via a reciprocating perfusion system in the guinea pig. J Control Release. 2005;110:1–19. doi: 10.1016/j.jconrel.2005.09.003. [DOI] [PMC free article] [PubMed] [Google Scholar]
- 22.Sewell WF, Borenstein JT, Chen Z, Fiering J, Handzel O, Holmboe M, Kim E, Kujawa SG, McKenna MJ, Mescher MJ, Murphy BA, Swan EEL, Peppi M, Tao SL. Development of a microfluidics-based intracochlear drug delivery device. Audiol Neurootol. 2009;14:411–422. doi: 10.1159/000241898. [DOI] [PMC free article] [PubMed] [Google Scholar]
- 23.Tsuji J, Liberman MC. Intracellular labeling of auditory nerve fibers in guinea pig: central and peripheral projections. The J of Comparative Neurology. 1997;381:188–202. [PubMed] [Google Scholar]
- 24.Swan EEL, Peppi M, Chen Z, Green KM, Evans JE, McKenna MJ, Mescher MJ, Kujawa SG, Sewell WF. Proteomics analysis of perilymph and cerebrospinal fluid in mouse. The Laryngoscope. 2009;119:953–958. doi: 10.1002/lary.20209. [DOI] [PMC free article] [PubMed] [Google Scholar]
- 25.Banker MJ, Clark TH, Williams JA. Development and validation of a 96-well equilibrium dialysis apparatus for measuring plasma protein binding. J Pharm Sci. 2003;92(5):967–974. doi: 10.1002/jps.10332. [DOI] [PubMed] [Google Scholar]
- 26.Greenwood D. Comparing octaves, frequency ranges, and cochlear-map curvature across species. Hear Res. 1996;94(1–2):157–162. doi: 10.1016/0378-5955(95)00229-4. [DOI] [PubMed] [Google Scholar]
- 27.Littman T, Bobbin RP, Fallon M, Puel JL. The quinoxalinediones DNQX, CNQX and two related congeners supress hair cell-to-auditory nerve transmission. Hear Res. 1989;40(1–2):45–53. doi: 10.1016/0378-5955(89)90098-1. [DOI] [PubMed] [Google Scholar]
- 28.Thorne M, Salt AN, DeMott JE, Henson MM, Henson OWJ, Gewalt SL. Cochlear fluid space dimensions for six species derived from reconstructions of three-dimensional magnetic resonance images. The Laryngoscope. 1999;109:1661–1668. doi: 10.1097/00005537-199910000-00021. [DOI] [PubMed] [Google Scholar]
Associated Data
This section collects any data citations, data availability statements, or supplementary materials included in this article.


