

Abstract
Diffusion tensor imaging (DTI) enables noninvasive parcellation of cerebral white matter into its component fiber bundles or tracts. These tracts often subserve specific functions, and damage to the tracts can therefore result in characteristic forms of disability. Attempts to quantify the extent of tract-specific damage have been limited in part by substantial spatial variation of imaging properties from one end of a tract to the other, variation that can be compounded by the effects of disease. Here, we develop a “penalized functional regression” procedure to analyze spatially normalized tract profiles, which powerfully characterize such spatial variation. The central idea is to identify and emphasize portions of a tract that are more relevant to a clinical outcome score, such as case status or degree of disability. The procedure also yields a “tract abnormality score” for each tract and MRI index studied. Importantly, the weighting function used in this procedure is constrained to be smooth, and the statistical associations are estimated using generalized linear models. We test the method on data from a cross-sectional MRI and functional study of 115 multiple-sclerosis cases and 42 healthy volunteers, considering a range of quantitative MRI indices, white-matter tracts, and clinical outcome scores, and using training and testing sets to validate the results. We show that attention to spatial variation yields up to 15% (mean across all tracts and MRI indices: 6.4%) improvement in the ability to discriminate multiple sclerosis cases from healthy volunteers. Our results confirm that comprehensive analysis of white-matter tract-specific imaging data improves with knowledge and characterization of the normal spatial variation.
Keywords: multiple sclerosis, diffusion tensor imaging, magnetization transfer ratio, regression methods, functional data analysis
1. Introduction
DTI, a form of MRI that is sensitive to the microscopic diffusion of water molecules, can resolve white-matter tracts in the central nervous system and is sensitive to disruption of tissue microstructure. This technique therefore makes it possible to investigate noninvasively the relationship between brain-structure abnormalities and disability in various diseases (Ciccarelli et al., 2008). Such investigations have revealed correlations between imaging abnormalities in specific tracts and impairment related to the functions of those tracts. For example, in MS, abnormally rapid diffusion of water in the corpus callosum, a major white-matter bundle that connects the two cerebral hemispheres, has been associated with poor performance on complex motor and cognitive tasks (Kern et al., 2010; Lin et al., 2008; Lin et al., 2005; Lowe et al., 2006; Ozturk et al., 2010).
Determining correlations between tract-specific imaging-marker abnormalities and disability is necessary to establish whether such markers can be used to predict prognosis, monitor disease progression, and help guide therapy decision-making. Although it might seem that the well established functional organization of the human central nervous system would seamlessly combine with the sensitivity of MRI to many pathologic processes (including inflammation, edema, demyelination, ischemia, and gliosis) to explain much of the variance in clinical scores, this has not generally been the case. In the largest studies of MS, for example, correlation coefficients relating lesion load to clinical disability scales hover around 0.2 (Barkhof, 2002; Goodin, 2006). Reasons for this disappointing result include the fact that MRI measures are not specific for the tissue damage that causes disability as well as the often high variability in clinical outcome measures.
A popular family of image-processing techniques globally searches for areas of the brain, including not only well-defined gray-matter and white-matter structures but also individual image voxels, that bear statistically significant correlations with the disability scores (Ashburner and Friston, 2000; Smith et al., 2006). These techniques, while computationally powerful and theoretically capable of uncovering interactions between distinct anatomic regions, are not primarily motivated by the wealth of knowledge, accumulated over decades and even centuries, about the functional organization of the brain. Often described as “bias-free,” these techniques may nevertheless make substantial assumptions about the statistical structure of brain images and their variation across populations, and they require advanced registration methods that may not perform as well in the presence of pathology as they do in normal brains.
On the other hand, hypothesis-driven DTI studies of the structure-dysfunction relationship have used MRI data derived from variously placed ROIs drawn in the tracts being studied or from spatial averages across segments of those tracts, where the tracts themselves are isolated by a tractography procedure. Although it is known that MRI indices (derived either from DTI or from other MRI sequences registered to the DTI maps) vary spatially across single tracts (Jones et al., 2005; Lin et al., 2006; Oh et al., 2007; Reich et al., 2007; Stieltjes et al., 2001), that spatial variation – and the differential relationship between disability and abnormalities in different segments of each tract – has received relatively little attention (Goodlett et al., 2009; O'Donnell et al., 2009; Yushkevich et al., 2008).
In this paper, we present results derived from a statistical image-processing method that explicitly accounts, via a weighting technique, for the spatial variation in the imaging properties of white-matter tracts. We address the hypothesis that the observed correlations between MRI indices and disability scores would be improved if this spatial variation were considered. If correct, the specificity of tract-specific MRI for the presence or absence of disease or for different degrees of physical or cognitive disability would be improved. Our method, which we call “penalized functional regression,” weights different portions of each tract according to their importance with respect to outcome measures and constructs a scalar index of abnormality for the entire tract. We consider data from a cross-sectional MRI study of MS and address our hypothesis by regressing the tract abnormality indices against clinical outcome scores.
2. Methods
Our image acquisition and processing protocols have been published previously (Reich et al., 2010), and most of the data used in the current work have previously been reported. This section therefore provides only a few details about these protocols and instead focuses on the PFR methodology.
2.1 Study participants
We recruited study participants with MS from the outpatient neurology clinic and healthy volunteers from the community. All disability scores were measured within 30 days of the MRI scan. Prior to MRI scanning and disability testing, all participants gave signed, informed consent, and all procedures were approved by the institutional review board. Cohort characteristics are summarized in Table 1.
Table 1.
Cohort characteristics. Disability data were obtained within 30 days of the MRI scan.
| all MS | CIS | RRMS | SPMS | PPMS | healthy | |
|---|---|---|---|---|---|---|
| # participants (% women) | 115 (68%) | 4 (75%) | 77 (74%) | 18 (61%) | 16 (44%) | 42 (71%) |
| mean age, years (SD; range) | 43 (11; 20-68) | 30 (9; 22-39) | 39 (10; 20-62) | 52 (8; 29-63) | 52 (7; 39-68) | 34 (10; 22-63) |
| mean disease duration, years (SD; range) | 9 (7; 0-30) | 0 (0; 0-0) | 7 (6; 0-25) | 17 (8; 2-30) | 8 (6; 1-19) | |
| on disease-modifying treatment | 73% | 0% | 89% | 59% | 33% | |
| relapse within 30 days prior to scan | 5% | 50% | 4% | 6% | 0% | |
| median EDSS (range) | 3 (0-6.5) | 1.5 (0-3) | 2 (0-6) | 6 (2-6.5) | 5.25 (2.5-6.5) | |
| mean MSSS (SD) | 4.5 (2.6) | 1.5 (1.7) | 3.8 (2.4) | 5.6 (2.1) | 7.0 (1.7) | |
| mean MSFC (SD) | 0.0 (0.6) | -0.3 (.4) | -0.1 (.4) | 0.3 (.9) | 0.3 (.6) | |
| mean PASAT-3 (SD) | 48 (11) | 44 (12) | 48 (11) | 46 (11) | 47 (13) | |
| mean 9HPT, sec (SD) | 25 (14) | 19 (2) | 23 (12) | 31 (22) | 31 (15) | |
| mean 25FTW, sec (SD) | 5.9 (4.3) | 4.6 (0.3) | 4.7 (1.6) | 8.9 (5.9) | 8.8 (7.7) |
2.2 Disability scores
We obtained several disability score measurements in the MS cohort, each within 30 days of the MRI scan. Disability scores were as follows: EDSS, an ordinal measure of overall disability that is heavily weighted toward motor impairment (Kurtzke, 1983); MSSS, a continuous score from 0 to 10, derived from the EDSS and estimated disease duration (measured as number of years since the first symptoms attributable to MS), where 5 indicates a typical rate of disease progression (Roxburgh et al., 2005); and MSFC, a composite score that includes the PASAT-3, the 9HPT, and the 25FTW (Fischer et al., 1999).
2.3 MRI protocol and image processing
We performed all scans on a 3 tesla scanner (Intera, Philips, Best, the Netherlands) over a 4.6 year period, using the body coil for transmission and either a 6-channel head coil or the 8 head elements of a 16-channel neurovascular coil for reception (both coils are made by Philips). Each session included two sequential DTI scans using a conventional spin-echo sequence and a single-shot EPI readout. We acquired whole-brain data in nominal 2.2 mm isotropic voxels and with the following parameters: TE, 69 ms; TR, automatically calculated (“shortest”); slices, 60 or 70; parallel imaging factor, 2.5; non-collinear diffusion directions, 32 (Philips “overplus high” scheme); high b-value, 700 s/mm2; low b-value (“b0”), approximately 33 s/mm2; repetitions, 2; reconstructed in-plane resolution, 0.82 × 0.82 mm. We also performed a 3D gradient-echo magnetization-transfer sequence with segmented EPI readout (nominal acquired resolution: 1.5 × 1.5 × 2.2 mm; TE: 15 ms; TR: 64 ms; parallel imaging factor: 2; EPI factor: 7; magnetization-transfer pulse: sinc-shaped, 1.5 kHz off-resonance; repetitions: 3), the data from which were rigidly registered to the DTI scan before calculation of MTR maps (defined as 1 minus the voxel-wise ratio of data from this sequence to those obtained using the same sequence without the magnetization-transfer pulse). Prior to analysis, data were adjusted to account for changes in average tract-specific MRI indices that resulted from the scanner upgrades that inevitably occur over the course of a study such as this. The procedure by which this adjustment was made has been previously described (Harrison et al., 2011).
The diffusion-weighted scans were processed using CATNAP (Landman et al., 2007) to create maps of FA and MD, AD, and RD. These four quantities, together with MTR, are hereafter termed MRI indices. Whole-brain MRI indices were calculated by slice-wise averaging of all diffusion-weighted images, removal of the low-intensity voxels that are characteristic of extracerebral tissues on these images, and final removal of voxels with MD>1.7 μm2/ms to exclude cerebrospinal fluid (Ozturk et al., 2010). The resulting brain mask was applied to all DTI maps and also to the coregistered MTR maps.
2.4 Tract parcellation
We used a recently published atlas-based method, based on tract probabilities, to reconstruct the locations of the corpus callosum (CC), corticospinal tracts (CST), and optic radiations (OR) in all scans (Reich et al., 2010). This method involves registration of each scan to that of a single selected healthy volunteer, referred to as the template. As previously described, in 26 healthy volunteers we used fiber assignment by continuous tractography (Mori et al., 1999) to estimate the probability that each voxel in template space is part of one of those tracts. We thresholded the probability maps to exclude voxels with probability <0.05 in order to limit the number of spurious assignments (Reich et al., 2010), and then binarized the probability maps to create masks. We applied these masks to MRI index maps from every scan to identify the voxels belonging to each tract.
2.5 Spatially normalized tract profiles
We created spatially normalized tract profiles to account for the spatial variation in MRI indices along each tract; see Figure 1 in (Reich et al., 2007). Specifically, we divided each tract in the template space into segments and subsegments, with each subsegment spanning approximately 1 mm. We divided the entire OR into 60 subsegments along the anteroposterior axis; the CST into 6 segments along the rostrocaudal axis, each segment comprising 20 subsegments with segmental boundaries at predetermined, manually placed anatomical landmarks (Reich et al., 2007); and the CC into 6 segments, each again comprising 20 subsegments, along the more functionally defined anteroposterior axis (rather than along the mediolateral orientation of its component fibers) (Ozturk et al., 2010). The CC delineation followed a commonly used scheme (Witelson, 1989) that divides the CC into the following sections: rostrum and genu together, rostral body, anterior midbody, posterior midbody, isthmus, and splenium. For each tract, we created the spatially normalized tract profiles by calculating the average value of each MRI index within a sliding window of width 5 subsegments. We then plotted these average values as a function of tract position (anteroposterior for the OR and CC, rostrocaudal for the CST). Note that the tract segmentation used to generate tract profiles is performed with the express purpose of facilitating landmark-based registration, and the specific segmentation schemes are unrelated to the spline-based smoothing used in PFR (see Section 2.6).
Figure 1.
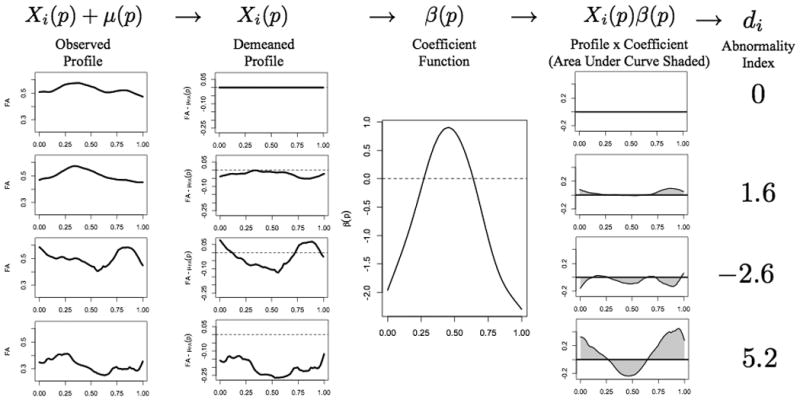
Schematic description of the PFR analysis, using FA in the right OR as the regressor and case status as the outcome. In all panels, the horizontal axis corresponds to normalized position along the tract (0 is close to the lateral geniculate nucleus, 1 to the primary visual cortex), and the vertical axis is dimensionless. The left column shows raw tract profiles: top row, population mean FA derived from 42 healthy volunteers; second row, population mean derived from 115 MS cases; third row, 23-year-old healthy woman; fourth row, 42-year-old woman with secondary-progressive multiple sclerosis and EDSS 2.0. The second column shows the same tract profiles after subtracting the healthy-volunteer population mean. The third column shows the derived weighting function β(p) for this tract and MRI index. The fourth column shows the weighted tract profiles derived by point-wise multiplication of the demeaned tract profiles in the second column by the weighting function in the third column. Finally, the fifth column shows the tract-abnormality indices di. Lower (including negative) values of di denote tracts that are more likely to come from healthy volunteers, and higher values denote tracts that are more likely to come from MS cases. Thus, the tract in the fourth row, which derives from the MS case, is most abnormal.
2.6 Penalized functional regression
PFR is a statistical method that we developed to relate spatially normalized tract profiles to clinical outcomes, whether cases status or disability scores (Goldsmith et al., 2010b). PFR considers the tract profiles as continuous functions parameterized by location along the tract and seeks a smooth weighting scheme that, when applied to a tract profile, predicts as accurately as possible the corresponding outcome.
A brief description of the PFR procedure follows; more details are provided in the Appendix and in (Goldsmith et al., 2010b). For each tract Xi(p) denotes the tract profile for participant i after subtracting the population mean μ(p), where p is the tract position (defined on the interval [0,1]) and Yi is either a dummy variable indicating case status (0 for healthy volunteers, 1 for MS cases) or a scalar disability score. Note that when considering case status as outcome, we subtract from the tract profile of each case the mean tract profile derived from all healthy volunteers. When considering disability scores, which are not measured for healthy volunteers, we use mean tract profiles derived from the included MS cases.
The linear functional regression model is:
| (1) |
where β(p) is the smooth weighting scheme we wish to estimate and εi is the remaining error. The εi are considered to be to be normally distributed with mean 0 and variance . PFR uses a large spline basis for β(p) and explicitly induces smoothness via standard mixed-effects models and cross-validation. When regressed on case status, the integral term is defined to be the scalar tract abnormality index, di:
| (2) |
To build intuition for the meaning of β(p), consider the following. Instead of requiring β(p) to be smooth, let:
so that di=β1Xi,1+ β2Xi,2+ β3Xi,3, where for example Xi,1 is the average of the tract profile in the region 0 ≤ p ≤ 0.33. This corresponds to a standard multivariate regression analysis, with the three region means used as regressors. Thus, |β(p)| provides information regarding the importance of each region for predicting the outcome (case status or disability score): small |β(p)| (near 0) implies a region is unimportant, whereas large |β(p)| has a significant impact on the estimated outcome. Now, consider more and smaller regions. The interpretation of β(p) for each of the smaller regions remains the same as in the case with only three. As the number of regions increases to infinity, we arrive at the functional regression model presented above. The constraint that β(p) be smooth arises from the logical assumption that nearby points have similar impacts on the outcome. Figure 1 shows the interaction of the tract profiles Xi(p) and weighting scheme β(p) to produce estimates of the outcome.
It is important to point out that the PFR procedure is flexible, as it is able to handle missing observations within the Xi(p) or observations measured with error; highly automated, as it is implemented via standard statistical software (R; http://www.r-project.org) with minimal user input; and easily generalizable, as it allows dichotomous outcomes to be considered. The software has been integrated into the “Refund” package in R (http://cran.r-project.org/web/packages/refund) and is freely available.
2.7 Statistical analysis
To address the hypothesis that spatial variation in the imaging properties of white-matter tracts can be useful in predicting case status, we fit three related logistic regression models. The first model includes subject-level information (age, sex, and whole-brain MRI index) but no tract-specific information:
| (3) |
The second model augments the first model with the addition of the tract-specific index average, :
| (4) |
Finally, the third model augments the first with the integral term appearing in the PFR model:
| (5) |
The first two models are standard logistic regression models that do not account for spatial variation in the tract profiles and are fit using standard techniques. Model 2 includes tract-specific information, but only in a spatially averaged sense. The final model, which accounts for spatial variation, is the only that is fit using the PFR procedure described above. We choose the level of smoothness to maximize the area under the leave-one-out, cross-validated ROC curve and to maximize interpretability. Specifically, among all levels of smoothness resulting in an area under the curve within 2% of the maximum we empirically choose the one that gives a number of degrees of freedom closest to 10. Note that the integral term in the third model (5) retains an influence from the tract-specific index average.
When fitting models (3)-(5) for the CST and OR, we included the left and right tract profiles as independent observations, because the two sides are separated in space in the portion of the brain analyzed here (i.e., above the decussation of the CST in the medulla). This yields an effective sample size of double the number of participants for these two tracts. Since the CC is here considered a single fiber bundle that crosses the midline, we included a single observation for each participant. In order to increase the generalizability of our results, we randomly divided the full dataset into training and validation sets. For the CST and OR, where the effective sample size was larger, the training set consisted of 65% of the observations; for the CC, it used 80% of observations.
We also performed additional analyses, with linear regression models analogous to (3)-(5) above, to examine the usefulness of incorporating spatial variation in the tract profiles to predict disability scores. In the PFR model (5), the level of smoothness was chosen to minimize the leave-one-out, cross-validated prediction error and to maximize interpretability. Empirically, in each case we chose a level of smoothness that yielded prediction errors within 5% of the minimum and a number of degrees of freedom closest to 10. Once again, for the CST and OR we included the left and right tract profiles as independent observations.
3. Results
We first consider the contribution of the spatial variation of MRI indices along white-matter tracts to distinguish MS cases from healthy volunteers. We then proceed to illustrate a similar analysis that relates tract profiles to disability scores. We compare the PFR results that consider spatial variation to those from more standard regression models that do not. In the following, Model 1 includes age, sex, and whole-brain MRI index; Model 2 adds the tract-specific index average; and Model 3 is the full PFR model that adjusts for age, sex, and whole-brain MRI index but also implicitly considers the tract-specific average.
3.1 Prediction of case status
Here, we consider MS case status as the outcome. As an example, we use the demeaned FA profile in the right OR to distinguish between MS cases (blue lines in Figure 2A) and healthy volunteers (red). The weighting function that best separates the two groups using PFR is shown in Figure 2B and emphasizes the contrast between the middle portion of the tract and its termini, so that tract profiles with substantially lower-than-average values of FA at the termini but slightly higher-than-average values in the middle are more likely to come from MS cases. Model 2, by construction, averages these regions of the tract together.
Figure 2.

PFR analysis of FA in the right OR improves discrimination of MS cases from healthy volunteers. Panel A shows the spatially normalized tract profiles for MS cases (blue) and healthy volunteers (red) after removing the healthy-volunteer population mean; there is a great deal of overlap. Panel B shows the weighting function β(p) for the PFR; this function is optimized to maximize separation of cases from controls. Panel C shows ROC curves for Model 2 (purple), which includes age, sex, whole-brain FA, and average FA over the OR; and Model 3 (black), which also includes the PFR results. Solid lines show the leave-one-out cross-validated analysis of the training dataset, and dashed lines show the results obtained by applying the weighting function shown in Panel B to a test dataset. The best separation between MS cases and healthy volunteers is obtained with Model 3 (black). Panel D is a scatter plot of the tract-specific abnormality scores (vertical axis) against the tract-specific means, showing that the abnormality score gives much better separation of the two groups.
The comparison of Models 2 (solid purple curve in Figure 2C) and 3 (solid black curve) is based on ROC analysis and uses leave-one-out cross-validation. Model 1 (which does not account for tract-specific effects and is not shown) and Model 2 (which includes the mean tract-specific MRI index) perform similarly in terms of classifying cases and controls (not shown), but using PFR to consider the complete tract profile in Model 3 improves the classification (i.e. shifts the ROC curve to the left). This is not surprising, because the tract-abnormality index di greatly improves separation between the two groups in comparison to the tract-specific mean (Figure 2D). In Figure 2C, we also display the ROC curves for the test set using the β(p) function derived from the training set (dashed curves). The results indicate that the method is robust, providing even better prediction accuracy for the test set than for the training set.
Figure 3 shows the weighting functions β(p) for each tract and MRI index. In general, these weighting functions differ from index to index and tract to tract, though within individual tracts the β(p) functions for RD and MD tend to have similar shapes. These shapes highlight areas of the tracts that are relatively emphasized or de-emphasized when separating MS cases (Yi=1) from healthy volunteers (Yi=0). Interpretation of the weighting functions requires knowledge of whether each MRI index typically increases (AD, RD, MD) or decreases (FA, MTR) in the MS tracts relative to its average value in healthy volunteers. An example is MD of the CC (1st row, 4th plot from the left). For this index, abnormally high values of MD in the rostrum, genu, and rostral body (positions 0-0.33) and isthmus (0.67-0.83) increase the likelihood of MS, whereas high values in the midbody (positions 0.33-0.67) and splenium (0.83-1) have little effect.
Figure 3.

Weighting functions β(p) for predicting MS case vs. healthy-volunteer status. Top row, CC; middle row, CST; bottom row, OR. For the CST and OR, data from the right and left sides have been combined. The horizontal axis is a normalized distance measure along a parameterization of the tract and has been divided into anatomical regions. For the CC, regions R1 through R6 refer to the rostrum/genu, rostral body, anterior midbody, posterior midbody, isthmus, and splenium, respectively; for the CST, regions R1 through R6 refer to the medulla, pons, midbrain, internal capsule, corona radiata, and subcortical white matter; and for the OR, 0 corresponds to the lateral geniculate nucleus and 1 to the subcortical white matter of the occipital lobe. By construction, the unit of β(p) for each MRI index is the inverse of the unit of the MRI index itself.
Population results are provided in Figure 4 and Table 2. The areas under the ROC curves are given in Table 2 for both the training sets (calculated with the leave-one-out cross-validation procedure) and test sets. These values are a measure of the ability of each model to discriminate MS cases from healthy volunteers for each tract and MRI index. Because Model 1 does not use tract specific information, the corresponding training-set results are the same for the CST and OR; results for the CC are different because they are constructed on a smaller effective sample (see Methods). Model 3, which uses PFR to account for the spatial variation in MRI index along a tract, is associated with the best discrimination performance, yielding improvements up to 15% (mean across all tracts and MRI indices: 6.4%). Note that for the CC, the performance of Model 2 is substantially improved on the test set, where it in fact outperforms Model 3. This instability is a result of the small test set for the CC, containing 9 healthy volunteers and 24 MS cases, and likely does not reflect a truly increased predictive ability of the simpler model.
Figure 4.

Box plots showing the distribution of abnormality indices for MS cases (blue) and healthy volunteers (red) for each pair of MRI index and tract. The p-values listed over each pair of box plots are derived from two-sided two-sample t-tests and are not corrected for multiple comparisons. The solid lines indicate the median for each group, the box edges the interquartile range, and the whiskers the most extreme data points no more than 1.5 times the interquartile range from the median. Notches show robust estimates of the medians. Corresponding means and standard deviations are provided in Table 2.
Table 2.
Discrimination of MS cases from healthy volunteers. Model 1 considers only age, sex, and the whole-brain MRI index. Model 2 adds the average tract-specific MRI index. Model 3 uses penalized functional regression to account for spatial variation in the tract-specific MRI index. Values correspond to the area under the ROC curve for distinguishing MS cases from healthy volunteers; areas under the ROC curve and corresponding % improvement for Model 3 vs. Model 2 for the test set appear in parentheses. For the tract abnormality index di, the mean (±SD) for the MS cases is followed by the corresponding value for healthy volunteers.
| Tract | MRI index | Area under ROC curve | Improvement | Tract abnormality index (di) | ||
|---|---|---|---|---|---|---|
| Model 1 | Model 2 | Model 3 | 3 vs. 2 | Model 3 | ||
| corticospinal tract | FA | .73 (.67) | .73 (.67) | .80 (.70) | 9.6% (4.5%) | 0.99(±1.2); 0(±1.2) |
| MD | .78 (.74) | .78 (.74) | .80 (.76) | 2.6% (2.7%) | 1.21(±1.5); 0(±1.1) | |
| MTR | .71 (.65) | .71 (.65) | .73 (.72) | 2.8% (10.8%) | 0.24(±0.8); 0(±1.1) | |
| corpus callosum | FA | .68 (.69) | .68 (.80) | .78 (.73) | 14.7% (-8.8%) | 1.88(±1.4); 0(±1.4) |
| MD | .73 (.74) | .73 (.86) | .80 (.78) | 9.6% (-9.3%) | 2.86(±2.5); 0(±1.5) | |
| MTR | .66 (.78) | .65 (.77) | .72 (.71) | 10.8% (-7.8%) | 0.39(±0.8); 0(±.9) | |
| optic radiation | FA | .73 (.67) | .74 (.67) | .79 (.77) | 6.8% (14.9%) | 1.59(±1.3); 0(±1.2) |
| MD | .78 (.74) | .78 (.74) | .81 (.80) | 3.9% (8.1%) | 0.33(±1.1); 0(±1.1) | |
| MTR | .71 (.65) | .71 (.65) | .69 (.69) | -2.8% (6.2%) | 0.24(±0.4); 0(±0.3) | |
In Figure 4, we show box plots and corresponding p-values from 2-sample t-tests comparing PFR (Model 3) abnormality indices (di) from MS cases with those from healthy volunteers for each combination of MRI index and tract. By construction, di=0 is the abnormality index in the mean healthy-volunteer tract. Tracts with di<0 are more likely to derive from healthy volunteers, whereas tracts with di>0 are more likely to derive from MS cases. The box plots show that the two groups are well distinguished for all MRI indices and tracts, though more for diffusion indices than for MTR. Among tracts, the CC appears most abnormal, showing the greatest separation between MS cases and healthy volunteers. Corresponding data are provided in Table 2 as mean ± SD for di. A pooled analysis of variance demonstrates significant main effects of case status, tract type, and MRI index on tract abnormality score (p<0.0001 in all cases).
3.2 Prediction of disability scores
To illustrate the performance of our method for relating imaging results to global disability, we focus on the relationship between MD in the CC and six disability scores: EDSS, MSSS, MSFC, PASAT, 9HPT, and 25FTW (Table 3 and Figure 5). We choose the CC because it contains fibers that may play a role in determining all of these measures; we obtained similar results for the CST and OR for functions (movement and vision, respectively) related to those tracts. Table 3 shows that Model 1 already explains a large fraction of the variation in the EDSS, indicating that CC damage is not particularly relevant. On the other hand, CC damage is highly relevant for PASAT-3, so that accounting for MD in the CC yields an improvement of 163% in the prediction of that score. The relevance of spatial variation in MD across the CC (Model 3) is greatest for MSFC (14% improvement in prediction), MSSS (13%), and PASAT-3 (11%). The β(p) functions shown in Figure 5 indicate, not surprisingly, similar weighting for the interrelated EDSS and MSSS scores. More interesting is the similarity of the weighting functions for 9HPT and 25FTW, which are both motor outcomes. The weighting function for PASAT-3 is somewhat different and appears to most strongly determine the weighting function for MSFC, which is a composite of PASAT-3, 9HPT, and 25FTW.
Table 3.
Regression results for disability scores vs. MD in the corpus callosum. Values indicate the fraction of variance in disability score that is explained by each combination of MRI index and regression model. Model 1 considers only age, sex, and whole-brain MRI index; Model 2 adds the average tract-specific MRI index; and Model 3 uses penalized functional regression to account for spatial variation in the tract-specific MRI index.
| Disability Score | Model 1 | Model 2 | Model 3 | % improvement | |
|---|---|---|---|---|---|
| 3 vs. 1 | 3 vs. 2 | ||||
| EDSS | 0.36 | 0.36 | 0.37 | 3% | 3% |
| MSSS | 0.14 | 0.16 | 0.18 | 29% | 13% |
| MSFC | 0.10 | 0.14 | 0.16 | 60% | 14% |
| PASAT-3 | 0.08 | 0.19 | 0.21 | 163% | 11% |
| 9HPT | 0.13 | 0.13 | 0.14 | 8% | 8% |
| 25FTW | 0.16 | 0.16 | 0.17 | 6% | 6% |
Figure 5.
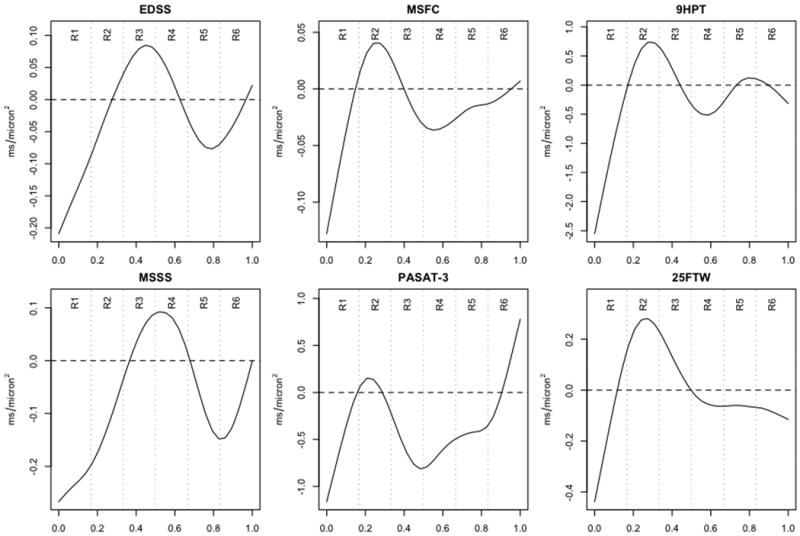
Weighting functions β(p) for predicting various disability scores from MD in the CC. See the legend to Figure 3 for a description of the horizontal axes.
4. Discussion
The correlations between MRI results and clinical variables in MS remain perplexingly poor despite the high sensitivity of MRI for detecting MS lesions and defining their location in space. Diffusion-weighted MRI holds some promise to improve this state of affairs by allowing accurate delineation of the location of functional systems in the brain and providing a means to quantify tissue damage in those tracts. Previous work has demonstrated the presence of correlations between MRI abnormalities in specific tracts and disability related to the function of those tracts (Ciccarelli et al., 2008; Gorgoraptis et al., 2010).
We have demonstrated, through a detailed analysis of three tracts in 42 healthy volunteers and 115 MS cases, including both lesions and so-called normal-appearing white matter, that accounting for spatial variation within a tract, rather than simply considering average measurements, can substantially improve the statistical associations between quantitative MRI indices and case status (i.e., presence or absence of MS). To do this, we developed a new statistical technique – PFR – that operates on the natural representation of tract-specific imaging data as parametric functions of space rather than scalar measures (Goldsmith et al., 2010b). We validated the method by dividing our sample into training and testing sets and demonstrating similar results in the two groups. In the pooled analysis (Figure 4 and Table 2), there is generally robust separation across case status between the abnormality scores, with respect to both mean values (see p-values in Figure 4) and distributions.
In order to maintain brevity, we only partially present here, in Figure 5 and Table 3, the results of a similar analysis using disability scores as the outcome. Although in many cases the PFR-related improvement in prediction is only modest, in some cases (e.g., the ability of MD in the CC to predict the MSFC score) accounting for the spatial variation across the tracts is particularly useful. This improvement comes at the cost of creating tract profiles that are accurately registered across subjects. However, with the advent of atlas-based registration techniques that work in the presence of disease (Pagani et al., 2005; Reich et al., 2010), these tract profiles can be created automatically.
MRI indices have a normal variation along white-matter tracts (Reich et al., 2006; Stieltjes et al., 2001). This variation is especially prominent for indices, such as FA, that have high contrast within the white matter, but even T1 and T2 relaxation times may vary by location. Spatial variation may be affected by the presence of disease, which may have both microstructural (for example, through the presence of focal MS lesions) and macrostructural effects (for example, changes in tract curvature due to brain atrophy). Even diffuse damage that affects long segments of a tract could affect spatial variation in at least two ways: (1) when the damage interacts with local macrostructural features, such as curvature and axon density; and (2) when the damage affects only a portion of the tract, such as might occur with Wallerian degeneration distal to a lesion in the tract's midsection. The additional information provided by PFR is therefore most helpful in tracts where the spatial variation is substantial and therefore likely to be compounded by disease effects. Our results imply that when evaluating quantitative MRI indices in the brain, great care must be taken in ROI placement both across and within individuals to avoid false positive results.
The combination of spatially normalized tract profiles with PFR represents a powerful way of accounting for spatial variation, for several reasons: (1) it involves registration of tracts across individuals, in this case using landmarks, so that the registration accuracy does not suffer by inclusion of extraneous brain regions; (2) it allows comparison of cases to a collection of controls at each position along the tract; and (3) it allows extraction of additional outcome-related information from the spatial variation. Advantages of PFR include emphasizing regions of the tracts that are more or less relevant to the outcome, which in the work described here was either case status or disability score; robustness to misregistration, which can appear as jitter in the tract profiles; and relatively low sensitivity to partial volume averaging. We did not perform a formal analysis investigating the degree to which crossing fibers or lesions – factors that interfere with tract reconstruction using conventional tractography – affect the PFR results. However, we note that PFR de-emphasizes regions of reconstructed tracts that have little bearing on the outcome, particularly if those areas are not included in the tract profiles themselves.
Despite pronounced heterogeneity in lesion location and volume across cases, the analysis uncovers tract-specific features that are common in MS (i.e., that emerge from studying the entire MS cohort). In additional analyses not formally presented here, we found that nonzero (i.e. important) regions of the weighting functions β(p) for the most part remain stable across a range of smoothness levels, indicating that identification of these regions is related to the disease rather than to the statistical methodology. It is likely that the weighting schemes are most robust where the relationship between tract and outcome is clearest.
One interesting finding is that the PFR weighting functions (Figure 3) do not always emphasize the portions of the tracts that contain lesions. A prime example is the weighting function for OR-specific FA presented in Figures 1 and 2. This tract passes along the lateral border of the lateral ventricular trigone, a common site of MS lesions (Sahraian and Radue, 2008). However, the portions of the tract in which low FA is most heavily weighted for prediction of tract status are its termini, near the lateral geniculate nucleus and primary visual cortex. Because the tracts were reconstructed using an atlas-based method rather than tractography, this cannot be explained by the exclusion of lesioned portions of the tracts from the analysis. In fact, because lesions only make up a relatively small fraction of each tract on average (Reich et al., 2009), the tract profiles themselves are mostly determined by extralesional portions of the tracts. Furthermore, most of the spatial variation is present in tract profiles from both MS cases and healthy volunteers. As discussed above, these results suggest that PFR highlights local effects of tissue damage, either diffuse or tract-specific, that may ultimately reflect the effects of axonal loss on disease severity.
Why aren't correlations with disability stronger even after using PFR to extract additional outcome-related information from the tract-specific MRI indices? Possible explanations include variability in the outcome measures, failure to capture all the functionally relevant areas of the central nervous system, and limited sensitivity to, and specificity for, the aspects of tissue damage that cause disability in MS. We expect that the results in this paper are probably close to the upper bound of what can be expected using existing measurement techniques, though they might be improved somewhat if information from multiple different tracts were integrated.
Functional data analysis techniques with application to DTI are increasingly popular, especially for applications such as the one discussed here. For example, Zhu et al. consider a functional linear model in which a collection of covariates is used to predict a tract profile (Zhu et al., 2010). Greven et al. use functional principal components analysis to decompose populations of tract profiles observed longitudinally into their main directions of variability (Greven et al., 2010). Staicu et al. explore the decomposition of skewed functional observations where the skewness varies spatially (Staicu et al., 2010). Our method is data-driven, yielding results that often have clear biological interpretations. In addition, to our knowledge this is the first case in which functional observations of white-matter tracts have been used to predict disability scores or case status.
The functional data perspective adopted here differs from other voxel-based approaches to regression with very large predictors. Voxel-based methods conduct many simple regressions and look for regions of interest based on a combination of the results; here, we propose a more complex regression model that takes a functional object as a predictor. Thus, our functional approach treats complex observations as single entities and benefits from the explicit incorporation of spatial information in the model. A limitation of this approach is the requirement for more complex and possibly less intuitive models than would otherwise be necessary. Furthermore, the assumption of a smooth coefficient function may cause very localized effects to appear diffuse. Finally, as a consequence of the model's complexity, large sample sizes may be needed to achieve reasonable estimates.
PFR can be naturally and readily extended to more complex situations, such as longitudinal tract-specific data or simultaneous analysis of multiple MRI indices from the same scan. Adding subject-specific random intercepts in the longitudinal setting and/or including multiple tract profiles could be easily accomplished in the mixed model-based PFR framework using augmented random-effects design matrices (Goldsmith et al., 2010a).
Supplementary Material
Acknowledgments
The authors thank Peter Calabresi, Peter van Zijl, Seth Smith, Eliza Gordon-Lipkin, Sheena Farrell, Terri Brawner, Kathleen Kahl, and Ivana Kusevic, all of whom were instrumental in collecting the data for this study. Jonathan Farrell and Bennett Landman provided assistance with image processing. The study was supported by the National Institutes of Health (the Intramural Research Program of the National Institute of Neurological Disorders and Stroke as well as grants K99NS064098, R01NS060910, and P41RR015241); the National Multiple Sclerosis Society (grant TR3760A3); and an unrestricted grant from EMD Serono to support data collection. The content is solely the responsibility of the authors and does not necessarily represent the official views of the funding agencies.
Abbreviations
- MS
multiple sclerosis
- CIS
clinically isolated syndrome
- RRMS
relapsing-remitting multiple sclerosis
- SPMS
secondary-progressive multiple sclerosis
- PPMS
primary-progressive multiple sclerosis
- DTI
diffusion tensor imaging
- FA
fractional anisotropy
- MD
mean diffusivity
- AD
axial (parallel) diffusivity
- RD
radial (perpendicular) diffusivity
- MTR
magnetization transfer ratio
- EPI
echo-planar imaging
- TE
echo time
- TR
repetition time
- ROI
region of interest
- CATNAP
coregistration, adjustment, and tensor-solving, a nicely automated program
- CST
corticospinal tract
- CC
corpus callosum
- OR
optic radiation
- EDSS
expanded disability status scale
- MSSS
multiple sclerosis severity score
- MSFC
multiple sclerosis functional composite
- PASAT-3
paced auditory serial addition test, 3-second version
- 9HPT
timed 9-hole peg test
- 25FTW
timed 25-foot walk
- PFR
penalized functional regression
- ROC
receiver operating characteristic
- SD
standard deviation
Footnotes
Publisher's Disclaimer: This is a PDF file of an unedited manuscript that has been accepted for publication. As a service to our customers we are providing this early version of the manuscript. The manuscript will undergo copyediting, typesetting, and review of the resulting proof before it is published in its final citable form. Please note that during the production process errors may be discovered which could affect the content, and all legal disclaimers that apply to the journal pertain.
Contributor Information
Jeff Goldsmith, Email: jgoldsmi@jhsph.edu.
Ciprian M. Crainiceanu, Email: ccrainic@jhsph.edu.
Brian S. Caffo, Email: bcaffo@jhsph.edu.
References
- Ashburner J, Friston KJ. Voxel-based morphometry--the methods. Neuroimage. 2000;11:805–821. doi: 10.1006/nimg.2000.0582. [DOI] [PubMed] [Google Scholar]
- Barkhof F. The clinico-radiological paradox in multiple sclerosis revisited. Curr Opin Neurol. 2002;15:239–245. doi: 10.1097/00019052-200206000-00003. [DOI] [PubMed] [Google Scholar]
- Ciccarelli O, Catani M, Johansen-Berg H, Clark C, Thompson A. Diffusion-based tractography in neurological disorders: concepts, applications, and future developments. The Lancet Neurology. 2008;7:715–727. doi: 10.1016/S1474-4422(08)70163-7. [DOI] [PubMed] [Google Scholar]
- Fischer JS, Rudick RA, Cutter GR, Reingold SC. The Multiple Sclerosis Functional Composite Measure (MSFC): an integrated approach to MS clinical outcome assessment. National MS Society Clinical Outcomes Assessment Task Force. Mult Scler. 1999;5:244–250. doi: 10.1177/135245859900500409. [DOI] [PubMed] [Google Scholar]
- Goldsmith J, Crainiceanu CM, Caffo BS, Reich DS. Longitudinal penalized functional regression. Johns Hopkins University, Dept. of Biostatistics Working Papers, Working Paper 216 2010a [Google Scholar]
- Goldsmith J, Feder J, Crainiceanu CM, Caffo BS, Reich DS. Penalized functional regression. Journal of Computational and Graphical Statistics. 2010b doi: 10.1198/jcgs.2010.10007. in press. [DOI] [PMC free article] [PubMed] [Google Scholar]
- Goodin DS. Magnetic resonance imaging as a surrogate outcome measure of disability in multiple sclerosis: have we been overly harsh in our assessment? Ann Neurol. 2006;59:597–605. doi: 10.1002/ana.20832. [DOI] [PubMed] [Google Scholar]
- Goodlett CB, Fletcher PT, Gilmore JH, Gerig G. Group analysis of DTI fiber tract statistics with application to neurodevelopment. Neuroimage. 2009;45:S133–142. doi: 10.1016/j.neuroimage.2008.10.060. [DOI] [PMC free article] [PubMed] [Google Scholar]
- Gorgoraptis N, Wheeler-Kingshott CA, Jenkins TM, Altmann DR, Miller DH, Thompson AJ, Ciccarelli O. Combining tractography and cortical measures to test system-specific hypotheses in multiple sclerosis. Mult Scler. 2010;16:555–565. doi: 10.1177/1352458510362440. [DOI] [PMC free article] [PubMed] [Google Scholar]
- Greven S, Crainiceanu C, Caffo BS, Reich DS. Longitudinal functional principal component analysis. Electron J Statist. 2010;4:1022–1054. doi: 10.1214/10-EJS575. [DOI] [PMC free article] [PubMed] [Google Scholar]
- Harrison DM, Caffo BS, Shiee N, Farrell JAD, Bazin PL, Farrell SK, Ratchford JN, Calabresi PA, Reich DS. Longitudinal changes in diffusion tensor-based quantitative MRI in multiple sclerosis. Neurology. 2011;76:179–186. doi: 10.1212/WNL.0b013e318206ca61. [DOI] [PMC free article] [PubMed] [Google Scholar]
- Jones DK, Travis AR, Eden G, Pierpaoli C, Basser PJ. PASTA: pointwise assessment of streamline tractography attributes. Magn Reson Med. 2005;53:1462–1467. doi: 10.1002/mrm.20484. [DOI] [PubMed] [Google Scholar]
- Kern KC, Sarcona J, Montag M, Giesser BS, Sicotte NL. Corpus callosal diffusivity predicts motor impairment in relapsing-remitting multiple sclerosis: ATBSS and tractography study. Neuroimage. 2010 doi: 10.1016/j.neuroimage.2010.10.077. in press. [DOI] [PubMed] [Google Scholar]
- Kurtzke JF. Rating neurologic impairment in multiple sclerosis: an expanded disability status scale (EDSS) Neurology. 1983;33:1444–1452. doi: 10.1212/wnl.33.11.1444. [DOI] [PubMed] [Google Scholar]
- Landman BA, Farrell JA, Jones CK, Smith SA, Prince JL, Mori S. Effects of diffusion weighting schemes on the reproducibility of DTI-derived fractional anisotropy, mean diffusivity, and principal eigenvector measurements at 1.5T. Neuroimage. 2007;36:1123–1138. doi: 10.1016/j.neuroimage.2007.02.056. [DOI] [PubMed] [Google Scholar]
- Lin F, Yu C, Jiang T, Li K, Li X, Qin W, Sun H, Chan P. Quantitative analysis along the pyramidal tract by length-normalized parameterization based on diffusion tensor tractography: application to patients with relapsing neuromyelitis optica. Neuroimage. 2006;33:154–160. doi: 10.1016/j.neuroimage.2006.03.055. [DOI] [PubMed] [Google Scholar]
- Lin X, Tench CR, Morgan PS, Constantinescu CS. Use of combined conventional and quantitative MRI to quantify pathology related to cognitive impairment in multiple sclerosis. J Neurol Neurosurg Psychiatry. 2008;79:437–441. doi: 10.1136/jnnp.2006.112177. [DOI] [PubMed] [Google Scholar]
- Lin X, Tench CR, Morgan PS, Niepel G, Constantinescu CS. ‘Importance sampling’ in MS: use of diffusion tensor tractography to quantify pathology related to specific impairment. J Neurol Sci. 2005;237:13–19. doi: 10.1016/j.jns.2005.04.019. [DOI] [PubMed] [Google Scholar]
- Lowe MJ, Horenstein C, Hirsch JG, Marrie RA, Stone L, Bhattacharyya PK, Gass A, Phillips MD. Functional pathway-defined MRI diffusion measures reveal increased transverse diffusivity of water in multiple sclerosis. Neuroimage. 2006;32:1127–1133. doi: 10.1016/j.neuroimage.2006.04.208. [DOI] [PubMed] [Google Scholar]
- Mori S, Crain BJ, Chacko VP, van Zijl PC. Three-dimensional tracking of axonal projections in the brain by magnetic resonance imaging. Ann Neurol. 1999;45:265–269. doi: 10.1002/1531-8249(199902)45:2<265::aid-ana21>3.0.co;2-3. [DOI] [PubMed] [Google Scholar]
- O'Donnell LJ, Westin CF, Golby AJ. Tract-based morphometry for white matter group analysis. Neuroimage. 2009;45:832–844. doi: 10.1016/j.neuroimage.2008.12.023. [DOI] [PMC free article] [PubMed] [Google Scholar]
- Oh JS, Song IC, Lee JS, Kang H, Park KS, Kang E, Lee DS. Tractography-guided statistics (TGIS) in diffusion tensor imaging for the detection of gender difference of fiber integrity in the midsagittal and parasagittal corpora callosa. Neuroimage. 2007;36:606–616. doi: 10.1016/j.neuroimage.2007.03.020. [DOI] [PubMed] [Google Scholar]
- Ozturk A, Smith SA, Gordon-Lipkin EM, Harrison DM, Shiee N, Pham DL, Caffo BS, Calabresi PA, Reich DS. MRI of the corpus callosum in multiple sclerosis: association with disability. Multiple Sclerosis. 2010 doi: 10.1177/1352458509353649. in press. [DOI] [PMC free article] [PubMed] [Google Scholar]
- Pagani E, Filippi M, Rocca MA, Horsfield MA. A method for obtaining tract-specific diffusion tensor MRI measurements in the presence of disease: application to patients with clinically isolated syndromes suggestive of multiple sclerosis. Neuroimage. 2005;26:258–265. doi: 10.1016/j.neuroimage.2005.01.008. [DOI] [PubMed] [Google Scholar]
- Reich DS, Ozturk A, Calabresi PA, Mori S. Automated vs. conventional tractography in multiple sclerosis: Variability and correlation with disability. Neuroimage. 2010;49:3047–3056. doi: 10.1016/j.neuroimage.2009.11.043. [DOI] [PMC free article] [PubMed] [Google Scholar]
- Reich DS, Smith SA, Gordon-Lipkin EM, Ozturk A, Caffo BS, Balcer LJ, Calabresi PA. Damage to the optic radiation in multiple sclerosis is associated with retinal injury and visual disability. Arch Neurol. 2009;66:998–1006. doi: 10.1001/archneurol.2009.107. [DOI] [PMC free article] [PubMed] [Google Scholar]
- Reich DS, Smith SA, Jones CK, Zackowski KM, van Zijl PC, Calabresi PA, Mori S. Quantitative characterization of the corticospinal tract at 3T. AJNR Am J Neuroradiol. 2006;27:2168–2178. [PMC free article] [PubMed] [Google Scholar]
- Reich DS, Smith SA, Zackowski KM, Gordon-Lipkin EM, Jones CK, Farrell JA, Mori S, van Zijl PC, Calabresi PA. Multiparametric magnetic resonance imaging analysis of the corticospinal tract in multiple sclerosis. Neuroimage. 2007;38:271–279. doi: 10.1016/j.neuroimage.2007.07.049. [DOI] [PMC free article] [PubMed] [Google Scholar]
- Roxburgh RH, Seaman SR, Masterman T, Hensiek AE, Sawcer SJ, Vukusic S, Achiti I, Confavreux C, Coustans M, le Page E, Edan G, McDonnell GV, Hawkins S, Trojano M, Liguori M, Cocco E, Marrosu MG, Tesser F, Leone MA, Weber A, Zipp F, Miterski B, Epplen JT, Oturai A, Sorensen PS, Celius EG, Lara NT, Montalban X, Villoslada P, Silva AM, Marta M, Leite I, Dubois B, Rubio J, Butzkueven H, Kilpatrick T, Mycko MP, Selmaj KW, Rio ME, Sa M, Salemi G, Savettieri G, Hillert J, Compston DA. Multiple Sclerosis Severity Score: using disability and disease duration to rate disease severity. Neurology. 2005;64:1144–1151. doi: 10.1212/01.WNL.0000156155.19270.F8. [DOI] [PubMed] [Google Scholar]
- Sahraian MA, Radue EW. MRI Atlas of MS Lesions. Springer; Berlin: 2008. [Google Scholar]
- Smith SM, Jenkinson M, Johansen-Berg H, Rueckert D, Nichols TE, Mackay CE, Watkins KE, Ciccarelli O, Cader MZ, Matthews PM, Behrens TE. Tract-based spatial statistics: voxelwise analysis of multi-subject diffusion data. Neuroimage. 2006;31:1487–1505. doi: 10.1016/j.neuroimage.2006.02.024. [DOI] [PubMed] [Google Scholar]
- Staicu AM, Reich DS, Crainiceanu CM, Ruppert D. Modeling functional data with spatially heterogeneous shape characteristics. Johns Hopkins University, Dept. of Biostatistics Working Papers, Working Paper 221 2010 [Google Scholar]
- Stieltjes B, Kaufmann WE, van Zijl PC, Fredericksen K, Pearlson GD, Solaiyappan M, Mori S. Diffusion tensor imaging and axonal tracking in the human brainstem. Neuroimage. 2001;14:723–735. doi: 10.1006/nimg.2001.0861. [DOI] [PubMed] [Google Scholar]
- Witelson SF. Hand and sex differences in the isthmus and genu of the human corpus callosum. A postmortem morphological study. Brain. 1989;112(Pt 3):799–835. doi: 10.1093/brain/112.3.799. [DOI] [PubMed] [Google Scholar]
- Yushkevich PA, Zhang H, Simon TJ, Gee JC. Structure-specific statistical mapping of white matter tracts. Neuroimage. 2008;41:448–461. doi: 10.1016/j.neuroimage.2008.01.013. [DOI] [PMC free article] [PubMed] [Google Scholar]
- Zhu H, Styner M, Tang N, Liu Z, Lin W, Gilmore JH. FRATS: Functional Regression Analysis of DTI Tract Statistics. IEEE Trans Med Imaging. 2010;29:1039–1049. doi: 10.1109/TMI.2010.2040625. [DOI] [PMC free article] [PubMed] [Google Scholar]
Associated Data
This section collects any data citations, data availability statements, or supplementary materials included in this article.