Abstract
Shortage of manpower and center capacity is expected to be a major challenge to the anticipated future growth in the utilization of allogeneic hematopoietic-cell transplantation (HCT) in the United States (US). Using data from the National Marrow Donor Program's Transplant Center Network Renewal Survey, we describe transplant center and transplant physician capacity in the US from 2005 to 2009. Over this five year period, the number of allogeneic transplants increased by 30%, bed capacity increased by 17% and physician full time equivalents increased by 26%. The number of related donor HCT increased by 15% and unrelated donor HCT increased by 45%. In addition to large centers, small and medium sized centers also made a major contribution to overall national transplant volumes for both related and unrelated donor HCT. Increase in utilization of unrelated donor HCT occurred in centers irrespective of their size. The majority of transplant centers were performing more transplants using existing physician and bed capacity. Our study provides important description of allogeneic transplant activity and capacity of US centers and our data will assist policy makers plan for the projected growth in the use of transplantation.
Keywords: Hematopoietic cell transplantation, National Marrow Donor Program, Center Capacity, Physician Capacity
INTRODUCTION
The utilization of related and unrelated donor allogeneic hematopoietic-cell transplantation (HCT) has markedly increased over the past decade. This has resulted from advancements in transplantation technology and supportive care, introduction of non-myeloablative and reduced intensity conditioning regimens, availability of a larger number of unrelated donors, expanding use of alternative graft sources and emerging indications of transplantation. The National Marrow Donor Program (NMDP) projects that over the next five years, it will double the annual number of unrelated donor transplants including umbilical cord blood transplants it facilitates from approximately 5,000 in 2010 to 10,000 by 2015. As more patients benefit from transplantation, there is concern that there is insufficient health care capacity to accommodate the anticipated growth in allogeneic HCT activity. Availability of transplant physicians, other medical providers and adequate infrastructure is expected to be a major barrier to the projected expansion of transplantation. Recent studies performed by the American Society of Blood and Marrow Transplantation (ASBMT) have projected a shortage of transplant physicians and transplant center capacity in the United States (US).1,2 In planning for future growth, it is essential that we understand the present capacity for HCT in the country. In this report, we describe the prevailing transplant center and transplant physician capacity in the US using data collected by the National Marrow Donor Program's (NMDP) Transplant Center Network Renewal Survey.
METHODS
The Transplant Center Network Renewal Survey is administered annually by the NMDP to all centers in its network to ensure that centers are in compliance with NMDP Standards and Participation Criteria. The survey inquires about staff resources and center facilities for allogeneic HCT and has been administered electronically using a web-based instrument since 2004. Each year, centers complete the survey in the calendar month they joined the NMDP network. In 2009, 128 centers in the US participated in the NMDP network and performed a median of 31 (range, 2–313) allogeneic transplants/center. For this study, we used information provided by centers in the US that participated in the network between 2005 and 2009 about their annual allogeneic transplant volume (using related or unrelated donors), center transplant bed capacity and full time equivalent (FTE) transplant physician positions.
Our study was designed as a descriptive study; data were summarized as frequencies/proportions or median/range, as appropriate. Unrelated donor allogeneic HCT volumes described include both adult volunteer unrelated donor and umbilical cord blood HCT. The unit of measure in our analysis is number of transplants; an individual patient may have received more than one HCT. Also, volumes reported include transplants facilitated by any registry, NMDP or other. The latter represent a relatively small volume of unrelated donor transplant activity in the country; in 2009, nine percent of all unrelated donor transplants performed in the United States were facilitated by donor registries other than the NMDP.
RESULTS
Growth in center capacity and allogeneic HCT activity
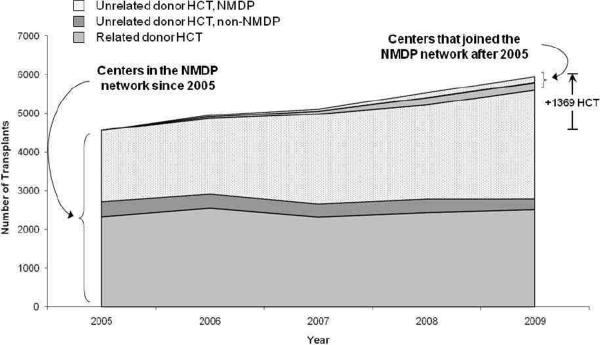
In 2009, 128 transplant centers in the US participated in the NMDP network compared to 113 in 2005 (Table 1). Collectively, these 128 centers reported 5,947 allogeneic transplants (related donor – 2,696, unrelated donor – 3,251) and represented 2,264 transplant beds and 943 transplant physician FTE's. Compared to 2005, this translated into a 30% increase in allogeneic transplant activity (annual growth rate of 6%), 17% increase in transplant bed capacity and 26% increase in physician FTE's. Growth in transplant volume was a result of increase in both related and, more notably, unrelated donor HCT (Figure 1). The number of related donor HCT increased by 15% and unrelated donor HCT increased by 45%.
Table 1.
Transplant bed capacity, physician FTE's and allogeneic transplant volumes for US centers in the NMDP network between 2005 and 2009.
| Characteristic | Year | Change 2005 to 2009 (%) | ||||
|---|---|---|---|---|---|---|
| 2005 | 2006 | 2007 | 2008 | 2009 | ||
| Centers, N | 113 | 119 | 121 | 125 | 128 | +13.3% |
| Transplant bed capacity | 1937 | 2024 | 2034 | 2172 | 2264 | +16.9% |
| Median beds/center (range) | 16 (2–56) | 14 (2–56) | 13 (2–56) | 14 (2–65) | 14 (2–73) | |
| Transplant physician FTE's | 750 | 796 | 856 | 910 | 943 | +25.7% |
| Median FTE/center (range) | 5 (1–49) | 5 (1.5–46) | 5 (1.5–47) | 5 (1.5–47) | 5 (2–47) | |
| Number of allogeneic HCT (any donor) | 4578 | 4960 | 5148 | 5532 | 5947 | +29.9% |
| Median HCT/center (range) | 25 (1–286) | 28 (3–285) | 25 (2–252) | 30 (2–298) | 31 (2–313) | |
| Number of related donor HCT | 2342 | 2587 | 2430 | 2610 | 2696 | +15.1% |
| Median HCT/center (range) | 12 (1–154) | 15 (1–127) | 12 (1–122) | 14 (1–144) | 15 (1–141) | |
| Number of unrelated donor HCT | 2236 | 2373 | 2718 | 2922 | 3251 | +45.4% |
| Median HCT/center (range) | 10 (0–152) | 11 (1–158) | 13 (0–141) | 14 (0–154) | 16 (0–172) | |
| Allogeneic HCT/HCT bed | 2.4 | 2.5 | 2.5 | 2.6 | 2.6 | +8.3% |
| Allogeneic HCT/Physician FTE | 6.1 | 6.2 | 6.0 | 6.1 | 6.3 | +3.3% |
| HCT Bed/Physician FTE | 2.6 | 2.5 | 2.4 | 2.4 | 2.4 | −8.3% |
FTE indicates full time equivalent; HCT indicates hematopoietic cell transplantation
Figure 1.
Allogeneic HCT activity among US centers in the NMDP network between 2005 and 2009. Growth in allogeneic HCT volume was primarily attributed to an increase in NMDP facilitated unrelated donor transplants in centers that were members of the network since at least 2005.
During this time period, 110 centers participated in the network for all five years, while 19 centers joined and four centers withdrew from the network. The four centers that withdrew were small centers and performed a median of 7 allogeneic transplants (range, 1–9) annually. Attrition of these centers resulted in a net loss of 33 transplant beds. In general, the 19 centers that joined the network were also relatively small; in the calendar year following the year in which they became members (since centers do not submit an annual survey in the year of joining the network), these centers performed a median of 14 allogeneic transplants (range, 3–59) and contributed a median of 9 beds/center (range, 4–24) and a median of 3.75 physician FTE's/center (range, 2–24). Of note, these 19 centers were not necessarily `new' centers, but had joined the network by virtue of their interest in accessing unrelated donors through the NMDP.
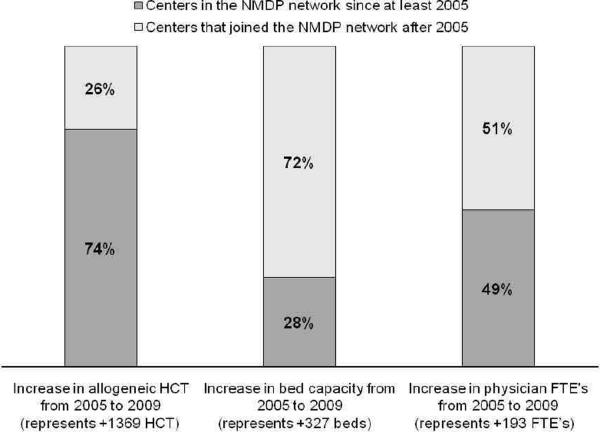
Growth in transplant activity was largely contributed by centers that were members of the network since at least 2005 (i.e., all five years of study period) and by increase in transplantation of NMDP facilitated unrelated donor grafts (Figure 1). Collectively for the 110 such centers that remained in the network for all five years, the number of all allogeneic transplants increased by 18% from 2005 to 2009; the growth rate for related donor transplants was 3% and for unrelated donor transplants was 36% for this time period. During this time period, these centers increased their bed capacity by 6% (N=101 beds) and physician FTE's by 13% (N=94 FTE's). Similarly, of the 1,369 additional allogeneic transplants that were performed in 2009 compared to 2005, only 351 (26%) were performed in centers that had newly joined the network. However, growth in beds and physician FTE's was largely contributed by new centers in the network, which comprised 72% of additional beds (N=226 beds) and 51% of additional physician FTE's (n=99 FTE's) in 2009 compared to 2005 (Figure 2).
Figure 2.
Contribution of existing and new NMDP Network centers on growth in allogeneic transplant activity, transplant beds and physician FTE's from 2005 to 2009.
Center size and transplant capacity
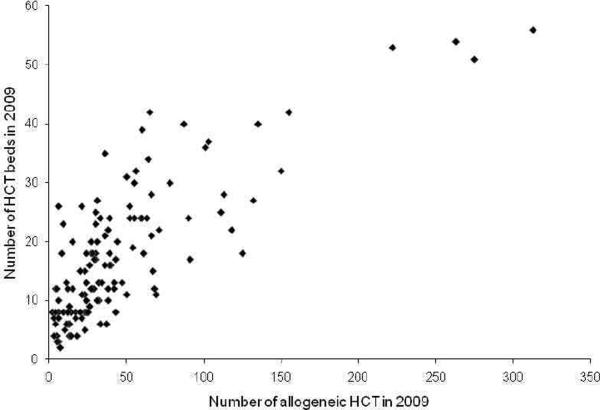
We arbitrarily classified centers as small (≤ 10 transplant beds), medium (11–20 transplant beds), large (21–30 transplant beds) or very large (≥ 31 transplant beds) for the purposes of this study. In 2009, there were 40 small, 46 medium, 26 large and 16 very large transplant centers (Figure 3). Of the 5,947 allogeneic HCT reported that year, these centers represented 11%, 28%, 25% and 36% transplants, respectively. Irrespective of size, most centers performed more unrelated than related donor transplants; of their total transplant volume, the proportion of unrelated donor transplants was 56%, 53%, 56% and 55% for small, medium, large and very large sized centers, respectively.
Figure 3.
Scatter plot of number of allogeneic HCT versus number of transplant beds among US centers in the NMDP network in 2009.
We also explored the role of center size in change in center capacity from 2005 to 2009 among the 110 centers that participated in the network for all five years. Since the number of beds in a center could have changed over time, we used the number of transplant beds in a center in the year 2007 (middle of the study time period) to assign center size for this analysis. Using this criterion, we categorized center size as small (N=32), medium (N=43), large (N=22) and very large (N=13). For centers in each category, the median annual growth rate of transplants/center was 5% (interquartile range [IQR], −3 to 20%) among small, 6% (IQR, 1 to 11%) among medium, 1% (IQR, −4 to 7%) among large and 1% (IQR, −3 to 12%) among very large centers., Increase in transplant activity at all centers over time was largely the result of more patients receiving unrelated donor HCT. The median annual growth rate/center for related donor HCT was 0%, 2%, 1% and −3%, while that for unrelated donor HCT was 8%, 8%, 2% and 6% for centers in the small, medium, large and very large size categories, respectively.
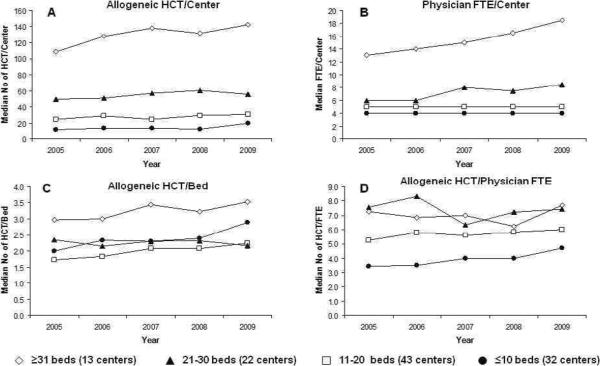
Figure 4 shows trends in various center capacity metrics based on center size. Although the annual growth rate was higher in small to medium sized centers, the increase in absolute number of patients receiving allogeneic transplants was greater in very large centers. For instance, the median number of allogeneic HCT in small centers increased from 12/center in 2005 to 20/center in 2009 (67% increase). In comparison, the median number of allogeneic HCT in very large centers increased from 109/center to 143/center (31% increase).
Figure 4.
Center size and (A) median number of allogeneic HCT/center, (B) median number of transplant physician FTE's/center, (C) median number of allogeneic HCT/bed, and (D) median number of allogeneic HCT/physician FTE. This analysis was limited to 110 centers that participated in the NMDP network for all five years.
Physician workforce and transplant capacity
The large and very large centers increased the number of physician FTE's during this time period. Individual physicians were taking care of a larger number of transplant recipients in large and very large centers compared to small and medium sized centers and this did not appear to change significantly over time (Figure 4). In 2009, the median number of allogeneic HCT per physician FTE was 4.7, 6.0, 7.4 and 7.7 for small, medium, large and very large centers, respectively. The majority of centers increased the number of transplants performed for each transplant bed. We did not observe any clear correlation between changes in center bed capacity or number of physician FTE's and allogeneic transplant activity and a large number of centers were performing more transplants using existing beds and physicians.
Adult versus pediatric center capacity
In the NMDP survey, centers self-report patient population treated as adult only, pediatric only or combined adult and pediatric. For the year 2009, we examined the center transplant activity, bed capacity and physician FTE's based on this characteristic (Table 2). There were 52 centers that identified themselves as adult only transplant programs, 27 as pediatric only programs and 49 as both adult and pediatric programs. For each physician FTE, adult only centers and both adult and pediatric centers performed more allogeneic transplants compared to pediatric only centers (7.0 vs. 6.4 vs. 4.3 allogeneic HCT/FTE). Of note, the 49 centers that reported treating both adult and pediatric centers may not be `true' combined programs. For instance, an institution may have separate adult and pediatric transplant units and physicians and providers, but may have identified itself as a combined program for purposes of NMDP network membership.
Table 2.
Transplant bed capacity, physician FTE's and allogeneic transplant volumes by patient population treated for US centers in the NMDP network in 2009.
| Characteristic | Patient population treated in 2009* |
||
|---|---|---|---|
| Adult only | Both adult and pediatric | Pediatric only | |
| Centers, N | 52 | 49 | 27 |
| Transplant bed capacity | 781 | 1239 | 244 |
| Median beds/center (range) | 13 (3–31) | 22 (8–56) | 8 (2–24) |
| Transplant physician FTE's | 244 | 581 | 118 |
| Median FTE/center (range) | 4 (2–13) | 9 (3–47) | 4 (2–9) |
| Number of allogeneic HCT (all donors) | 1703 | 3737 | 507 |
| Median HCT/center (range) | 27 (2–118) | 52 (4–313) | 17 (3–60) |
| Allogeneic HCT/HCT bed | 2.2 | 3.0 | 2.1 |
| Allogeneic HCT/Physician FTE | 7.0 | 6.4 | 4.3 |
FTE indicates full time equivalent; HCT indicates hematopoietic cell transplantation
Centers self reported patient population treated as adult only, pediatric only or both adult and pediatric; combined centers may have separate adult and pediatric transplant physicians and beds, but are members of the NMDP Network as a combined program
DISCUSSION
Among centers in the NMDP network, the increasing utilization of allogeneic HCT in the US has been driven by a greater number of patients receiving unrelated donor transplants. Besides factors that have led to an increase in the use of allogeneic HCT in general, the growth in unrelated donor HCT reflects greater comfort level among centers in using unrelated donor grafts and the better availability of suitable unrelated donors.3 The growth rate of unrelated donor HCT can be expected to increase even further as the utilization of umbilical cord blood as a graft source becomes prevalent.4,5
Optimal care of transplant recipients requires availability of an adequate number of transplant physicians. In 2009, centers reported a total of 943 physician FTE's on the survey. In comparison, Gajewski et al reported 1115 transplant physicians in the US in 2009 in a workforce study that used ASBMT membership data.1 The inconsistency in the number of transplant physicians from two sources can be explained by the fact that some physicians do not work full time and the ASBMT membership roster may also include physicians who are not actively involved in the clinical care of transplant recipients or practice in centers that do not participate in the NMDP network. Albeit some limitations, we noted that adult HCT physicians treat a greater number of patients/physician compared to pediatric physicians. When autologous transplants are considered, this difference may be further accentuated because autologous transplants are more prevalent in the adult patient population and our study did not account for autologous HCT.
Physicians without formal training in HCT (e.g. hospitalists) and providers other than physicians may also play a major role as centers expand or plan for future expansion of their capacity. Many centers employ physician extenders or mid-level providers (e.g., nurse practitioners, physician assistants) to assist in the care of HCT recipients.2 We could not address the utilization of physician extenders in the care of transplant recipients in our study as the survey has not collected these data. The present number and future availability of physician extenders and their role in different models of care delivery in centers will have to be considered as the transplant community addresses transplant physician shortages.
Our study shows that the majority of NMDP participating centers are doing more allogeneic transplants, especially unrelated donor HCT, irrespective of their size and without substantially increasing their transplant beds or physician FTE's. These trends raise many questions. Are centers stretching existing resources to perform more transplants or are they more efficiently transplanting patients using present capacity? Especially in the former case, is there a potential to compromise quality of care and outcomes for HCT recipients? What is the optimal number of transplants that can be performed per transplant bed or physician FTE? What role do non-transplant physicians (e.g. hospitalists) and non-physician providers (e.g. nurse practitioners, physician assistants) play in addressing capacity challenges in centers?
The NMDP projects that the number of unrelated donor and cord blood transplants that it facilitates will double from the present utilization of approximately 5,000 transplants/year to 10,000 transplants/year in 2015. If these trends hold true, will centers have to make major changes and expenditures to accommodate these changes? What type and magnitude of facilities, resources and manpower will centers require? What will be the role of non-physician providers in addressing physician shortages? What innovative delivery of care models will provide the most efficient post-transplant care to patients? How will centers coordinate the long-term care of an increasing population of transplant survivors with complex medical care needs? As centers address capacity needs, they will also have to consider disparities in access to transplantation.6 These important questions will have to be considered as policy makers evaluate various methods to address projected shortages of HCT workforce and capacity. Given the diversity of centers in the country with respect to size and resources, a multitude of strategies will be required to meet individual center needs for growth and expansion.
Our analysis has some limitations. First, the Transplant Center Network Renewal Survey is an administrative survey and center responses are not audited for accuracy. For 2009, we compared the number of allogeneic transplants reported by centers on the survey with those reported to the Center for International Blood and Marrow Transplant Research (CIBMTR). The Transplant Center Network Renewal Survey captured 89% of allogeneic HCT activity among NMDP network centers in the US for 2009. Also, beds and physicians at transplant centers typically are not exclusive for allogeneic HCT and most likely represent resources that are shared with autologous HCT recipients, or even other hospitalized patients. The relatively small volume of allogeneic HCT at some large and very large centers may be secondary to large number of autologous transplants being performed at those centers. We could not account for autologous transplant activity since the survey does not collect this information. Finally, we could not consider individual center level changes (e.g. changes in models of care, center reorganization) that may have impacted changes in transplant activity, beds or physician FTE's over time.
Our study provides important description of allogeneic transplant activity and transplant center bed and physician capacity of US centers. Our data will help policy makers at the national and institutional level plan for the anticipated growth in transplantation. The NMDP in collaboration with the ASBMT and other stakeholders and experts has organized a multi-year symposium, `HSCT in 2020: System Capacity Initiative', that will evaluate long-term transplant capacity challenges and personnel shortages and will suggest recommendations to address them.
ACKNOWLEDGEMENTS
We thank Emilie Clancy from Membership Services, National Marrow Donor Program, for providing data from the Transplant Center Network Renewal Survey. We also acknowledge Ellen Denzen, Shaveta Nayyar and Tammy Payton from the Center for International Blood and Marrow Transplant Research – Patient Services Health Services Research Program for their assistance with this study.
Footnotes
Publisher's Disclaimer: This is a PDF file of an unedited manuscript that has been accepted for publication. As a service to our customers we are providing this early version of the manuscript. The manuscript will undergo copyediting, typesetting, and review of the resulting proof before it is published in its final citable form. Please note that during the production process errors may be discovered which could affect the content, and all legal disclaimers that apply to the journal pertain.
Financial disclosure statement: None of the authors has any relevant financial conflicts of interest to disclose
REFERENCES
- 1.Gajewski JL, Lemaistre CF, Silver SM, et al. Impending Challenges in the Hematopoietic Stem Cell Transplant Physician Workforce. Biol Blood Marrow Transplant. 2009;15:1493–1501. doi: 10.1016/j.bbmt.2009.08.022. [DOI] [PubMed] [Google Scholar]
- 2.Schriber JR, Anasetti C, Heslop HE, Leahigh AK. Preparing for growth: current capacity and challenges in hematopoietic stem cell transplantation programs. Biol Blood Marrow Transplant. 2010;16:595–597. doi: 10.1016/j.bbmt.2010.02.010. [DOI] [PubMed] [Google Scholar]
- 3.Ballen KK, King RJ, Chitphakdithai P, et al. The national marrow donor program 20 years of unrelated donor hematopoietic cell transplantation. Biol Blood Marrow Transplant. 2008;14:2–7. doi: 10.1016/j.bbmt.2008.05.017. [DOI] [PubMed] [Google Scholar]
- 4.Karanes C, Nelson GO, Chitphakdithai P, et al. Twenty years of unrelated donor hematopoietic cell transplantation for adult recipients facilitated by the National Marrow Donor Program. Biol Blood Marrow Transplant. 2008;14:8–15. doi: 10.1016/j.bbmt.2008.06.006. [DOI] [PubMed] [Google Scholar]
- 5.MacMillan ML, Davies SM, Nelson GO, et al. Twenty years of unrelated donor bone marrow transplantation for pediatric acute leukemia facilitated by the National Marrow Donor Program. Biol Blood Marrow Transplant. 2008;14:16–22. doi: 10.1016/j.bbmt.2008.05.019. [DOI] [PubMed] [Google Scholar]
- 6.Majhail NS, Omondi NA, Denzen E, Murphy EA, Rizzo JD. Access to hematopoietic cell transplantation in the United States. Biol Blood Marrow Transplant. 2010;16:1070–1075. doi: 10.1016/j.bbmt.2009.12.529. [DOI] [PMC free article] [PubMed] [Google Scholar]


