

SUMMARY
Background
Over 1,000 reports have been published during the past two decades on associations between genetic variants in candidate genes and breast cancer risk. Results have been generally inconsistent. We conducted literature searches and meta-analyses to provide a field synopsis of the current understanding of the genetic architecture of breast cancer risk.
Methods
Systematic literature searches for candidate gene association studies of breast cancer risk were conducted in two stages using PubMed on or before February 28, 2010. A total of 24,500 publications were identified, of which, 1,059 were deemed eligible for inclusion. Meta-analyses were conducted for 279 genetic variants in 128 candidate genes or chromosomal loci that had a minimum of three data sources available. Variants with significant associations by meta-analysis were assessed using the Venice criteria and scored as having strong, moderate, or weak cumulative evidence for an association with breast cancer risk.
Findings
Fifty-one variants in 40 genes showed statistically significant associations with breast cancer risk. Cumulative epidemiologic evidence for an association with breast cancer risk was graded as strong for 10 variants in six genes (ATM, CASP8, CHEK2, CTLA4, NBN, and TP53), moderate for four variants in four genes (ATM, CYP19A1, TERT, and XRCC3), and weak for 37 additional variants. Additionally, in meta-analyses that included a minimum of 10,000 cases and 10,000 controls, convincing evidence of no association with breast cancer risk was identified for 45 variants in 37 genes.
Interpretation
While most genetic variants evaluated in previous candidate gene studies showed no association with breast cancer risk in meta-analyses, 14 variants in 9 genes were found to have moderate to strong evidence for an association with breast cancer risk. Further evaluation of these variants is warranted.
INTRODUCTION
Breast cancer is a multifactorial disease caused by complex inherited and environmental factors (1). To date, genetic studies have identified and confirmed four rare high-penetrance genes (BRCA1, BRCA2, TP53 and PTEN), four rare moderate-penetrance genes (CHEK2, ATM, BRIP1 and PALB2), and approximately 20 common low-penetrance variants in 19 genes or loci that contribute to a woman’s risk of breast cancer (Table 1) (2–12). Virtually all of the common genetic risk variants were identified from recent genome-wide association studies (GWAS). While this list represents the culmination of our current understanding of the genetic architecture of breast cancer, together, these genes and loci are estimated to account for only 28% of the inherited causes of the disease (11).
Table 1.
Summary of Established Genetic Factors Associated with Breast Cancer Risk
| A: High- and moderate-penetrance breast cancer susceptibility genes
| |||
|---|---|---|---|
| Gene | Variants | Relative Risk | Population Frequency (% ) |
| BRCA1 | Multiple mutations | >10 | 0.1 |
| BRCA2 | Multiple mutations | >10 | 0.1 |
| TP53 | Multiple mutations | >10 | <0.1 |
| PTEN | Multiple mutations | >10 | <0.1 |
| ATM | Truncating and missense mutations | 2–4 | <0.5 |
| CHEK2 | 1100delC | 2–5 | 0.7 |
| BRIP1 | Truncating mutations | 2–3 | 0.1 |
| PALB2 | Truncating mutations | 2–5 | <0.1 |
| B: Low-penetrance loci associated with breast cancer risk identified by genome-wide association studies
| |||
|---|---|---|---|
| Locus | Variant | OR (95% CI) 1 | MAF (% ) 2 |
| 1p11/NOTCH2/FCGR1B | rs11249433 | 1.14 (1.10–1.19) | 39 |
| 2q35 | rs13387042 | 1.20 (1.14–1.26) | 50 |
| 3p24/SLC4A7/NEK10 | rs4973768 | 1.11 (1.08–1.13) | 46 |
| 5p12/MRPS30 | rs4415084 | 1.16 (1.10–1.21) | 40 |
| rs10941679 | 1.19 (1.13–1.26) | 24 | |
| 5q11/MAP3K1 | rs889312 | 1.13 (1.10–1.16) | 28 |
| 6q22/ECHDC1/RNF146 | rs2180341 | 1.41 (1.25–1.59) | 21 |
| 6q25/ESR1/C6orf97 | rs2046210 | 1.29 (1.21–1.37) | 35 |
| 8q24 | rs13281615 | 1.08 (1.05–1.11) | 40 |
| 9p21/CDKN2A/2B | rs1011970 | 1.09 (1.04–1.14) | 17 |
| 10p15/ANKRD16/FBXO18 | rs2380205 | 0.94 (0.91–0.98) | 43 |
| 10q21/ZNF365 | rs10995190 | 0.86 (0.82–0.91) | 15 |
| 10q22/ZMIZ1 | rs704010 | 1.07 (1.03–1.11) | 39 |
| 10q26/FGFR2 | rs2981582 | 1.26 (1.23–1.30) | 38 |
| rs1219648 | 1.27 (1.18–1.36) | 40 | |
| 11p15/LSP1 | rs3817198 | 1.07 (1.04–1.11) | 30 |
| 11q13 | rs614367 | 1.15 (1.10–1.20) | 15 |
| 14q24/RAD51L1 | rs999737 | 0.89 (0.85–0.93) | 24 |
| 16q12/TOX3/LOC643714 | rs3803662 | 1.28 (1.21–1.35) | 27 |
| rs4784227 | 1.25 (1.20–1.31) | 24 | |
| 17q22/COX11 | rs6504950 | 0.95 (0.92–0.97) | 27 |
| 19p13/ABHD8/ANKLE1/C19orf62 | rs2363956 | 0.80 (0.74–0.87) | 47 |
Odds ratio and 95% confidence interval from original report of association with breast cancer risk
Minor allele frequency
Despite the prominence and growing body of results from GWAS, candidate-gene association studies remain the most prevalent type of investigation to identify common breast cancer susceptibility alleles. More than 1,000 candidate-gene breast cancer association studies have been published in the last two decades, which have evaluated more than 7,000 genetic variants (webappendix, page 1). While some of these variants may represent true associations with breast cancer risk, many more are false-positive associations which fail to replicate among additional study populations. Determining if associations are real has generally been conducted by examining the totality of the epidemiologic evidence in conjunction with biological plausibility, in the form of a meta-analysis. While most previous meta-analyses focus on one variant, or variants within one gene, recent meta-analyses have begun to increase in size and scope (13, 14). Additionally, guidelines for the assessment of cumulative evidence for genetic associations, which have become known as the Venice criteria, have been set forth by the Human Genome Epidemiology Network Working Group (15, 16).
Given the plethora of candidate-gene association studies, the necessity for replication across studies to identify markers truly associated with disease risk (17–19), and the criteria provided to evaluate genetic associations with disease, this study was undertaken in an attempt to evaluate all candidate-gene association studies in the field of breast cancer, conduct meta-analyses for variants with sufficient data available, and provide a field synopsis on our current understanding of the genetic architecture of breast cancer risk.
METHODS
All methodology was drawn from guidelines proposed by the Human Genome Epidemiology Network for the systematic review of genetic association studies (15, 16, 20, 21).
Study Eligibility, Criteria and Literature Searches
Studies were eligible to be included if they met the following criteria. First, publications must have been either online or in peer-review journals, in the English language, on or before February 28, 2010. Second, the study design must be a case-control, cohort, or cross-sectional association study conducted on humans. Third, breast cancer cases must have been diagnosed by pathological and/or histological examination. Fourth, the study must have provided sufficient information such that the genotype frequencies for both breast cancer cases and controls could be determined. High penetrance germline mutations in known breast cancer susceptibility genes, such as BRCA1, BRCA2, PTEN, and TP53 were not included in this meta-analysis. Because GWAS-identified variants have been convincingly replicated by multiple studies, they also were not included in this meta-analysis.
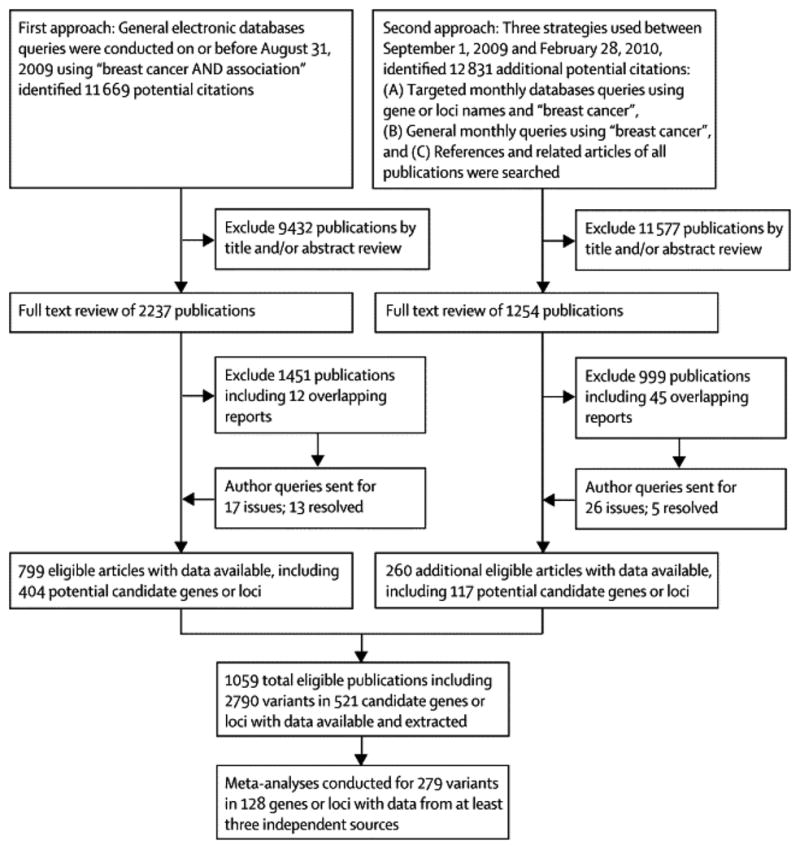
To identify all relevant publications, we employed a two-stage search strategy (Figure 1). First, PubMed was queried with the terms ‘breast cancer AND association’ to find all studies published prior to August 31, 2009 that included associations with breast cancer. This search yielded 11,699 publications, which were screened by title and abstract, or a full text review if necessary, to identify 799 publications that met our eligibility criteria; these publications included variants within 404 candidate genes or chromosomal loci. Second, targeted monthly searches of PubMed between September 01, 2009 and February 28, 2010 were conducted using the 404 candidate genes or chromosomal loci, for example ‘SHBG’ or ‘rs6259’ in conjunction with ‘breast cancer’ as query terms. General monthly searches between September 01, 2009 and February 28, 2010 were also conducted using the term ‘breast cancer’. Finally, the references of all included studies were screened, as well as reference lists from review and meta-analyses; the PubMed option ‘Related Articles’ was also used to search for additional potential publications. These three components of our second stage search strategy identified a total of 12,831 publications, of which 260 met our eligibility criteria; these included variants within 117 additional candidate genes or chromosomal loci. Thus, a total of 24,500 publications were screened by title, abstract, or full text if necessary, to identify a total of 1,059 eligible publications including 521 candidate genes or chromosomal regions and 2,787 genetic variants.
Figure 1.
Data Extraction and Preparation
Data were extracted by the first author (BZ) and checked by the second author (ABF). In the case of sequential or multiple publications of the same or overlapping data, only the publication that reported results from the largest or most recent analysis was included. Publications with completely redundant information were not included (N=57). If a publication included multiple source or study populations, data was extracted separately if possible. Data extracted from each eligible publication included first author, year published, PMID number, study design, method of case selection, matching factors if applicable, source population, ethnicity of participants, inclusion criteria of cases and controls, mean ages of cases and controls, sample size, genes, variants, major and minor alleles, genotype counts for cases and controls, Hardy-Weinberg Equilibrium (HWE) among controls, genotyping methods used, whether these methods had been validated, and whether genotyping was conducted in a blinded manner. Specifically, case selection was classified as population-based, hospital-based, or mixed. Ethnicity was classified as either African, Asian (East Asian descent), Caucasian (European descent), or other (including mixed) based on the ethnicity of at least 80% of the study population (22). If ethnicity was not reported, we considered the ethnicity of the source population based on the country in which the study was conducted (22). The most current gene names (http://preview.ncbi.nlm.nih.gov/gene/) and variant accession numbers (http://www.ncbi.nlm.nih.gov/snp/) were used according to respective NCBI databases (23). For variants without accession numbers, the most commonly used name, such as nucleotide position (i.e. 7271T>G) or protein residue (i.e. Val2424Gly) was used. Minor and major alleles of variants among populations of specific ethnicities were determined according to dbSNP (http://www.ncbi.nlm.nih.gov/snp/). Genetic variants from publications were checked for inversion of major and minor alleles; if the reported MAF was different from that in dbSNP by 20% or greater, the authors were contacted (N=7). Additionally, if reported alleles differed from those in dbSNP, authors were contacted (N=10). Responses were received and issues were resolved for six and seven publications, respectively, so these studies were included. Further, authors were contacted for 26 publications that were initially ineligible due to insufficient information for data extraction; responses were received for five queries, so these publications were included. Information on genes and variants from the 21 publications without sufficient information to be included in our meta-analyses is available in the webappendix (pages 6–16), Thus, 1,059 eligible publications had sufficient data available for extraction and meta-analysis inclusion.
Statistical Analysis
All statistical tests in this study were two-tailed and P values ≤ 0.05 were considered statistically significant unless stated otherwise. Statistical analyses were conducted with Stata, version 11.0 (Stata Corporation, College Station, TX). For meta-analysis of any variant, a minimum of three data sources was required; this decision was made to stabilize the heterogeneity test statistic (I2), and to ensure that sensitivity analyses could be conducted. Eligible publications included a total of 2,787 genetic variants, of which 279 had at least three data sources for meta-analysis. For common variants (MAF≥5%), effects associated with minor alleles were evaluated. Because major and minor alleles can be reversed in populations of different ethnicities, averaged MAFs across studies may be greater than 50%; when this occurred, the minor allele among Caucasians was used as the minor allele in all analyses. For copy number variations (CNVs), mitochondrial (mtDNA) polymorphisms, and phenotype traits, the less prevalent variant or trait was evaluated for associated effects unless otherwise stated. Hardy-Weinberg equilibrium (HWE) among controls of each study was assessed by Fisher’s exact test to compare observed and expected genotype frequencies (24). Estimates of association with cancer risk were evaluated by odds ratios (ORs) and corresponding 95% confidence intervals (CIs) using the random-effects method of DerSimonian and Laird (25). For common genetic variants, allelic, dominant, and recessive models were computed; for rare variants, CNVs, mtDNA polymorphisms, and phenotype traits, only the appropriate dominant or recessive model was employed unless stated otherwise. Analyses stratified by ethnicity were conducted whenever data permitted; a minimum of three data sources were required for these ethnicity specific meta-analyses. To minimize false negative errors, of variants that showed no evidence of associations with breast cancer risk in meta-analyses, only those with a minimum of 10,000 cases and 10,000 controls were selected for presentation.
Evaluation of our meta-analysis results included test of heterogeneity, sensitivity analyses, and examination for bias. Heterogeneity between studies was assessed by Cochran Q statistic and P value < 0.10 indicated statistically significant heterogeneity of studies within meta-analyses (26). We also used the I2 metric to quantify the heterogeneity (27). Generally, the I2 values less than 25% correspond to mild heterogeneity, and values between 25% and 50% correspond to moderate heterogeneity, whereas values greater than 50% correspond to large heterogeneity between studies. Sensitivity analyses were conducted to assess the robustness and examine the results of our meta-analyses for possible bias. For variants with significant findings, firstly, the first published or first positive report, defined as the earliest study to publish a significant association (P≤0.05), was excluded, then all small studies (<500 cases) were excluded, and finally, for common variants, all studies in which controls were not in HWE (P≤0.05) were excluded. Potential publication bias was evaluated by symmetry of funnel plots of effect sizes versus standard errors; Begg’s test was used to identify significant asymmetry (28). Bias due to results from small studies was evaluated by modified Egger tests which corrects for potential type I errors (29). An excess of significant findings was evaluated by the method of Ioannidis and Trikalinos (30) for each individual meta-analysis, as well as for groups of meta-analyses, defined by significance of association with breast cancer risk, degree of heterogeneity (large or not), or ethnicity (Caucasian, Asian, or other). P values < 0.10 were considered statistically significant in the modified Egger test and the test for excess of significant findings.
Assessment of Cumulative Evidence
We applied the Venice criteria to all significant associations identified by meta-analysis in our report to evaluate the epidemiologic credibility of each (15, 16). Credibility was defined as strong, moderate, or weak, based on grades of ‘A’, ‘B’, or ‘C’ in three categories: amount of evidence, replication of the association, and protection from bias (15, 16). Amount of evidence was graded by the sum of test alleles or genotypes among both cases and controls in the meta-analysis; ‘A’ for over 1,000, ‘B’ for 100 to 1,000, and ‘C’ for less than 100. Caution was taken when applying this criterion to very rare variants (MAF≤0. 5%), as scores of ‘A’ are unobtainable. Replication was graded by the heterogeneity statistic; ‘A’ for I2 < 25%, ‘B’ for I2 between 25% and 50%, and ‘C’ for I2 >50%. Protection from bias was graded as ‘A’ if there was no observable bias and bias was unlikely to explain the presence of the association, ‘B’ if bias could be present or could explain the presence of the association, or ‘C’ if bias was evident or was likely to explain the presence of the association. Assessment of protection from bias also included consideration of the magnitude of the association; a score of ‘C’ was assigned to an association with a summary OR < 1.15 unless the association had been replicated prospectively by multiple studies with no evidence of publication bias. Thus, the cumulative epidemiologic evidence of statistically significant associations in meta-analyses were considered to be strong if all three grades were ‘A’, moderate if all three grades were either ‘A’ or ‘B’, or weak, if any grades were ‘C’.
Role of the Funding Source
This study was funded by the U.S. National Cancer Institute. The study sponsor had no role in the study design, data collection, analysis, and interpretation, or writing of the report. All authors had full access to all the data in the study and had final responsibility for the decision to submit for publication.
RESULTS
Meta-Analyses of Associations with Breast Cancer Risk
A total of 1,059 publications including 521 genes or chromosomal loci and 2,787 variants were eligible to be included in our analysis (Figure 1). The majority (91%, N=961) of these reports were published since 2000, with the highest number published in 2008 (N=154) (webappendix, page 1). The average number of variants analyzed per publication was consistently less than five until 2005, and then dramatically increased, reaching a maximum of 15.6 in 2008. The median and mean sample size of cases included in the 1,059 publications was 461 and 1,037, respectively (range: 26–35,331). The median and mean sample size of controls was 503 and 1,261, respectively (range: 24–37,214). Meta-analyses were conducted for 279 genetic variants (235 common and 44 rare) in 128 candidate genes or chromosomal loci that had a minimum of three data sources available (webappendix, pages 2–5). The average pooled sample size of the 279 meta-analyses was 14,952 (range: 616–92,701); each meta-analysis included an average of 8.6 independent studies (range: 3–61). Common variants (MAF ≥ 5%) included synonymous SNPs (N=14), nonsynonymous SNPs (N=95), intronic or intragenic SNPs (N=33), SNPs in 5′ or 3′ UTRs (N=68), mitochondrial (mtDNA) polymorphisms (N=9), short tandem repeats (STR) or microsatellite polymorphisms (N=10), copy number variations (CNVs) (N=2), phenotypes (N=3), and one frameshift polymorphism. Rare variants (MAF <5%) included nonsynonymous SNPs or mutations (N=27), truncating or splice-junction mutations (N=6), intronic or intragenic SNPs (N=3), SNPs in 5′ or 3′ UTRs (N=2), mtDNA polymorphisms (N=4), and one STR and CNV each.
Using all available data, 29 variants within 20 genes (ATM, CASP8, CHEK2, CTLA4, CYP19A1, ERCC2, ESR1, GSTM1, GSTT1, HSD17B1, IFNG, IGF1, LRTOMT, MTHFR, NBN, NUMA1, TP53, TYMS, VDR, and WRN) were found to have statistically significant associations with breast cancer risk by meta-analysis (Table 2A). These meta-analyses included an average of 13.1 studies (range: 3–61) and 19,591 subjects (range: 721–92,701). Strong associations with breast cancer risk (ORs greater than two) were seen for two rare truncating mutations (ATM E1978X and NBN 657del5), as well as for three rare variants in CHEK2 (IVS2+1G>A, a CNV deletion (5.5kb), and 1100delC). Moderate associations with breast cancer risk (ORs greater than 1.5) were seen for three common variants, including nonsynonymous polymorphisms in CHEK2 (rs17879961) and LRTOMT (rs673478) and a short tandem repeat in CYP19A1 ((TTTA)10). All four CHEK2 variants had associations with breast cancer risk at P < 10−5, as did two common nonsynonymous SNPs (CASP8 rs1045485 and CTLA4 rs231775) and one deletion polymorphism (GSTM1). Additional significant associations with breast cancer risk by meta-analysis were found for nine non-coding SNPs (CASP8 rs6435074 and rs6723097, ESR1 rs3020314, HSD17B1 rs676387, IFNG rs2430561, IGF1 rs6220, NUMA1 rs3018301, TP53 rs12947788 and rs12951053), five nonsynonymous SNPs (ATM rs1800057, ERCC2 rs13181, MTHFR rs1801133, VDR rs731236, and WRN rs1346044), one synonymous SNP (ESR1 rs1801132), one deletion (GSTT1), one insertion/deletion polymorphism (TP53 rs17878362), and one short tandem repeat (TYMS). Some meta-analyses included women of only one ethnicity, as all available data included only one ethnicity. Fourteen variants with significant associations with breast cancer risk were studied only among Caucasian women, one significantly associated variant had data available only among Asian women.
Table 2.
Genetic Variants Showing Significant Associations with Breast Cancer Risk at P ≤ 0.05 in Meta-Analyses
| Gene | Variant | Comparison 1 | Frequency (%) 2 | Ethnicity | Number Evaluated
|
Breast Cancer Risk
|
Heterogeneity
|
Venice Criteria Grade 3 | Cummulative Evide nce of Association 4 | ||||
|---|---|---|---|---|---|---|---|---|---|---|---|---|---|
| Studies | Cases | Controls | OR (95% CI) | P | P value | I2 | |||||||
|
A: Associations identified by analyses of all available data
| |||||||||||||
| ATM | 5932G>T (E1978X) | Carriers vs. noncarriers | 0.05 | Caucasian * | 4 | 6,593 | 3,793 | 4.56 (1.35–15.42) | 0.015 | 1.000 | 0 | × A A | +++ |
| ATM | rs1800057 (Pro1054Arg) | (CG+GG) vs. CC | 5.06 | All ancestries | 9 | 4,998 | 6,122 | 1.20 (1.01–1.44) | 0.038 | 0.466 | 0 | B A A | ++ |
| CASP8 | rs1045485 (Asp302His) | C vs. G | 13.29 | Caucasian * | 17 | 18,382 | 19,419 | 0.89 (0.85–0.93) | 4.65×10⁻⁸ | 0.992 | 0 | A A A | +++ |
| CASP8 | rs6435074 (A34767C) | A vs. C | 25.72 | Caucasian * | 3 | 2,677 | 3,093 | 1.12 (1.03–1.22) | 0.010 | 0.865 | 0 | A A C | + |
| CASP8 | rs6723097 (A35438C) | A vs. C | 36.33 | Caucasian * | 3 | 2,610 | 3,040 | 1.16 (1.07–1.25) | 1.91×10⁻⁴ | 0.997 | 0 | A A A | +++ |
| CHEK2 | IVS2+1G>A | Carriers vs. noncarriers | 0.39 | Caucasian * | 5 | 9,970 | 7,526 | 3.07 (2.03–4.63) | 9.82×10⁻⁸ | 0.707 | 0 | × A A | +++ |
| CHEK2 | rs17879961 (I157T) | Carriers vs. noncarriers | 4.19 | Caucasian * | 8 | 13,311 | 10,817 | 1.52 (1.31–1.77) | 4.76×10⁻⁸ | 0.324 | 14 | A A A | +++ |
| CHEK2 | Deletion | Carriers vs. noncarriers | 0.30 | Caucasian * | 5 | 10,543 | 8,447 | 2.53 (1.61–3.97) | 6.33×10⁻⁵ | 0.419 | 0 | × A A | +++ |
| CHEK2 | 1100delC | Carriers vs. noncarriers | 0.49 | All ancestries | 47 | 41,791 | 50,910 | 3.10 (2.59–3.71) | <10−20 | 0.315 | 8 | × A A | +++ |
| CTLA4 | rs231775 (Thr17Ala) | A vs. G | 38.54 | Asian * | 3 | 2,214 | 2,288 | 1.25 (1.14–1.37) | 1.59×10⁻⁶ | 0.676 | 0 | A A A | +++ |
| CYP19A1 | (TTTA)10 | R10 vs R7 | 1.76 | All ancestries | 13 | 7,979 | 8,564 | 1.53 (1.05–2.22) | 0.027 | 0.044 | 45 | B B A | ++ |
| ERCC2 | rs13181 (Lys751Gln) | C vs. A | 34.62 | All ancestries | 33 | 15,843 | 16,827 | 1.13 (1.05–1.22) | 0.002 | 0.000 | 76 | A C C | + |
| ESR1 | rs3020314 (C5029T) | C vs. T | 31.73 | Caucasian * | 3 | 5,189 | 5,614 | 1.12 (1.06–1.18) | 1.09×10⁻⁴ | 0.535 | 0 | A A C | + |
| ESR1 | rs1801132 (Pro325Pro) | G vs. C | 23.83 | All ancestries | 14 | 10,836 | 14,685 | 0.95 (0.90–1.00) | 0.038 | 0.297 | 14 | A A C | + |
| GSTM1 | Deletion | Null vs. present | 48.64 | All ancestries | 61 | 21,289 | 24,850 | 1.11 (1.06–1.18) | 8.86×10⁻⁵ | 0.003 | 36 | A B C | + |
| GSTT1 | Deletion | Null vs. present | 23.37 | All ancestries | 43 | 16,518 | 19,423 | 1.11 (1.03–1.20) | 0.006 | 0.005 | 40 | A B C | + |
| HSD17B1 | rs676387 (C-150A) | A vs. C | 27.13 | Caucasian * | 3 | 11,794 | 14,205 | 1.05 (1.00–1.09) | 0.050 | 0.278 | 22 | A A C | + |
| IFNG | rs2430561 (T874A) | A vs. T | 43.32 | All ancestries | 3 | 324 | 397 | 1.25 (1.01–1.54) | 0.039 | 0.691 | 0 | B A C | + |
| IGF1 | rs6220 (C84864T) | T vs. C | 29.50 | All ancestries | 3 | 6,213 | 7,192 | 1.06 (1.00–1.11) | 0.048 | 0.656 | 0 | A A C | + |
| LRTOMT | rs673478 (G-239A) | C vs. T | 4.51 | Caucasian * | 3 | 607 | 587 | 1.53 (1.07–2.18) | 0.020 | 0.683 | 0 | B A C | + |
| MTHFR | rs1801133 (Ala222Val) | T vs. C | 32.24 | All ancestries | 46 | 21,696 | 27,229 | 1.04 (1.00–1.07) | 0.041 | 0.115 | 21 | A A C | + |
| NBN | 657del5 | Carriers vs. noncarriers | 0.36 | Caucasian * | 7 | 7,082 | 9,504 | 2.42 (1.54–3.80) | 1.18×10⁻⁴ | 0.736 | 0 | × A A | +++ |
| NUMA1 | rs3018301 (G-510A) | A vs. G | 5.17 | Caucasian * | 3 | 606 | 590 | 1.45 (1.03–2.03) | 0.033 | 0.911 | 0 | B A C | + |
| TP53 | rs12947788 (T72C) | T vs. C | 8.61 | Caucasian * | 3 | 4,357 | 5,224 | 1.11 (1.01–1.23) | 0.033 | 0.568 | 0 | A A C | + |
| TP53 | rs12951053 (T92G) | G vs. T | 8.67 | Caucasian * | 3 | 4,349 | 5,247 | 1.12 (1.01–1.23) | 0.027 | 0.618 | 0 | A A C | + |
| TP53 | rs17878362 (16bp Del/Ins) | Insertion vs. deletion | 15.40 | All ancestries | 12 | 2,961 | 3,496 | 1.15 (1.04–1.26) | 0.007 | 0.520 | 0 | A A A | +++ |
| TYMS | 28-bp tandem repeat | 2R vs. 3R | 33.56 | All ancestries | 6 | 2,709 | 3,400 | 1.08 (1.00–1.17) | 0.044 | 0.734 | 0 | A A C | + |
| VDR | rs731236 (Ile352Met) | C vs. T | 35.85 | All ancestries | 14 | 6,829 | 8,461 | 1.06 (1.00–1.12) | 0.034 | 0.357 | 9 | A A C | + |
| WRN | rs1346044 (Cys1367Arg) | C vs. T | 14.16 | All ancestries | 3 | 2,747 | 3,555 | 1.14 (1.02–1.27) | 0.019 | 0.330 | 10 | A A C | + |
|
| |||||||||||||
|
B: Associations identified from additional analyses by ethnic group
| |||||||||||||
| AURKA | rs1047972 (Val57Ile) | A vs. G | 16.74 | Caucasian | 4 | 7,309 | 10,158 | 0.93 (0.88–0.98) | 0.011 | 0.482 | 0 | A A C | + |
| ESR1 | rs2234693 (PvuII,T397C) | C vs. T | 39.78 | Asian | 8 | 4,563 | 4,503 | 0.94 (0.89–1.00) | 0.050 | 0.592 | 0 | A A C | + |
| GSTP1 | rs1695 (Ile105Val) | G vs. A | 19.38 | Asian | 6 | 4,634 | 5,241 | 1.07 (1.00–1.15) | 0.048 | 0.436 | 0 | A A C | + |
| MTR | rs1805087 (Asp919Gly) | G vs. A | 21.05 | Caucasian | 5 | 5,612 | 6,671 | 0.92 (0.86–0.99) | 0.023 | 0.335 | 12 | A A C | + |
| NQO1 | rs1800566 (Pro187Ser) | T vs. C | 16.58 | Caucasian | 5 | 1,488 | 1,695 | 1.27 (1.03–1.56) | 0.023 | 0.049 | 58 | A C C | + |
| TNF | rs1800629 (G-308A) | A vs. G | 17.01 | Caucasian | 9 | 10,664 | 13,048 | 0.92 (0.87–0.96) | 4.48×10⁻⁴ | 0.436 | 0 | A A C | + |
| XRCC3 | rs861539 (Thr241Met) | T vs. C | 10.98 | Asian | 3 | 1,283 | 1,120 | 1.32 (1.08–1.60) | 0.007 | 0.855 | 0 | B A A | ++ |
Allelic contrast for common variants, or genetic comparison for rare variants; R = repeat
Minor allele frequency for common variants, or population frequency of test group for rare variants
Venice Criteria grades are in the order of amount of evidence, replication of the association and protection from bias; five rare variants were not scored for amount of evidence (×)
Cummulative epidemiological evidence as graded by the Venice criteria as strong (+++), moderate (++), or weak (+) for association with breast cancer risk
Only Caucasian or Asian data was available for meta-analysis
Moderate linkage disequilibrium (LD) was found between ESR1 rs3020314 and rs1801132 ; high LD was found between CASP8 rs6435074 and rs6723097 ; perfect LD was found between TP53 rs12947788 and rs12951053
Seven additional variants were found to be significantly associated with breast cancer risk in meta-analyses stratified by ethnicity conducted with a minimum of three data sources (Table 2B). Among Caucasians, these analyses were conducted for 206 variants and included an average of 7.8 studies (range: 3–38) and 15,987 subjects (range: 1,194–81,172). Among Asians, these analyses were conducted for 49 variants and included an average of 5.0 studies (range: 3–14) and 5,688 subjects (range: 1,370–14,901). Three common nonsynonymous polymorphisms (AURKA rs1047972, MTR rs1805087, and NQO1 rs1800566) had evidence of associations with breast cancer risk among Caucasian women, but not among Asian women. Three common SNPs had associations with breast cancer risk among Asian women, including two nonsynonymous polymorphisms (GSTP1 rs1695 and XRCC3 rs861539) and one intronic variant (ESR1 rs2234693); there was no evidence for associations with breast cancer risk among Caucasian women. One noncoding variant (TNF rs1800629) reached statistical significance for a protective effect only among Caucasian women, although the association did not seem to differ between Asian and Caucasian women. Instead, significance among all available data for this TNF variant seemed to be attenuated by including studies conducted among women of ethnicities other than Asian or European ancestries (data not shown).
All genetic models of association presented in Table 2 are from allelic contrasts, except where data did not permit, such as for rare variants. Among the 36 variants found to have a significant association with breast cancer risk, there was sufficient data to evaluate 26 under dominant and recessive models. Of these, the association with breast cancer risk was no longer statistically significant for 11 and 10 variants, respectively, when dominant and recessive effect models were employed. Although not significant in allelic contrasts, 15 additional common genetic variants were found to have significant associations with breast cancer risk using either dominant or recessive genetic effect models in meta-analyses (Table 3). Of these, the association with the largest magnitude was for a nonsynonymous SNP (NCOA3 rs2230782), while the most significant association was for a noncoding variant (TERT rs2853669). No additional significant associations were found in ethnicity-specific analyses using either dominant or recessive genetic models.
Table 3.
Additional Genetic Variants Showing an Association with Breast Cancer at P ≤ 0.05 in Meta-Analyses Using Dominant or Recessive Models
| Gene | Variant | Alleles 1 | MAF (%) | Number Evaluated
|
Allelic Contrasts
|
Best Genetic Model
|
Venice Criteria Grade 3 | Cummulative Evidence of Association 4 | |||||||
|---|---|---|---|---|---|---|---|---|---|---|---|---|---|---|---|
| Studies | Cases | Controls | OR (95% CI) | P value | I2 | Model 2 | OR (95% CI) | P value | I2 | ||||||
| BARD1 | rs1048108 (Pro24Ser) | T vs. C | 35.52 | 4 | 6,155 | 6,499 | 0.90 (0.82–1.00) | 0.058 | 60 | DOM | 0.87 (0.76–0.99) | 0.040 | 58 | A C C | + |
| CHR11 | rs7931342 (T14300292G) | T vs. G | 48.76 | 3 | 8,093 | 8,490 | 0.96 (0.90–1.02) | 0.147 | 42 | REC | 0.91 (0.85–0.98) | 0.011 | 0 | A A C | + |
| CYP1B1 | rs1056836 (Leu432Val) | G vs. C | 41.72 | 30 | 20,055 | 22,405 | 0.97 (0.92–1.01) | 0.136 | 43 | REC | 0.93 (0.88–0.98) | 0.006 | 0 | A A C | + |
| ESR1 | rs9340799 (A156751G) | G vs. A | 32.68 | 19 | 16,535 | 27,162 | 0.97 (0.93–1.01) | 0.126 | 28 | REC | 0.91 (0.85–0.98) | 0.011 | 0 | A A C | + |
| GNB3 | rs5443 (Ser275Ser) | T vs. C | 29.82 | 3 | 808 | 1,016 | 1.08 (0.93–1.24) | 0.304 | 0 | REC | 1.44 (1.05–1.97) | 0.023 | 0 | B A C | + |
| IGFBP3 | rs2854744 (C-202A) | A vs. C | 48.12 | 20 | 28,352 | 38,550 | 0.98 (0.96–1.00) | 0.114 | 0 | REC | 0.96 (0.93–1.00) | 0.044 | 0 | A A C | + |
| IL1A | rs17561 (Ala114Ser) | T vs. G | 29.84 | 3 | 1,929 | 1,944 | 1.00 (0.80–1.25) | 0.990 | 79 | REC | 1.27 (1.02–1.58) | 0.031 | 0 | B A C | + |
| IL10 | rs1800896 (G-1082A) | G vs. A | 46.91 | 4 | 1,124 | 1,218 | 1.17 (0.97–1.43) | 0.105 | 59 | REC | 1.27 (1.02–1.58) | 0.034 | 15 | B A C | + |
| LEPR | rs1137101 (Gln223Arg) | A vs. G | 33.37 | 5 | 1,851 | 2,074 | 1.46 (1.00–2.15) | 0.051 | 90 | DOM | 1.46 (1.00–2.14) | 0.050 | 80 | A C C | + |
| MSH3 | rs26279 (Ala1045Thr) | G vs. A | 31.80 | 3 | 659 | 1,025 | 1.13 (0.97–1.31) | 0.116 | 0 | REC | 1.37 (1.01–1.86) | 0.044 | 0 | B A C | + |
| NCOA3 | rs2230782 (Gln586His) | C vs. G | 8.19 | 3 | 3,252 | 3,871 | 0.95 (0.84–1.08) | 0.439 | 0 | REC | 0.53 (0.30–0.95) | 0.034 | 0 | C A C | + |
| POR | rs10262966 (Gly5Gly) | G vs. A | 22.63 | 3 | 1,038 | 877 | 1.12 (0.96–1.30) | 0.143 | 0 | REC | 1.57 (1.04–2.36) | 0.032 | 0 | B A C | + |
| PTGS2 | rs20417 (G-765C) | G vs. C | 15.88 | 3 | 7,912 | 9,840 | 1.03 (0.95–1.11) | 0.453 | 16 | REC | 1.20 (1.01–1.44) | 0.039 | 0 | B A C | + |
| TERT | rs2853669 (T-244C) | C vs. T | 27.99 | 4 | 4,553 | 5,319 | 0.94 (0.89–1.01) | 0.074 | 0 | REC | 0.76 (0.64–0.91) | 0.002 | 22 | B A A | ++ |
| XRCC1 | rs25487 (Arg399Gln) | A vs. G | 33.82 | 43 | 23,701 | 25,153 | 1.04 (1.00–1.09) | 0.066 | 50 | REC | 1.10 (1.01–1.20) | 0.027 | 48 | A B C | + |
Minor vs. major allele (reference)
Dominant (DOM) or recessive (REC) genetic effect models
Venice Criteria grades are in the order of amount of evidence, replication of the association, and protection from bias
Cummulative epidemiological evidence as graded by the Venice criteria as strong (+++), moderate (++), or weak (+) for association with breast cancer risk
Table 4 presents evidence of no association between 45 genetic variants in 37 genes and breast cancer risk by meta-analysis. Variants were evaluated in at least three studies, with a minimum of 10,000 cases and 10,000 controls total, and provide solid evidence for a null association. While allelic associations are presented, no evidence of association with breast cancer risk was seen for any of these variants in any model tested (allelic, dominant, and recessive).
Table 4.
Genetic Variants Showing No Association with Breast Cancer Risk in Meta-Analyses with Minimum Sample Sizes of 10,000 Cases and 10,000 Controls
| Gene | Variant | Comparison 1 | Frequency (%) 2 | Number Evaluated
|
Breast Cancer Risk
|
Heterogeneity
|
||||
|---|---|---|---|---|---|---|---|---|---|---|
| Studies | Cases | Controls | OR (95% CI) | P value | P value | I2 | ||||
| ADH1B | rs1042026 (A19107G) | G vs. A | 28.93 | 9 | 11,381 | 15,573 | 0.99 (0.95–1.03) | 0.617 | 0.375 | 7 |
| ATM | rs1800054 (Ser49Cys) | (CG+GG) vs. CC | 2.37 | 16 | 16,682 | 20,729 | 1.16 (0.95–1.41) | 0.138 | 0.064 | 38 |
| AURKA | rs2273535 (Phe31Ile) | A vs. T | 31.96 | 16 | 19,709 | 24,646 | 1.03 (0.98–1.09) | 0.277 | 0.001 | 61 |
| BID | rs8190315 (Ser10Gly) | (GG+AG) vs. AA | 3.41 | 11 | 13,783 | 14,272 | 1.05 (0.87–1.27) | 0.607 | 0.093 | 38 |
| BRCA1 | rs1799950 (Gln356Arg) | C vs. T | 7.72 | 9 | 11,280 | 19,210 | 1.00 (0.86–1.15) | 0.949 | 0.001 | 70 |
| BRCA2 | rs144848 (Asn372His) | G vs. T | 27.37 | 21 | 21,906 | 27,399 | 1.01 (0.98–1.04) | 0.547 | 0.410 | 4 |
| CASP10 | rs13010627 (V410I) | A vs. G | 6.07 | 28 | 29,904 | 32,870 | 1.02 (0.95–1.09) | 0.609 | 0.005 | 46 |
| CASP8 | rs3834129 (−652 6N del) | Deletion vs. non | 43.41 | 16 | 13,254 | 13,639 | 0.96 (0.90–1.03) | 0.233 | 0.001 | 62 |
| CCND1 | rs9344 (Pro241Pro) | A vs. G | 50.53 | 14 | 12,846 | 13,118 | 1.04 (0.99–1.08) | 0.115 | 0.179 | 26 |
| CDKN1A | rs1801270 (Ser31Arg) | A vs. C | 7.73 | 20 | 22,003 | 29,324 | 1.05 (0.95–1.15) | 0.329 | 0.000 | 68 |
| COMT | rs4680 (Val158Met) | A vs. G | 47.01 | 41 | 27,433 | 34,787 | 0.98 (0.95–1.02) | 0.339 | 0.022 | 33 |
| CYP17A1 | rs743572 (T-34C) | C vs. T | 40.90 | 42 | 25,596 | 32,480 | 1.02 (0.99–1.05) | 0.239 | 0.308 | 9 |
| CYP19A1 | rs10046 (C132810T) | C vs. T | 48.27 | 8 | 12,122 | 17,607 | 1.03 (0.97–1.10) | 0.279 | 0.023 | 57 |
| CYP1A1 | rs1048943 (Ile462Val) | G vs. A | 8.44 | 27 | 12,332 | 17,182 | 1.06 (0.95–1.20) | 0.299 | 0.000 | 64 |
| CYP1A1 | rs4646903 (T3801C) | C vs. T | 19.36 | 26 | 10,568 | 14,542 | 1.00 (0.91–1.09) | 0.956 | 0.000 | 61 |
| CYP1B1 | rs10012 (Arg48Gly) | G vs. C | 28.63 | 9 | 10,821 | 12,597 | 1.03 (0.98–1.07) | 0.255 | 0.511 | 0 |
| CYP1B1 | rs1056827 (Ala119Ser) | T vs. G | 28.46 | 10 | 10,576 | 11,536 | 1.04 (0.97–1.11) | 0.242 | 0.081 | 41 |
| CYP1B1 | rs1800440 (Asn453Ser) | G vs. A | 17.48 | 11 | 11,311 | 13,410 | 0.99 (0.92–1.07) | 0.826 | 0.098 | 38 |
| ERCC2 | rs1799793 (Asp312Asn) | A vs. G | 32.99 | 22 | 13,994 | 13,868 | 0.98 (0.92–1.05) | 0.635 | 0.000 | 67 |
| ERCC4 | rs744154 ( G6068C) | C vs. G | 27.24 | 28 | 29,136 | 31,799 | 1.00 (0.97–1.02) | 0.882 | 0.492 | 0 |
| ESR2 | rs1256049 (Val328Val) | A vs. G | 7.28 | 9 | 13,331 | 17,820 | 1.02 (0.94–1.09) | 0.689 | 0.313 | 15 |
| ESR2 | rs4986938 (G39A) | A vs. G | 34.33 | 10 | 13,346 | 19,153 | 0.97 (0.94–1.01) | 0.104 | 0.739 | 0 |
| HSD17B1 | rs605059 (Ser312Gly) | G vs. A | 47.25 | 11 | 13,987 | 17,066 | 0.98 (0.95–1.01) | 0.196 | 0.480 | 0 |
| ICAM5 | rs1056538 (Val301Ile) | T vs. C | 38.29 | 19 | 19,484 | 24,474 | 0.99 (0.95–1.03) | 0.428 | 0.043 | 39 |
| IL6 | rs1800795 (G-174C) | C vs. G | 38.50 | 9 | 10,885 | 18,602 | 1.02 (0.97–1.08) | 0.545 | 0.294 | 17 |
| LIG4 | rs1805386 (Asp568Asp) | C vs. T | 17.44 | 8 | 10,068 | 11,140 | 0.96 (0.91–1.02) | 0.179 | 0.393 | 5 |
| MDM2 | rs2279744 (14+309T>G) | G vs. T | 36.27 | 24 | 14,180 | 13,223 | 1.03 (0.98–1.08) | 0.249 | 0.097 | 29 |
| MTHFR | rs1801131 (Glu429Ala) | C vs. A | 24.80 | 24 | 13,131 | 16,813 | 0.98 (0.94–1.03) | 0.482 | 0.074 | 31 |
| NAT2 | Acetylation phenotype | Fast vs. slow | 45.03 | 30 | 10,745 | 12,497 | 0.98 (0.92–1.05) | 0.603 | 0.066 | 30 |
| NUMA1 | rs3750913 (Ala794Gly) | (CC+CG) vs. GG | 5.63 | 16 | 16,182 | 18,908 | 1.08 (0.93–1.26) | 0.332 | 0.008 | 52 |
| PGR | rs1042838 (Val660Leu) | T vs. G | 14.48 | 28 | 31,672 | 37,579 | 1.02 (0.98–1.07) | 0.300 | 0.027 | 37 |
| PGR | rs10895068 (G331A) | A vs. G | 5.13 | 8 | 13,544 | 17,547 | 1.05 (0.97–1.15) | 0.252 | 0.283 | 19 |
| PTGS2 | rs5275 (T8473C) | C vs. T | 32.94 | 7 | 10,907 | 14,091 | 1.03 (0.98–1.07) | 0.238 | 0.390 | 5 |
| PTGS2 | rs5277 (Val102Val) | G vs. C | 15.04 | 3 | 10,583 | 12,607 | 0.97 (0.87–1.08) | 0.598 | 0.027 | 72 |
| SHBG | rs6259 (Asp356Asn) | A vs. G | 12.28 | 7 | 10,092 | 12,663 | 0.98 (0.91–1.04) | 0.452 | 0.321 | 14 |
| SOD2 | rs4880 (Val16Ala/Val-9Ala) | C vs. T | 47.31 | 31 | 26,976 | 35,015 | 1.01 (0.97–1.05) | 0.583 | 0.001 | 49 |
| TGFB1 | rs1800469 ( C-509T) | T vs. C | 34.85 | 11 | 12,125 | 15,273 | 1.00 (0.94–1.05) | 0.889 | 0.056 | 44 |
| TGFB1 | rs1800470 (Leu10Pro) | C vs. T | 40.30 | 32 | 20,125 | 27,269 | 1.01 (0.98–1.06) | 0.461 | 0.049 | 31 |
| TNF | rs361525 (A-417G) | A vs. G | 4.82 | 30 | 31,996 | 34,887 | 1.01 (0.95–1.06) | 0.851 | 0.479 | 0 |
| TP53 | rs1042522 (Arg72Pro) | C vs. G | 29.63 | 52 | 31,484 | 35,113 | 0.98 (0.94–1.03) | 0.446 | 0.000 | 62 |
| VDR | rs1544410 (G63980A) | A vs. G | 37.22 | 22 | 11,377 | 13,572 | 0.97 (0.93–1.03) | 0.311 | 0.048 | 36 |
| VDR | rs2228570 (Met1Arg/Lys/Thr) | T vs. C | 37.64 | 19 | 12,349 | 16,707 | 1.05 (0.98–1.12) | 0.159 | 0.000 | 67 |
| XRCC1 | rs1799782 (Arg194Trp) | T vs. C | 8.50 | 20 | 10,414 | 10,796 | 0.98 (0.88–1.09) | 0.682 | 0.012 | 47 |
| XRCC2 | rs3218536 (Arg188His) | G vs. A | 7.78 | 15 | 17,932 | 18,738 | 0.96 (0.90–1.02) | 0.192 | 0.298 | 14 |
| XRCC3 | rs1799796 (A17893G) | G vs. A | 32.88 | 6 | 10,870 | 12,263 | 1.00 (0.92–1.08) | 0.906 | 0.003 | 73 |
Allelic contrast or phenotype trait for common variants, or genetic comparison for rare variants
Minor allele frequency for common variants, or population frequency of test group for rare variants
Evaluation of Meta-Analyses
Of the 279 meta-analyses conducted with all available data (webappendix, pages 2–5), 50.2% (N=140) had little or no heterogeneity (I2<25%), 22.9% (N=64) had moderate heterogeneity (25% ≤I2 ≤50%), and 26.9% (N=75) had large heterogeneity (I 2>50%). Notably, the rate of large study heterogeneity for the 29 variants presented in Table 2 was significantly lower than the remaining 250 variants (3% and 30%, respectively; Fisher’s exact P value =0.003). Of the 225 ethnicity specific meta-analyses, 49.3% (N=111) had little or no heterogeneity, 24.4% (N=55) had moderate heterogeneity, and 26.2% (N=59) had large heterogeneity. Of the 396 dominant and recessive model meta-analyses, 53.8% (N=213) had little or no heterogeneity, 21.5% (N=85) had moderate heterogeneity, and 24.7% (N=98) had large heterogeneity.
Sensitivity analyses were conducted for all 51 variants significantly associated with breast cancer risk, first by excluding the first published or first positive report, then by excluding small studies (<500 cases), and then for common variants, by excluding studies in which control genotype distributions were not in HWE. When the first published or first positive report was excluded, the association for 30 variants was no longer statistically significant. However, only six of these variants showed an OR alteration of more than 5% (allelic associations for IFNG rs2430561 and LTROMT rs63478, a dominant association for BARD1 rs1048108, and recessive associations for IL10 rs1800896, LEPR rs1137101, and NCOA3 rs2230782). When small studies were excluded, the significance of the associations with breast cancer risk was attenuated for 15 variants, but only five had a change of magnitude of more than 5% (allelic associations for ERCC2 rs13181 and TP53 rs17878362, and recessive associations for LEPR rs1137101, NCOA3 rs2230782, and XRCC1 rs25487). Sensitivity analyses excluding small studies could not be conducted for seven variants (GNB3 rs5443, IFNG rs2430561, IL10 rs1800896, LRTOMT rs673478, MSH3 rs26279, NQO1 rs1800566, and NUMA1 rs3018301) because no studies in their meta-analyses included at least 500 cases. Nineteen meta-analyses with significant associations with breast cancer risk included data with control genotype frequencies that deviated from HWE. Exclusion of these data sources resulted in diminished statistical significance for three variants (GSTP1 rs1695, MTR rs1805087 and NUMA1 rs3018301 among Caucasians) but alteration of the magnitude of the association by more than 5% for only one of these variants (NUMA1 rs3018301).
Evidence of publication bias was evaluated by funnel plots and Begg’s tests; three variants showed evidence of possible publication bias (allelic association for ERCC2 rs13181, TNF rs1800629 among Caucasians, and a recessive association for XRCC1 rs25487). Modified Egger tests were used to evaluate possible bias due to small studies. Evidence of more conservative results from larger studies than smaller studies was found for five variants among analyses conducted among all available data (CHEK2 CNV deletion and 1100delC, ERCC2 rs13181, GSTM1 deletion, and LRTOMT rs673478), two variants among Caucasians (NQO1 rs1800566 and TNF rs1800629), and dominant and recessive associations for BARD1 rs1048108 and XRCC1 rs25487, respectively. Notably, for both CHEK2 variants, removal of the small studies did not materially alter the results. Among all 279 meta-analyses conducted, evidence of excess studies with significant findings was detected for 42, of which only one was in the group of variants with nominally significantly summary ORs for breast cancer risk (MTHFR rs1801133). When grouped by variants with or without nominally significant associations, evidence of excess studies with significant findings was seen only among those without nominally significant summary ORs (P<10−8). Alternately, evidence for excess studies with significant findings was found for all meta-analyses groups defined by either heterogeneity or ethnicity. Further, when evaluating all studies included in our meta-analyses as a whole, the observed number of studies with significant findings greatly exceeded the number expected (P<10−8), suggesting the presence of biases in published candidate-gene association studies.
Cumulative Epidemiologic Evidence
Assessment of the cumulative epidemiologic evidence for significant meta-analysis associations was conducted (Table 2 and Table 3); evidence was scored as strong, moderate, or weak based on grades of ‘A’, ‘B’, or ‘C’ for the total amount of evidence, replication of the association, and protection against bias, as specified by the Venice criteria (15, 16). Of the 51 variants with significant associations with breast cancer risk with P values ≤ 0.05, grades of ‘A’ were given to 32, 43, and 14 variants for the amount of evidence, replication of the association, and protection from bias, respectively. Grades of ‘B’ were given to 13, four, and zero variants for these three respective criteria. Grades of ‘C’ were given to 37 variants for protection from bias, mainly due to the loss of significance that occurred after excluding the first study (N=30) and/or a small effect with breast cancer risk (OR < 1.15, N=26). Additional reasons for grades of ‘C’ for protection from bias were given for variants with meta-analyses that showed smaller studies having larger effects than larger studies (N=7), a loss of significance when studies with cases not in HWE were excluded (N=3), significant Begg’s test indicating publication bias (N=3), and an excess of significant findings (N=1); these reasons were not exclusive. Only one and four variants were given grades of ‘C’ for amount of evidence and replication of the association, respectively. Ten variants received ‘A’ grades for all three criteria and can therefore be regarded to have strong cumulative epidemiologic evidence of an association with breast cancer risk, including ATM 5932G>T, CASP8 rs1045485 and rs6723097, CHEK2 IVS2+1G>A, rs17879961, 5.5 kb deletion, and 1100delC, CTLA4 rs231775, NBN 657del5, and TP53 rs17878362. Four variants received either an ‘A’ or ‘B’ grade in all three criteria, and were thus scored as having moderate evidence of an association, including ATM rs1800057, a short tandem repeat in CYP19A1, a recessive effect for TERT rs2853669, and an allelic association among Asian women for XRCC3 rs861539. The remaining variants evaluated in our study received a ‘C’ grade in one or more criteria, and so despite an overall significant association with breast cancer risk by meta-analysis, were scored as having weak cumulative evidence of an association based on the Venice criteria. As proposed by the Human Genome Epidemiology Network (16), a few exceptions in scoring of the Venice criteria were made. One variant (CASP8 rs1045485) was not penalized for its small summary effect (OR<1.15), as it showed a very consistent association across studies that were specifically designed to evaluate it. Additionally, five variants (ATM 5932G>T, CHEK2 IVS2+1G>A, 5.5 kb deletion, and 1100delC, and NBN 657del5) were not scored for the amount of evidence due to their very low frequency in the population (<0.5%).
DISCUSSION
This work represents the largest and most comprehensive assessment of the literature on the genetic architecture of breast cancer susceptibility conducted to date. Using methodology based on the guidelines for systematic reviews of genetic association studies proposed by the Human Genome Epidemiology Network (15, 16, 20, 21), we conducted a comprehensive field synopsis and meta-analysis of genetic variants and breast cancer risk. Statistically significant associations with breast cancer risk were found for 51 variants, including 17 that showed moderate to strong cumulative epidemiologic evidence for a true association. Additionally, meta-analyses with very large sample sizes (20,000 participants minimum), provided convincing evidence of no association with breast cancer risk for 45 variants in 37 genes.
Strong cumulative evidence for associations with breast cancer was found for six rare variants; four of which are in the tumor suppressor checkpoint kinase 2 (CHEK2) which initiates DNA repair after double-strand breakage (31–33). The four CHEK2 variants with strong evidence include the 1100delC truncating mutation at codon 381 in exon 10, a nonsynonymous polymorphism in exon 3 (I157T, rs17879961), a truncating mutation in exon 3 (IVS2+IG>A), and a 5.5 kb deletion that includes exons 9 and 10. Due to protein truncations, 1100delC, IVS2+1G>A, and the 5.5 kb deletion have kinase deficient molecules, while the minor allele of SNP I157T results in a CHEK2 protein with normal kinase activity but binding and phosphorylating downstream substrates is deficient (31–35). The increased risks of breast cancer associated with these variants ranged from 1.52 (1.31–1.77) for I157T (rs17879961), to 3.10 (2.59–3.71) for 1100delC; the association with breast cancer for this variant is well established. Notably, the CHEK2 5.5 kb deletion is the first low-penetrance large deletion variation to be confirmed to have a highly significant association with breast cancer risk specific in Caucasian women from Eastern European (36–38).
Our meta-analyses revealed two additional rare variants with strong evidence of association with breast cancer risk. A rare truncating variant (E1978X) in the ataxia-telangiectasia mutated (ATM) gene was associated with a very large increase in breast cancer risk by a meta-analysis of four studies (OR: 4.56, 95% CI: 1.35–15.42) among Caucasian women. The ATM gene encodes a protein kinase involved in the monitoring and double-strand DNA repair (39, 40). A rare five base pair deletion in exon 6 (657del5) of the NBN gene (previously known as NBS1) showed a significant association with breast cancer risk (OR 2.42, 95% CI: 1.54–3.80) based on seven published studies among Caucasians. The NBN gene encodes nibrin, a member of the MRE11/RAD50 double-strand break repair complex involved in cell-cycle checkpoint regulation (41); the rare deletion results in a truncated protein without full functionality.
Two of the four common SNPs that showed strong cumulative evidence for associations with breast cancer risk were located in the CASP8 gene (also known as FLICE and MCH5, 2q33-q34), which is a member of the cysteine-aspartic acid protease family, and has an important role in apoptosis (42). A nonsynonymous SNP, D302H (rs1045485) in exon 9, was first reported to be associated with breast cancer risk by a large-scale candidate-gene association consortium analysis (43). Our meta-analysis of 17 data sources indicates a significant protective effect associated with the minor allele of this polymorphism (OR: 0.89, 95% CI: 0.85–0.93). This locus is not polymorphic among Asians, so this association is limited to Caucasians (43). Our meta-analysis also revealed strong evidence of an association with breast cancer risk for a second variant in the CASP8 gene, an intronic SNP, rs6723097, that is located approximately 21 kb away from D302H. These two SNPs are in very weak linkage disequilibrium (r2=0.153 among Caucasians based on HapMap LD release 27) (23), and thus these two variants may be independently associated with breast cancer risk. Notably, rs6723097 is in high LD with rs6435074, another CASP8 variant which was found to have weak cumulative evidence for an association with breast cancer risk.
Two additional common variants showing strong cumulative evidence for associations with breast cancer in meta-analyses were located in the CTLA4 (also known as CD152) and TP53 genes. The CTLA4 variant, an exon 1 nonsynonymous SNP (rs231775) was associated with a moderate increase in breast cancer risk (OR: 1.25, 95% CI: 1.14–1.37) by meta-analysis of three studies conducted among Asian women. The variant results in a threonine to alanine substitution in the leader sequence of cytotoxic T-lymphocyte-associated protein 4, which transmits an inhibitory signal to T-cells and is thought to influence carcinogenesis via antitumor immunity (44). The SNP is proposed to enhance the inhibitory effect of CTLA4 on T-cell activation (45–47). Notably, this variant has also been associated with other cancer sites, including esophageal and lung cancer among Asians (45). No studies evaluating breast cancer risk and this SNP have been conducted among Caucasians. Finally, while rare germline mutations in the tumor suppressor TP53 have been identified as high-penetrance breast cancer susceptibility alleles (48), in the current analyses, a common 16-bp insertion/deletion variant (rs17878362) in intron 3 was found to have strong evidence of a small effect on breast cancer risk. Women with the deletion were more likely to be breast cancer cases (OR: 1.15, 95% CI: 1.04–1.26) based on our meta-analysis of 12 studies. This association is supported by functional evidence that reduced levels of TP53 mRNA were also associated with the deletion (49), and p53 is essential for initiating apoptosis or senescence in response to DNA damage (50).
Ethnicity-specific associations identified by meta-analysis included both variants that only had data available among women of one ethnicity, and variants with significant associations only in ethnicity stratified analyses. More significant associations with candidate genes were identified among European women than other ethnicities, primarily because the vast majority of studies have been conducted among Europeans. Ethnicity-specific disease associations may arise from differences in genetic LD structure across populations or due to other unknown environmental or genetic contributors. Additional evaluation of these variants among women of different ethnic populations is warranted. In addition to the 10 variants that had strong cumulative evidence of an association with breast cancer risk, four had moderate evidence, including rare variants in the ATM and CYP19A1 genes among all women, a common polymorphism with a recessive effect in the TERT gene, and a common nonsynonymous SNP in the XRCC3 gene among Asian women. Additional investigation of these seven variants is also warranted.
Although identifying variants significantly associated with breast cancer risk is interesting, an equally important goal of meta-analysis is to reveal genetic variants that show no evidence of an association to a high degree of certainty. Forty-five variants in 37 genes were not associated with breast cancer risk in meta-analyses of 20,000 subjects minimum. These meta-analyses had greater than 93 and 97% power to detect additive associations of 1.10 for variants with MAFs of 15% or 20%, respectively. Therefore, continued evaluation of the main effects of these variants in epidemiologic studies with a similar sample size is unlikely to be fruitful.
Limitations of this field synopsis must be addressed. Although an exhaustive search of the literature was performed, it is likely that some publications were overlooked. Reports in languages other than English were not included, and publications without resolvable genotype counts could not be incorporated. However, these should comprise a minority of the total work investigating breast cancer associated variants, and including these studies should not alter the overall results of this large-scale meta-analysis. Analyses were not conducted for all variants ever evaluated in relation to breast cancer, but rather only for those with a minimum of three data sources. Genotype counts and crude estimates of effect were used in these meta-analyses, rather than adjusted estimates of the association. Further, we did not evaluate gene-gene or gene-environment interactions. While these analyses may be interesting and informative, finding concordance in definitions of exposure variables and uses of covariates across studies is challenging, and thus these interaction analyses were beyond the scope of the current report; additional investigation in these areas is needed. Heterogeneity was commonly observed in the 279 meta-analyses conducted. Although we could remove some variability by conducting ethnicity specific analyses, other sources of heterogeneity were not examined, such as tumor types or estrogen receptor status. Most publications do not report associations by subtypes of breast cancer; future research that evaluates associations by breast tumor type is needed. Multiple comparisons may be another potential concern. Including different genetic effect models and ethnicity-specific analyses, a total of 982 meta-analyses were performed; a Bonferoni corrected P value threshold for significance would be 5×10⁻⁵. Five variants with strong epidemiologic evidence have p-values that surpass this threshold. However, this P value is overly conservative, as many of the tests conducted were not independent. Further, we sought to summarize and evaluate existing associations, rather than to identify new associations. Using a P value significance threshold of 0.05 reduced the possibility of type II errors. Most importantly, variants with significant associations with breast cancer were graded as having strong, moderate, or weak cumulative evidence based on the Venice criteria (15,16), so the interpretation of a result should not be determined by its P value alone. In line with this, eight of the 10 variants with strong epidemiologic evidence had P values ≤ 10−4. Finally, we found that the Venice criteria (15, 16) were more suitable for common variants than rare variants. To earn an “A” grade for amount of evidence, a variant with a MAF of 0.5% would require at least 100,000 subjects; no meta-analyses conducted to date were that large. Therefore, we propose amendments for the Venice criteria to include a minimum of three homogeneous sources, a more stringent P value, the incorporation of biological evidence, and consideration of the minor allele frequency.
Both new large studies and meta-analyses of existing studies are needed to identify disease associated genetic variants. The consistency of the association, a major criterion for evaluating causality in epidemiologic studies can not be readily assessed in a single study, particularly the one conducted in a single population. There are some differences in genetic architectures across ethnic groups, and thus some variants may be associated with disease risk in one population but not in others. Further, a variant may show heterogeneity of effect by ethnicity due to gene-gene and gene-environment interactions, and so conducting research among different populations is needed to uncover these differences. On the other hand, meta-analyses may suffer from publication bias and further, these analyses could be limited by data available from published studies that are conducted using different protocols. Nevertheless, meta-analyses are an important tool to evaluate the consistency of study findings, assess cumulative evidence from previous studies, and provide clues and guidelines for future studies.
It has been 20 years since the mapping of the breast-ovarian cancer susceptibility gene BRCA1 to chromosome 17 (51). Recent GWAS have provided strong evidence for 19 common loci as breast cancer susceptibility variants (2–12). These common loci, along with germline mutations in BRCA1 and other known breast cancer susceptibility genes, explain only 28% of the heritability of the disease (11). Most GWAS have been conducted among women of European ancestries; future studies in other populations are likely to identify additional variants. Increased coverage of genetic variation in new SNP arrays used in GWAS are also likely to identify additional breast cancer susceptibility variants. Although GWAS is a powerful tool to uncover common genetic variants for breast cancer and other complex diseases, candidate gene studies remain useful to test a priori hypotheses and confirm associations with breast cancer risk for genetic variants selected based on strong biological evidence. In this large-scale, comprehensive meta-analysis, we identified 14 genetic variants that showed strong or moderate evidence of associations with breast cancer risk; further investigation of these variants is warranted. Notably, all ten variants with strong cumulative epidemiologic evidence retained significance for an association with breast cancer risk regardless of genetic model employed, and eight of ten have functional data in the literature supporting a role in breast cancer susceptibility. In addition, we identified 45 variants in 37 genes that convincingly showed no evidence of association with breast cancer risk. Our meta-analyses summarize the current state of the literature of breast cancer susceptibility genetic architecture, and provide useful data for designing future studies to evaluate genetic factors for breast cancer risk.
Supplementary Material
Acknowledgments
Funding: This research was supported by research grants from the U.S. National Cancer Institute.
We thank Drs. Chen-Yang Shen, Maya Ghoussaini, Gloria Ribas, Yuan Ji, Chad Garner, Antonio Salas, Eldon R. Jupe, Jing Shen, Sabapathy P. Balasubramanian, Arancha Cebrian, Bert Gold, Asta Försti, Luis Alberto Henríquez Hernández, Barry Iacopetta, Hiroshi Inoue, Neetu Singh, Bharat Thyagarajan, Ahmed Rebai, Nejat Dalay, Kangmin Zhu, Sunita Saxena, Anurupa Chakraborty, Tommaso A. Dragani, Rachel Nusbauma, and A. Ghaderi for clarification on their data and/or providing additional information.
Footnotes
The authors declared no conflicts of interest.
AUTHOR CONTRIBUTIONS
BZ conducted literature searches, data extraction, and analyses. ABF assessed data quality. BZ and ABF drafted the manuscript with substantial contributions from WZ. WZ reviewed results and provided guidelines for presentation and interpretation. All authors contributed to the revision of the manuscript.
Publisher's Disclaimer: This is a PDF file of an unedited manuscript that has been accepted for publication. As a service to our customers we are providing this early version of the manuscript. The manuscript will undergo copyediting, typesetting, and review of the resulting proof before it is published in its final citable form. Please note that during the production process errors may be discovered which could affect the content, and all legal disclaimers that apply to the journal pertain.
References
- 1.Lichtenstein P, Holm NV, Verkasalo PK, et al. Environmental and heritable factors in the causation of cancer--analyses of cohorts of twins from Sweden, Denmark, and Finland. N Engl J Med. 2000;343(2):78–85. doi: 10.1056/NEJM200007133430201. [DOI] [PubMed] [Google Scholar]
- 2.Stratton MR, Rahman N. The emerging landscape of breast cancer susceptibility. Nat Genet. 2008;40(1):17–22. doi: 10.1038/ng.2007.53. [DOI] [PubMed] [Google Scholar]
- 3.Easton DF, Pooley KA, Dunning AM, et al. Genome-wide association study identifies novel breast cancer susceptibility loci. Nature. 2007;447(7148):1087–93. doi: 10.1038/nature05887. [DOI] [PMC free article] [PubMed] [Google Scholar]
- 4.Hunter DJ, Kraft P, Jacobs KB, et al. A genome-wide association study identifies alleles in FGFR2 associated with risk of sporadic postmenopausal breast cancer. Nat Genet. 2007;39(7):870–4. doi: 10.1038/ng2075. [DOI] [PMC free article] [PubMed] [Google Scholar]
- 5.Stacey SN, Manolescu A, Sulem P, et al. Common variants on chromosomes 2q35 and 16q12 confer susceptibility to estrogen receptor-positive breast cancer. Nat Genet. 2007;39(7):865–9. doi: 10.1038/ng2064. [DOI] [PubMed] [Google Scholar]
- 6.Stacey SN, Manolescu A, Sulem P, et al. Common variants on chromosome 5p12 confer susceptibility to estrogen receptor-positive breast cancer. Nat Genet. 2008;40(6):703–6. doi: 10.1038/ng.131. [DOI] [PubMed] [Google Scholar]
- 7.Gold B, Kirchhoff T, Stefanov S, et al. Genome-wide association study provides evidence for a breast cancer risk locus at 6q22.33. Proc Natl Acad Sci U S A. 2008;105(11):4340–5. doi: 10.1073/pnas.0800441105. [DOI] [PMC free article] [PubMed] [Google Scholar]
- 8.Zheng W, Long J, Gao YT, et al. Genome-wide association study identifies a new breast cancer susceptibility locus at 6q25.1. Nat Genet. 2009;41(3):324–8. doi: 10.1038/ng.318. [DOI] [PMC free article] [PubMed] [Google Scholar]
- 9.Ahmed S, Thomas G, Ghoussaini M, et al. Newly discovered breast cancer susceptibility loci on 3p24 and 17q23.2. Nat Genet. 2009;41(5):585–90. doi: 10.1038/ng.354. [DOI] [PMC free article] [PubMed] [Google Scholar]
- 10.Thomas G, Jacobs KB, Kraft P, et al. A multistage genome-wide association study in breast cancer identifies two new risk alleles at 1p11.2 and 14q24.1 (RAD51L1) Nat Genet. 2009;41(5):579–84. doi: 10.1038/ng.353. [DOI] [PMC free article] [PubMed] [Google Scholar]
- 11.Turnbull C, Ahmed S, Morrison J, et al. Genome-wide association study identifies five new breast cancer susceptibility loci. Nat Genet. 2010;42(6):504–7. doi: 10.1038/ng.586. [DOI] [PMC free article] [PubMed] [Google Scholar]
- 12.Antoniou AC, Wang X, Fredericksen ZS, et al. A locus on 19p13 modifies risk of breast cancer in BRCA1 mutation carriers and is associated with hormone receptor-negative breast cancer in the general population. Nat Genet. 2010;42(10):885–92. doi: 10.1038/ng.669. [DOI] [PMC free article] [PubMed] [Google Scholar]
- 13.Bertram L, McQueen MB, Mullin K, Blacker D, Tanzi RE. Systematic meta-analyses of Alzheimer disease genetic association studies: the AlzGene database. Nat Genet. 2007;39(1):17–23. doi: 10.1038/ng1934. [DOI] [PubMed] [Google Scholar]
- 14.Allen NC, Bagade S, McQueen MB, et al. Systematic meta-analyses and field synopsis of genetic association studies in schizophrenia: the SzGene database. Nat Genet. 2008;40(7):827–34. doi: 10.1038/ng.171. [DOI] [PubMed] [Google Scholar]
- 15.Ioannidis JP, Boffetta P, Little J, et al. Assessment of cumulative evidence on genetic associations: interim guidelines. Int J Epidemiol. 2008;37(1):120–32. doi: 10.1093/ije/dym159. [DOI] [PubMed] [Google Scholar]
- 16.Khoury MJ, Bertram L, Boffetta P, et al. Genome-wide association studies, field synopses, and the development of the knowledge base on genetic variation and human diseases. Am J Epidemiol. 2009;170(3):269–79. doi: 10.1093/aje/kwp119. [DOI] [PMC free article] [PubMed] [Google Scholar]
- 17.Chanock SJ, Manolio T, Boehnke M, et al. Replicating genotype-phenotype associations. Nature. 2007;447(7145):655–60. doi: 10.1038/447655a. [DOI] [PubMed] [Google Scholar]
- 18.Lohmueller KE, Pearce CL, Pike M, Lander ES, Hirschhorn JN. Meta-analysis of genetic association studies supports a contribution of common variants to susceptibility to common disease. Nat Genet. 2003;33(2):177–82. doi: 10.1038/ng1071. [DOI] [PubMed] [Google Scholar]
- 19.Ioannidis JP, Ntzani EE, Trikalinos TA, Contopoulos-Ioannidis DG. Replication validity of genetic association studies. Nat Genet. 2001;29(3):306–9. doi: 10.1038/ng749. [DOI] [PubMed] [Google Scholar]
- 20.Sagoo GS, Little J, Higgins JP. Systematic reviews of genetic association studies. Human Genome Epidemiology Network. PLoS Med. 2009;6(3):e28. doi: 10.1371/journal.pmed.1000028. [DOI] [PMC free article] [PubMed] [Google Scholar]
- 21.Ioannidis JP, Gwinn M, Little J, et al. A road map for efficient and reliable human genome epidemiology. Nat Genet. 2006;38(1):3–5. doi: 10.1038/ng0106-3. [DOI] [PubMed] [Google Scholar]
- 22.Ioannidis JP, Ntzani EE, Trikalinos TA. ‘Racial’ differences in genetic effects for complex diseases. Nat Genet. 2004;36(12):1312–8. doi: 10.1038/ng1474. [DOI] [PubMed] [Google Scholar]
- 23.Frazer KA, Ballinger DG, Cox DR, et al. A second generation human haplotype map of over 3.1 million SNPs. Nature. 2007;449(7164):851–61. doi: 10.1038/nature06258. [DOI] [PMC free article] [PubMed] [Google Scholar]
- 24.Wigginton JE, Cutler DJ, Abecasis GR. A note on exact tests of Hardy-Weinberg equilibrium. Am J Hum Genet. 2005;76(5):887–93. doi: 10.1086/429864. [DOI] [PMC free article] [PubMed] [Google Scholar]
- 25.DerSimonian R, Laird N. Meta-analysis in clinical trials. Control Clin Trials. 1986;7(3):177–88. doi: 10.1016/0197-2456(86)90046-2. [DOI] [PubMed] [Google Scholar]
- 26.Lau J, Ioannidis JP, Schmid CH. Quantitative synthesis in systematic reviews. Ann Intern Med. 1997;127(9):820–6. doi: 10.7326/0003-4819-127-9-199711010-00008. [DOI] [PubMed] [Google Scholar]
- 27.Higgins JP, Thompson SG. Quantifying heterogeneity in a meta-analysis. Stat Med. 2002;21(11):1539–58. doi: 10.1002/sim.1186. [DOI] [PubMed] [Google Scholar]
- 28.Egger M, Davey SG, Schneider M, Minder C. Bias in meta-analysis detected by a simple, graphical test. BMJ. 1997;315(7109):629–34. doi: 10.1136/bmj.315.7109.629. [DOI] [PMC free article] [PubMed] [Google Scholar]
- 29.Harbord RM, Egger M, Sterne JA. A modified test for small-study effects in meta-analyses of controlled trials with binary endpoints. Stat Med. 2006;25(20):3443–57. doi: 10.1002/sim.2380. [DOI] [PubMed] [Google Scholar]
- 30.Ioannidis JP, Trikalinos TA. An exploratory test for an excess of significant findings. Clin Trials. 2007;4(3):245–53. doi: 10.1177/1740774507079441. [DOI] [PubMed] [Google Scholar]
- 31.Falck J, Mailand N, Syljuasen RG, Bartek J, Lukas J. The ATM-Chk2-Cdc25A checkpoint pathway guards against radioresistant DNA synthesis. Nature. 2001;410(6830):842–7. doi: 10.1038/35071124. [DOI] [PubMed] [Google Scholar]
- 32.Li J, Williams BL, Haire LF, et al. Structural and functional versatility of the FHA domain in DNA-damage signaling by the tumor suppressor kinase Chk2. Mol Cell. 2002;9(5):1045–54. doi: 10.1016/s1097-2765(02)00527-0. [DOI] [PubMed] [Google Scholar]
- 33.Wu X, Webster SR, Chen J. Characterization of tumor-associated Chk2 mutations. J Biol Chem. 2001;276(4):2971–4. doi: 10.1074/jbc.M009727200. [DOI] [PubMed] [Google Scholar]
- 34.Meijers-Heijboer H, van den Ouweland A, Klijn J, et al. Low-penetrance susceptibility to breast cancer due to CHEK2(*)1100delC in noncarriers of BRCA1 or BRCA2 mutations. Nat Genet. 2002;31(1):55–9. doi: 10.1038/ng879. [DOI] [PubMed] [Google Scholar]
- 35.Kilpivaara O, Vahteristo P, Falck J, et al. CHEK2 variant I157T may be associated with increased breast cancer risk. Int J Cancer. 2004;111(4):543–7. doi: 10.1002/ijc.20299. [DOI] [PubMed] [Google Scholar]
- 36.Cybulski C, Wokolorczyk D, Huzarski T, et al. A deletion in CHEK2 of 5,395 bp predisposes to breast cancer in Poland. Breast Cancer Res Treat. 2007;102(1):119–22. doi: 10.1007/s10549-006-9320-y. [DOI] [PubMed] [Google Scholar]
- 37.Walsh T, Casadei S, Coats KH, et al. Spectrum of mutations in BRCA1, BRCA2, CHEK2, and TP53 in families at high risk of breast cancer. JAMA. 2006;295(12):1379–88. doi: 10.1001/jama.295.12.1379. [DOI] [PubMed] [Google Scholar]
- 38.Bogdanova N, Feshchenko S, Cybulski C, Dork T. CHEK2 mutation and hereditary breast cancer. J Clin Oncol. 2007;25(19):e26. doi: 10.1200/JCO.2007.11.4223. [DOI] [PubMed] [Google Scholar]
- 39.Renwick A, Thompson D, Seal S, et al. ATM mutations that cause ataxia-telangiectasia are breast cancer susceptibility alleles. Nat Genet. 2006;38(8):873–5. doi: 10.1038/ng1837. [DOI] [PubMed] [Google Scholar]
- 40.Ahmed M, Rahman N. ATM and breast cancer susceptibility. Oncogene. 2006;25(43):5906–11. doi: 10.1038/sj.onc.1209873. [DOI] [PubMed] [Google Scholar]
- 41.Varon R, Vissinga C, Platzer M, et al. Nibrin, a novel DNA double-strand break repair protein, is mutated in Nijmegen breakage syndrome. Cell. 1998;93(3):467–76. doi: 10.1016/s0092-8674(00)81174-5. [DOI] [PubMed] [Google Scholar]
- 42.Hengartner MO. The biochemistry of apoptosis. Nature. 2000;407(6805):770–6. doi: 10.1038/35037710. [DOI] [PubMed] [Google Scholar]
- 43.Cox A, Dunning AM, Garcia-Closas M, et al. A common coding variant in CASP8 is associated with breast cancer risk. Nat Genet. 2007;39(3):352–8. doi: 10.1038/ng1981. [DOI] [PubMed] [Google Scholar]
- 44.Egen JG, Kuhns MS, Allison JP. CTLA-4: new insights into its biological function and use in tumor immunotherapy. Nat Immunol. 2002;3(7):611–8. doi: 10.1038/ni0702-611. [DOI] [PubMed] [Google Scholar]
- 45.Sun T, Zhou Y, Yang M, et al. Functional genetic variations in cytotoxic T-lymphocyte antigen 4 and susceptibility to multiple types of cancer. Cancer Res. 2008;68(17):7025–34. doi: 10.1158/0008-5472.CAN-08-0806. [DOI] [PubMed] [Google Scholar]
- 46.Maurer M, Loserth S, Kolb-Maurer A, et al. A polymorphism in the human cytotoxic T-lymphocyte antigen 4 ( CTLA4) gene (exon 1 +49) alters T-cell activation. Immunogenetics. 2002;54(1):1–8. doi: 10.1007/s00251-002-0429-9. [DOI] [PubMed] [Google Scholar]
- 47.Kouki T, Sawai Y, Gardine CA, et al. CTLA-4 gene polymorphism at position 49 in exon 1 reduces the inhibitory function of CTLA-4 and contributes to the pathogenesis of Graves’ disease. J Immunol. 2000;165(11):6606–11. doi: 10.4049/jimmunol.165.11.6606. [DOI] [PubMed] [Google Scholar]
- 48.Malkin D, Li FP, Strong LC, et al. Germ line p53 mutations in a familial syndrome of breast cancer, sarcomas, and other neoplasms. Science. 1990;250(4985):1233–8. doi: 10.1126/science.1978757. [DOI] [PubMed] [Google Scholar]
- 49.Gemignani F, Moreno V, Landi S, et al. A TP53 polymorphism is associated with increased risk of colorectal cancer and with reduced levels of TP53 mRNA. Oncogene. 2004;23(10):1954–6. doi: 10.1038/sj.onc.1207305. [DOI] [PubMed] [Google Scholar]
- 50.Meek DW. Tumour suppression by p53: a role for the DNA damage response? Nat Rev Cancer. 2009;9(10):714–23. doi: 10.1038/nrc2716. [DOI] [PubMed] [Google Scholar]
- 51.Hall JM, Lee MK, Newman B, et al. Linkage of early-onset familial breast cancer to chromosome 17q21. Science. 1990;250(4988):1684–9. doi: 10.1126/science.2270482. [DOI] [PubMed] [Google Scholar]
Associated Data
This section collects any data citations, data availability statements, or supplementary materials included in this article.