

Abstract
To clone the goat Polled Intersex Syndrome (PIS) gene(s), a chromosome walk was performed from six entry points at 1q43. This enabled 91 BACs to be recovered from a recently constructed goat BAC library. Six BAC contigs of goat chromosome 1q43 (ICC1–ICC6) were thus constructed covering altogether 4.5 Mb. A total of 37 microsatellite sequences were isolated from this 4.5-Mb region (16 in this study), of which 33 were genotyped and mapped. ICC3 (1500 kb) was shown by genetic analysis to encompass the PIS locus in a ∼400-kb interval without recombinants detected in the resource families (293 informative meioses). A strong linkage disequilibrium was detected among unrelated animals with the two central markers of the region, suggesting a probable location for PIS in ∼100 kb. High-resolution comparative mapping with human data shows that this DNA segment is the homolog of the human region associated with Blepharophimosis Ptosis Epicanthus inversus Syndrome (BPES) gene located in 3q23. This finding suggests that homologous gene(s) could be responsible for the pathologies observed in humans and goats.
[The sequence data, PCR primers and PCR conditions for STS and microsatellites described in this paper have been submitted to the GenBank data library under accession nos. AQ666547–AQ666579, AQ686084–AQ686129, AQ793920–793931, AQ810429–AQ810527, G41201–G41228, and G54270–G54286.]
In mammals, sex determination mechanisms act with an exquisite precision to avoid the occurrence of intersex phenotypes. The bandmaster of the sex-determination pathway is the SRY gene, located on the Y chromosome, whose action is sufficient to induce maleness in XX mice (Koopman et al. 1991). The behavior of the downstream actors, whose roles are to amplify the primary decision, is much less documented for two main reasons. The first reason is the complexity of the pathway (Swain and Lovell-Badge 1999); sex determination occurs relatively late in embryonic development, which implies the existence of complex coordination mechanisms between one cell lineage and another. The second reason is that an unknown number of genes remain to be identified inside the sex determination cascade. The cloning of these genes is the prerequisite to understanding mammalian sex determination as a whole. One approach for breaking down sex determination into its components is the analysis of genetic cases of sex reversal. In humans, the scarcity of familial cases impedes classical linkage analysis. Despite this difficulty, success has been achieved in a few cases, such as SOX9 (Tommerup et al. 1993; Foster et al. 1994), implicated in XY sex reversal, SOX3 (Stevanovic et al. 1993; Collignon et al. 1996) and DAX1 (Zanaria et al. 1995), both putatively playing a role in ovarian differentiation. In 1996, we located the first mammalian gene involved in XX sex reversal, the goat PIS (Polled Intersex Syndrome) locus (Vaiman et al. 1996a). One peculiarity of this syndrome is the full association between absence of horns and intersexuality (Asdell 1944). No recombinant has ever been observed between the two phenotypes (Ricordeau and Lauvergne 1967; Soller et al. 1969), suggesting that they are either under the control of a single pleiotropic gene or two very closely linked genes. Whereas intersexuality appears as autosomal recessive, polledness is autosomal dominant, which has been helpful in building resource families (Vaiman et al. 1996a). The locus was initially localized to the distal region of goat chromosome 1. Its genetic localization was then refined by the targeted isolation and genotyping of new microsatellite markers using comparative mapping (Schibler et al. 1998a) and selected chromosomal fractions (Vaiman et al. 1999b). The PIS interval was thus reduced to a ∼1-cM region of goat chromosome 1q43. The homologous human region was identified precisely as a human chromosome 3q23 DNA segment encompassing the COP gene, at a location homologous to human Blepharophimosis Ptosis Epicanthus Syndrome (BPES) (Zlotogora et al. 1983; Deng et al. 1991; Toomes and Dixon 1998). In this study, we describe the construction of six contig elements from the goat region (a total of 4.5 Mb), locate PIS in one of these contigs, and refine the genetic localization by linkage disequilibrium mapping to 0.1 cM (∼100 kb, according to the contig data). We suggest that goat PIS and human BPES could be encoded by a homologous gene.
RESULTS
Comparative Mapping with Human ESTs
A total of 85 primer pairs corresponding to 60 ESTs (mainly from 3′-untranslated regions) mapped on the human gene map between TFDP2 and NCK were tested for amplification on goat genomic DNA. Only 22 ESTs (36%) were found to amplify goat DNA with sufficient specificity and were used to screen the goat BAC library. FISH mapping of these BACs led to inconsistent results in 16 cases. Only BACs corresponding to six human ESTs WI-13749, WI-9573, STSG3182, WI-7255, STSG9571, and WI14619 were mapped by FISH on goat chromosome 1q43. They were thus used as starting points for bidirectional walking.
Chromosome Walking and Contig Assembly
Initial screening of the goat BAC library with human coding sequences (six ESTs from this study and two other coding sequences) resulted in eight primary contigs that were then merged into six (called ICC1–ICC6). We used a chromosome bidirectional walking strategy starting simultaneously from these multiple entry points: A total 113 BAC end sequences were obtained for most of the clones (59 clones) and were used to sequentially isolate new BACs. Seventy STS were also derived from 23 BACs to confirm and specify overlaps. Only one end sequence could be obtained for five BAC clones. Eighteen other end sequences were found to contain large repeated regions (SINE or LINE) and thus could not be used to screen the library. Likewise, about one-third (22) of STS sequences generated were homologous to SINEs. In total, 130 sequences (92 of which are from BAC ends) were used for contig construction.
No overlapping clone could be obtained with T6 ends of 20A4 or 106F8/A7 (see ICC2 on Fig. 1). To fill in this gap, a sheep BAC library (Vaiman et al. 1999a) was screened, making it possible to isolate Oar7C4 and Oar53E5. However, further work in this contig (ICC2) was abandoned as new genetic data show that the PIS-relevant region was in ICC3.
Figure 1.

Detail of the contigs constructed in the goat PIS region. To avoid overcrowding, only three contigs are fully represented. Microsatellites (with prefix LSCV) that were genetically mapped are represented in blue. The different STS identified during the study are displayed along the BAC contigs, some are microsatellites that were not mapped genetically. BAC ends are encoded by SP for the SP6 end, and by T for the T7 end. Restriction sites are encoded by N (NotI site) and S (SalI site). Identified genes and ESTs are positioned along the BAC contig and represented in bold characters.
To confirm overlap and evaluate the genomic coverage of the contigs, restriction analysis was performed using NotI and SalI. BAC insert sizes ranged from 100 to 200 kb, with 153 kb on average, in good agreement with our previous estimate (Schibler et al. 1998b). Contig sizes could be estimated at 400, 1000, 1500, 1000, 400, and 300 kb for ICC1–ICC6, respectively. ICC2, ICC3, and ICC4 contigs (67 clones) and resulting restriction maps are shown in Figure 1. Combining all end sequences, STSs, and microsatellites, our BAC/STS map reaches an average resolution of one STS per 30 kb. In these 4.5 Mb, 3.2 genomic coverage was observed, consistent with our previous estimation with the whole BAC library (Schibler et al. 1998b). However, a further examination of the contigs suggests that some regions are under-represented, with small overlaps between clones. Furthermore, statistical analysis reveals that some other regions displaying over seven redundancy (between and within ICC3 and ICC4), are over-represented (P <0.005). As a whole, these observations suggest a preferential cloning of some regions.
Linkage Analysis Determined a 400-kb Interval Without Recombinants
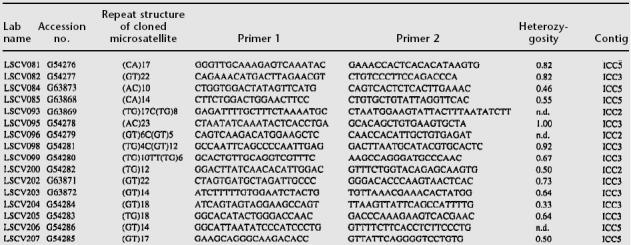
During this work, a total of 35 BACs from the contigs were subcloned, and 37 microsatellites were isolated, 16 of which are reported here (Table 1). On average, 1.5 (TG)n microsatellite was identified in each BAC. None was found in three BACs (141F1, 296F5, and 284E7). The polymorphism of new microsatellites isolated from the ongoing contig was characterized by genotyping primarily the 12 family founder males. Genetic localization of the markers was obtained by analyzing the segregation either in all the informative families or only inside the families in which recombinants were left. Combining linkage data with BAC positions inside the contig, the marker order was established between the two anchor genes Sox14 and CRBP1 as LSCV001—(LSCV116; LSCV103; LSCV056)—(LSCV120; LSCV119)—LSCV200—(LSCV204; LSCV205)—(LSCV203; LSCV202)—LSCV099—(LSCV098; LSCV095)—LSCV082—LSCV045—LSCV075—LSCV076—LSCV077—LSCV066. Markers in parentheses belong to the same BAC clone. Among the 293 informative meioses available, one recombinant was observed on one side between PIS and the markers LSCV120/119 (individual 501 in family 163). On the other side, one recombinant was present between PIS and LSCV045 (individual 368 in family 226). The recombinant 501 is still present for LSCV200, LSCV204, and LSCV205 but disappear at LSCV203. Symmetrically, the recombinant 368 disappear at LSCV082, meaning that the closest flanking crossovers are located in the LSCV045/LSCV082 interval and in the LSCV205/LSCV203 interval. The physical size of this interval without recombinants could be estimated at ∼400 kb by analyzing the restriction site positions in the ICC3 BAC contig.
Table 1.
Characteristics of New Goat Microsatellites in the PIS Region
 |
Linkage Disequilibrium Analysis
Inside the non-recombinant interval, genotype analysis of the marker LSCV098 revealed a very strong linkage disequilibrium (LD) and a tight association of the polled allele with a rare allele of the microsatellite (allele 1, Fig. 2). Linkage disequilibrium was then systematically explored for all the unrelated animals available in the resource families (Table 3, below). The goat resource families contain 246 unrelated animals, of which 12 are heterozygous males (founders), 211 are homozygous (horned) females, and 23 are heterozygous females. Sixty independent additional animals crossed to produce intersex progeny were also genotyped. Allele distributions were plotted in histograms for the markers in the LSCV082/LSCV203 interval (Fig. 1). χ2 analyses revealed significant distortions with one particular allele for LSCV098 (allele 1, 26 of 34 occurrences), LSCV095 (allele 5, 26 of 34 occurrences), and LSCV202 (allele 10, 15 of 34 occurrences). For LSCV082, distortions were visible for three alleles (5, 13, and 14), but the χ2 test was not significant. For LSCV099, no significant discrepancy could be observed, probably due to the very high frequency of one allele (allele 4: f = 0.95). The polled animals are heterozygous for the polled phenotype (Pp), however, as these animals are male or female genitors, microsatellite alleles for carrier and non-carrier chromosomes could be easily deduced by analyzing their progeny (Table 2). Linkage disequilibrium was tested using the DISLAMB program (Terwilliger 1995). Highly significant values were obtained for LSCV095, LSCV098, and LSCV202. Conversely, LSCV082 and LSCV203 did not display significant linkage disequilibrium. Estimations of the λ parameter were of 0.69, 0.74, and 0.46 for LSCV095, 098 and 202, respectively. Multipoint analysis of linkage disequilibrium was carried out using the DISMULT program (Terwilliger 1995), and the resulting curve plotted (Fig. 3). The distance between LSCV082 and LSCV203 was estimated at 300 kb, calculated on the basis of the different NotI and SalI observed restriction sites. The DISMULT curve had a steep slope with lod scores peaking at 28.5 near markers LSCV095 and LSCV098. A rough indication for positioning the mutation is given by the three lod score unit interval around this 28.5 and corresponds to a physical distance of 100–150 kb.
Figure 2.

Histograms of allele frequencies for polled and normal unrelated goats for microsatellites LSCV082, LSCV095, LSCV098, LSCV202, and LSCV203. Genotypes were determined by denaturing polyacrylamide/urea gel electrophoresis after incorporation of [α-33P]dATP in the PCR products. Alleles were numbered from 1 to n, with 1 corresponding to the largest allele size and counted for the 35 Pp (hornless) goats and the 211 pp (with horns) goats. Total counts were then divided by the total number of alleles for each category, to estimate allelic frequencies. Haplotypes were then deduced for P chromosomes by analyzing the progeny of Pp individuals (see Table 2).
Table 3.
Number of PIS Chromosomes in Non Related Goats
| Family | Pp (polled) | pp (normal) | Total |
|---|---|---|---|
| 12 | 4 | 41 | 45 |
| 23 | 1 | 16 | 17 |
| 107 | 3 | 10 | 13 |
| 118 | 2 | 10 | 12 |
| 163 | 1 | 11 | 12 |
| 176 | 1 | 9 | 10 |
| 191 | 2 | 25 | 27 |
| 212 | 3 | 43 | 46 |
| 226 | 11 | 26 | 28 |
| 327 | 4 | 10 | 14 |
| 402 | 3 | 10 | 13 |
Table 2.
Microsatellite Haplotypes in the PIS Region for Hornless Individuals
| LSCV082 | PIS | LSCV095 | LSCV098 | LSCV202 | |
|---|---|---|---|---|---|
| 191 | 5 | P | 4 | 1 | 10 |
| 226 | 5 | P | 4 | 1 | 10 |
| 228 | 5 | P | 4 | 1 | 10 |
| 232 | 5 | P | 4 | 1 | 10 |
| 625 | 5 | P | 4 | 1 | 10 |
| 212 | 13 | P | 4 | 1 | 10 |
| 842 | 13 | P | 4 | 1 | 10 |
| 843 | 13 | P | 4 | 1 | 10 |
| 231 | 13 | P | 4 | 1 | 10 |
| 229 | 13 | P | 4 | 1 | 10 |
| 12 | 13 | P | 4 | 1 | 10 |
| 622 | 14 | P | N.D. | 1 | 10 |
| 143 | 14 | P | 4 | 1 | 10 |
| 618 | 5 | P | 4 | 1 | x |
| 239 | 5 | P | 4 | 1 | x |
| 163 | 14 | P | 4 | 1 | x |
| 176 | 14 | P | 4 | 1 | x |
| 620 | 14 | P | 4 | 1 | x |
| 107 | 14 | P | 4 | 1 | x |
| 144 | 14 | P | 4 | 1 | x |
| 23 | 14 | P | 4 | 1 | x |
| 634 | 14 | P | 4 | 1 | x |
| 230 | 14 | P | 4 | 1 | x |
| 237 | 5 | P | 4 | x | x |
| 657 | N.D. | P | 4 | x | x |
| 329 | 5 | P | x | x | x |
| 118 | 13 | p | x | x | x |
| 330 | 13 | P | x | x | x |
| 402 | 13 | P | x | x | x |
| 119 | 14 | P | x | x | x |
| 621 | 14 | P | x | 1 | x |
| 327 | x | P | N.D. | 1 | x |
| 429 | x | P | N.D. | x | x |
| 427 | 14 | P | x | 1 | 10 |
| 403 | 14 | P | x | N.D. | 10 |
Figure 3.

LD curves in the PIS region between markers LSCV203 and LSCV082. The curve displays a steep slope (eight lod score units) at markers LSCV095 and LSCV098. Values of λ were determined by the DISLAMB program (see text) and indicated for LSCV095, LSCV098, and LSCV202, for which significant LD was found. The four BACs of the ICC3 contig containing the five markers cover a physical distance of ∼300 kb (according to the restriction mapping profile).
Haplotype Analysis in Nonrelated P Carriers
Haplotype analysis was carried out for the heterozygote carriers of the PIS condition (a total of 35 unrelated individuals). Three haplotypes were found in PIS chromosomes for markers LSCV082, LSCV095, LSCV098, and LSCV202: 8-4-1-10, 13-4-1-10, and 14-4-1-10. Marker LSCV099 was not included because of the very high frequency of its allele 4 (0.95), making it uninformative for haplotype analysis. Three haplotypes were found unmodified in 13 chromosomes (Table 3). Recombination points were observed at different positions in the other haplotypes (Table 3), which made it possible to situate the PIS between LSCV082 and LSCV095. The marker order was ascertained by PCR inside the contig. The relative position of LSCV095 and LSCV098 was ascertained by PCR on 60 subclones from a Sau3AI 10-kb sublibrary constructed by partial digestion of the 376H9 BAC. Assuming a total distance of 300 kb between LSCV082 and LSCV202, the intermarker distance was estimated by measuring the proportion of recombinant chromosomes between marker pairs (from Table 3) times 300. It could therefore be estimated at 158, 17, 97, and 50 kb, for LSCV082–LSCV095, LSCV095–LSCV098, LSCV098–LSCV202, and LSCV202–LSCV203, respectively. Southern blot experiments revealed that LSCV098 and LSCV095 belonged to a common ∼20-kb SmaI fragment (not shown). Whereas the association is apparent with a unique allele for LSCV095 and LSCV098, three alleles of LSCV082 appeared to be frequently associated with P chromosomes. Although alleles 13 and 14 may derive from each other, the different size of allele 5 suggests the early occurrence of a recombination event between PIS and LSCV082. Haplotype analysis suggests that the mutation maps to the left half of the interval defined by linkage disequilibrium. As the three lod score units of the LD curve roughly corresponds to 100 kb, the causal mutation should lie in the 50 kb near LSCV095, in the LSCV082–LSCV095 interval.
DISCUSSION
Contig Assembly Through Chromosome Walking
Contig building in humans starts typically with scaffold YAC contigs obtained from human physical maps (Chumakov et al. 1995; Hudson et al. 1995). As BACs or PACs are more suited to fine mapping and sequencing, YAC contigs have to be translated into BAC or PAC contigs. As there are numerous STSs, microsatellites, and ESTs in humans, large BAC contigs are easily generated in this species, leaving only a few small gaps. These gaps have to be filled in later on by bidirectional walking. In livestock species however, as no overall physical map is available, contig assembly relies only on a walking strategy, starting from only two distant entry points. This can be a very tedious and time-consuming task. Comparative mapping, exploiting the wealth of data available in humans, could be an efficient way to find new entry points and thus speed up contig construction. With genes as interspecific markers, it has been shown in a previous work that such a strategy could be effective (Schibler et al. 1998a; Vaiman et al. 1999b), leading to four starting points in the ∼4-cM interval between TFDP2 and SOX14. However, closing gaps between these contig drafts requires a higher level of resolution, which could only be obtained with human ESTs. In previous work (Schibler et al. 1998a), 202 goat BACs identified with interspecific primers were mapped to the goat genome. Among BACs mapped at expected locations (according to previous comparative mapping data), a sample of 28 goat amplification products were sequenced and displayed, on average, a 90.3% similarity with the original sequence. In contrast, 10 inconsistently mapped clones were sequenced, which corresponds either to gene families or to random DNA fragments. In the same study, ESTs were much less efficient for recovering BACs than exonic sequences (23% success), certainly because human ESTs are mainly 3′ sequences, poorly conserved between ruminants and humans. In this study, the use of ESTs was even less efficient (probably owing to sampling): only 6 of 60 ESTs tested were cytogenetically mapped in the region of interest, leading to 4 new entry points. Progress in the contig construction was achieved by bidirectional walking, using BAC end sequences. This strategy, although efficient, is sequential and therefore time consuming. About 8 months were required for this contig assembly. Repetitive sequences (SINEs or LINEs), frequently encountered in either BAC ends or STS, made it more difficult by bringing the walking process abruptly to an end. This illustrates the specific problems of building contigs from low or middle redundancy libraries. In contrast, libraries of >10 genome equivalents obviously mitigate this problem in human physical mapping efforts. Nevertheless, our work shows that contigs larger than 1 Mb can be constructed with threefold genomic coverage libraries.
PIS Linkage Disequilibrium Mapping
Whereas LD has been extensively used in humans or mice, positional cloning experiments in domestic animals have seldom used this approach (Dunner et al. 1997; Riquet et al. 1999). This is rather paradoxical, as the population structure in domestic ruminants seems particularly adapted to LD analysis. Artificial insemination is extensively used in dairy cattle or alpine and saanen goats, and uses a limited number of animals as progenitors. This situation is highly favorable for observing founder effects, as is the situation of the human Finnish population (de la Chapelle and Wright 1998). The factor limiting the use of LD analysis has probably been the reduced number of polymorphic markers available in these species. This limitation has been overcome in our work by the oriented production of numerous microsatellites in a limited chromosome region.
The scientific history of the PIS mutation probably starts at the end of the nineteenth century, with the description of he-goat hermaphrodites (Petit 1894; Bourdelle 1903), and the total association between this phenotype and polledness (Asdell 1944). Since 1920, hornless bucks were extensively used for reproduction throughout the world to create hornless herds. One can estimate that ∼100 generations followed one another from the start of human selection. Assuming a recombination rate of θ, the number of observed nonrecombinant chromosomes between gene and marker can be roughly computed as NR = (1 − θ)n. With LSCV095 or LSCV098, for which 8 recombinants of 35 (Table 2) are observed in carrier chromosomes, this corresponds to a distance of 0.26 cM. The three lod score unit interval suggests even a smaller region of 0.1 cM (Fig. 3). Finally, haplotype analysis suggests that the mutation is located between LSCV095 and LSCV082, which are separated by a physical distance of ∼150 kb.
The linkage disequilibrium demonstrated here suggests that all of the animals used in this study, although belonging to two different goat breeds, saanen and alpine, can probably be traced back to a single common ancestor (as LSCV098 allele 1 is rare in the population and closely associated to the PIS state). The shape of the LD curve (output from DISMULT) is almost symmetrical, giving no indication of any recombination hot-spot in the region. There is clearly a steep increase in lod score from 21.5 to 28.5 near the two very close markers LSCV095 and LSCV098, demonstrating that the LD affects only a short region. Interestingly, whereas the haplotype analysis map the mutation between LSCV095 and LSCV082, the highest LD is observed on the other side for LSCV098. These apparently conflicting results are probably due to the low frequency of LSCV098 allele 1 (<0.1), associated with the mutation. In contrast, allele 4 of LSCV095 is much more frequent (0.23), rendering the disequilibrium less conspicuous. In any case, the λ values are very similar for these two markers and probably indicate that the causal mutation has to be searched in the vicinity of LSCV095. The sharp peak of the LD curve is rarely observed in human studies. This observation is probably due to the peculiarities of animal selection. The advantage of breeding polled goats generated a concerted effort of selection, with a systematic elimination of horned goats. This certainly generated a narrow bottleneck highly unusual in humans even in small populations. Such a situation makes it possible to better exploit LD and haplotype analysis to reach rapidly a gene-marker distance compatible with the search for coding sequences inside a BAC.
In a previous study (Vaiman et al. 1999b), it was shown that the 1-cM region encompassing PIS was homologous to the human region containing the Blepharophimosis Ptosis Epicanthus Syndrome (BPES) locus, a pathology combining premature ovarian failure (POF) and an excess of epiderm at the eyelids. The mapping data of our present paper do not contradict this homology. The recent mapping of a BPES-associated breakpoint inside a 45-kb cosmid, and the relative position of the three genes RBP1, RBP2, and COP, is completely consistent with the goat localization (De Baere et al. 1999). In this study the distance between RBP1 and COP is ∼100 kb, whereas the distance between COP and the translocation can be summed up at ∼200 kb. In our goat map, the distance between COP and CRBP is <150 kb, whereas the summation of BAC fragments from COP to LSCV095 can be estimated at <300 kb. From these mapping data, we still cannot exclude the possibility that PIS and BPES are caused by the homologous gene. This is also corroborated by several physiological elements. In hornless goats, the two normal bony protuberances are apparent (Dove 1935), suggesting that only the epidermal counterpart fails to correctly induce the horn bud, which can be matched to the human palpebral anomaly in BPES. The POF observed in human BPES is somewhat more difficult to relate to the sexual reversion observed in PIS goats. Although sex reversion can involve late mechanisms, ovarian dysgenesis results more probably from early developmental mechanisms. The cloning of a gene having such a drastic effect on sex determination in some mammals (goats) and not in others (humans) will certainly shed new light on the sex determination pathway. We have started searching for coding sequences in the 376H9 BAC and hopefully will soon be able to give clear answers to this fascinating question.
METHODS
BAC Library Screening, Restriction Analysis, and FISH Mapping of BAC Clones
Clones were obtained from our goat BAC library using PCR and DNA prepared as described elsewhere (Schibler et al. 1998b). Insert size was evaluated by NotI digestion of 200 ng of BAC DNA followed by field inversion gel electrophoresis (FIGE) on 1% agarose gels. SalI restriction sites were identified likewise. FISH mapping experiments were carried out according to our classical protocol (Bahri-Darwich et al. 1994).
Direct Sequencing of BAC Ends
The Nucleobond AX100 kit (Macherey-Nagel) was used to prepare BAC DNA suitable for end sequencing, with slight modifications to the manufacturer's recommendations. Clones were grown for 16 hr in 100 ml of LB broth with 12.5 mg/ml chloramphenicol, starting from a single colony. BACs were midiprepped with 8 ml of each buffer S1, S2, S3, and SDS was discarded using filters instead of centrifugation. The elution step was performed using 5 × 1 ml of 65°C preheated buffer N5. After isopropanol precipitation, DNA pellet was resuspended in 500 μl of TE and then subjected to a second ethanol precipitation. Typical yield of 20 μg was obtained with this protocol.
A total of 2.5 μg of DNA template was added to 8 μl of Big Dye Mix, 30 pmoles of T7L, or SP6L primers in an 11-μl reaction volume. After a 3-min denaturation step at 95°C, templates were subjected to 99 cycles of 30 sec at 95°C, 20 sec at 55°C, and 4 min at 60°C, using a Perkin-Elmer 9600 thermocycler. Samples were then loaded onto an ABI377 automated sequencer.
BACs Subcloning and Microsatellite/STS Isolation
About 500 ng of Nucleobond-prepared BAC were digested by Sau3A to completion and subcloned in a pGEM4z dephosphorylated vector. Sublibraries plated on 15-cm Petri dishes were then screened with (TG)12 and (TC)12 oligonucleotides labeled with the Boehringer DIG 3′ end-labeling kit, according to our standard protocol (Schibler et al. 1998a). Sequencing of positive clones made it possible to design PCR primers, making it possible to amplify the microsatellite locus. Random clones were also picked and sequenced to develop PCR primers corresponding to STS.
Family Structure, Genotyping, Recombinant Analysis, and LD Mapping
Family structure was described in a previous paper (Vaiman et al. 1996a). Briefly, 12 polled bucks heterozygous for the mutation (Pp) were crossed with 211 horned females (pp) and 23 polled females (Pp) to generate 293 progeny (9–72 per buck). Females had one to three offspring (1.22 on average). These families were used previously to localize the PIS at goat chromosome 1q43. The males and the 234 females are not related and were therefore used to evaluate linkage disequilibrium for the closest PIS-flanking markers.
Radioactive genotyping was performed as described previously (Vaiman et al. 1996b). Marker order was determined both by the physical map and analysis of individual haplotypes. DISMULT and DISLAMB software (Terwilliger 1995) were used to estimate linkage disequilibrium parameters. For the DISMULT analysis, the parameters of the diseqin source file were 0.01 for the disease frequency, the distances between markers were fixed at 150, 20, 100, and 50 kb for LSCV082/095, LSCV095/098, LSCV098/LSCV202, and LSCV202/LSCV203, respectively. LD was estimated at five points in each interval, and the maximal number of iterations was fixed at 800.
Acknowledgments
This work was funded by grants from INRA (AIP, sex autosomal determination in goats and pigs and AIP; Genome and Function). We acknowledge the constructive remarks formulated by both referees that permitted significant improvements of the manuscript.
The publication costs of this article were defrayed in part by payment of page charges. This article must therefore be hereby marked “advertisement” in accordance with 18 USC section 1734 solely to indicate this fact.
Footnotes
E-MAIL vaiman@biotec.jouy.inra.fr; FAX 00 33 1 34652478.
REFERENCES
- Asdell SA. The genetic sex on intersexual goats and a probable linkage with the gene for hornlessness. Science. 1944;99:124. doi: 10.1126/science.99.2563.124. [DOI] [PubMed] [Google Scholar]
- Bahri-Darwich I, Vaiman D, Olsaker I, Oustry A, Cribiu EP. Assignment of bovine synteny groups U27 and U8 to R-banded chromosome 12 and 27, respectively. Hereditas. 1994;120:261–265. doi: 10.1111/j.1601-5223.1994.00261.x. [DOI] [PubMed] [Google Scholar]
- Bourdelle M-E. Hermaphrodisme complexe des voies génitales et apparence masculine chez un bouc. Rev Vét Toulouse. 1903;11:682–688. [Google Scholar]
- Chumakov IM, Rigault P, Le Gall I, Bellanne-Chantelot C, Billault A, Guillou S, Soularue P, Guasconi G, Poullier E, Gros I, et al. A YAC contig map of the human genome. Nature. 1995;377:175–297. doi: 10.1038/377175a0. [DOI] [PubMed] [Google Scholar]
- Collignon J, Sockanathan S, Hacker A, Cohen-Tannoudji M, Norris D, Rastan S, Stevanovic M, Goodfellow PN, Lovell-Badge R. A comparison of the properties of Sox-3 with Sry and two related genes, Sox-1 and Sox-2. Development. 1996;122:509–520. doi: 10.1242/dev.122.2.509. [DOI] [PubMed] [Google Scholar]
- De Baere E, Van Roy N, Speleman F, Fukushima Y, De Paepe A, Messiaen L. Closing in on the BPES gene on 3q23: Mapping of a de novo reciprocal translocation t(3;4)(q23;p15.2) breakpoint within a 45-kb cosmid and mapping of three candidate genes, RBP1, RBP2, and beta′-COP, distal to the breakpoint. Genomics. 1999;57:70–78. doi: 10.1006/geno.1999.5747. [DOI] [PubMed] [Google Scholar]
- de la Chapelle A, Wright FA. Linkage disequilibrium mapping in isolated populations: The example of Finland revisited. Proc Natl Acad Sci. 1998;95:12416–12423. doi: 10.1073/pnas.95.21.12416. [DOI] [PMC free article] [PubMed] [Google Scholar]
- Deng HX, Abe K, Kondo I, Tsukahara M, Inagaki H, Hamada I, Fukushima Y, Niikawa N. Parental origin and mechanism of formation of polysomy X: An XXXXX case and four XXXXY cases determined with RFLPs. Hum Genet. 1991;86:541–544. doi: 10.1007/BF00201538. [DOI] [PubMed] [Google Scholar]
- Dove WL. Physiology of horn growth. J Exp Zool. 1935;69:347–404. [Google Scholar]
- Dunner S, Charlier C, Farnir F, Brouwers B, Canon J, Georges M. Towards interbreed IBD fine mapping of the mh locus: Double-muscling in the Asturiana de los Valles breed involves the same locus as in the Belgian Blue cattle breed. Mamm Genome. 1997;8:430–435. doi: 10.1007/s003359900462. [DOI] [PubMed] [Google Scholar]
- Foster JW, Dominguez-Steglich MA, Guioli S, Kowk G, Weller PA, Stevanovic M, Weissenbach J, Mansour S, Young ID, Goodfellow PN, et al. Campomelic dysplasia and autosomal sex reversal caused by mutations in an SRY-related gene. Nature. 1994;372:525–530. doi: 10.1038/372525a0. [DOI] [PubMed] [Google Scholar]
- Hudson TJ, Stein LD, Gerety SS, Ma J, Castle AB, Silva J, Slonim DK, Baystista R, Krughjaku L, Xu SH. An STS-based map of the human genome. Science. 1995;270:1945–1954. doi: 10.1126/science.270.5244.1945. [DOI] [PubMed] [Google Scholar]
- Koopman P, Gubbay J, Vivian N, Goodfellow P, Lovell-Badge R. Male development of chromosomally female mice transgenic for Sry. Nature. 1991;351:117–121. doi: 10.1038/351117a0. [DOI] [PubMed] [Google Scholar]
- Petit G. Nouvelle observation d'hermaphrodisme complexe des voies génitales chez un bouc. Recueil de Médecine Vétérinaire, Ecole d'Alfort. 1894;71:247–249. [Google Scholar]
- Ricordeau G, Lauvergne J-J. Hypothèse génétique unique pour expliquer la présence d'intersexués, de màles en excès et de mâles stériles en race caprine saanen. Ann Zootechnie. 1967;16:323–334. [Google Scholar]
- Riquet J, Coppieters W, Cambisano N, Arranz JJ, Berzi P, Davis SK, Grisart B, Farnir F, Karim L, Mni M, et al. Fine-mapping of quantitative trait loci by identity by descent in outbred populations: Application to milk production in dairy cattle. Proc Natl Acad Sci. 1999;96:9252–9257. doi: 10.1073/pnas.96.16.9252. [DOI] [PMC free article] [PubMed] [Google Scholar]
- Schibler L, Vaiman D, Oustry A, Giraud-Delville C, Cribiu EP. Comparative gene mapping: A fine-scale survey of chromosome rearrangements between ruminants and humans. Genome Res. 1998a;8:901–915. doi: 10.1101/gr.8.9.901. [DOI] [PubMed] [Google Scholar]
- Schibler L, Vaiman D, Oustry A, Guinec N, Dangy-Caye AL, Billault A, Cribiu EP. Construction and extensive characterization of a goat bacterial artificial chromosome library with threefold genome coverage. Mamm Genome. 1998b;9:119–124. doi: 10.1007/s003359900701. [DOI] [PubMed] [Google Scholar]
- Soller M, Padeh B, Wysoki M, Ayalon N. Cytogenetics of Saanen goats showing abnormal development of the reproductive tract associated with the dominant gene for polledness. Cytogenetics. 1969;8:51–67. doi: 10.1159/000130022. [DOI] [PubMed] [Google Scholar]
- Stevanovic M, Lovell-Badge R, Collignon J, Goodfellow PN. SOX3 is an X-linked gene related to SRY. Hum Mol Genet. 1993;2:2013–2018. doi: 10.1093/hmg/2.12.2013. [DOI] [PubMed] [Google Scholar]
- Swain A, Lovell-Badge R. Mammalian sex determination: A molecular drama. Genes & Dev. 1999;13:755–767. doi: 10.1101/gad.13.7.755. [DOI] [PubMed] [Google Scholar]
- Terwilliger JD. A powerful likelihood method for the analysis of linkage disequilibrium between trait loci and one or more polymorphic marker loci. Am J Hum Genet. 1995;56:777–787. [PMC free article] [PubMed] [Google Scholar]
- Tommerup N, Shhempp W, Meinecke P, Pedersen S, Bolund L, et al. Assignment of an autosomal sex reversal locus (SRA1) and campomelic dysplasia (CMPD1) to 17q24.3-q25.1. Nat Genet. 1993;4:170–173. doi: 10.1038/ng0693-170. [DOI] [PubMed] [Google Scholar]
- Vaiman D, Koutita O, Oustry A, Elsen JM, Manfredi E, Fellous M, Cribiu EP. Genetic mapping of the autosomal region involved in XX sex-reversal and horn development in goats. Mamm Genome. 1996a;7:133–137. doi: 10.1007/s003359900033. [DOI] [PubMed] [Google Scholar]
- Vaiman D, Schibler L, Bourgeois F, Oustry A, Amigues Y, Cribiu EP. A genetic linkage map of the male goat genome. Genetics. 1996b;144:279–305. doi: 10.1093/genetics/144.1.279. [DOI] [PMC free article] [PubMed] [Google Scholar]
- Vaiman D, Billault A, Tabet-Aoul K, Schibler L, Vilette D, Soravito C, Cribiu EP. Construction and characterization of a sheep BAC library of three genome equivalents. Mamm Genome. 1999a;10:585–587. doi: 10.1007/s003359901049. [DOI] [PubMed] [Google Scholar]
- Vaiman D, Schibler L, Oustry-Vaiman A, Pailhoux E, Goldammer T, Stevanovic M, Furet JP, Schwerin M, Cotinot C, Fellous M, et al. High-resolution Human/Goat comparative map of the goat Polled/Intersex syndrome (PIS): The human homologue is contained in a human YAC from HSA3q23. Genomics. 1999b;56:31–39. doi: 10.1006/geno.1998.5691. [DOI] [PubMed] [Google Scholar]
- Zanaria E, Bardoni B, Dabovic B, Calvari V, Fraccaro M, Zuffardi O, Camerino G. Xp duplications and sex reversal. Philos Trans R Soc Lond B Biol Sci. 1995;350:291–296. doi: 10.1098/rstb.1995.0164. [DOI] [PubMed] [Google Scholar]
- Zlotogora J, Sagi M, Cohen T. The blepharophimosis, ptosis, and epicanthus inversus syndrome: Delineation of two types. Am J Hum Genet. 1983;35:1020–1027. [PMC free article] [PubMed] [Google Scholar]