Abstract
Selenoprotein P (Sepp1) is an important protein involved in selenium (Se) transport and homeostasis. Severe neurologic dysfunction develops in Sepp1 null mice (Sepp1−/−) fed a selenium-deficient diet. Sepp1−/− mice fed a selenium-deficient diet have extensive degeneration of the brainstem and thalamus, and even when supplemented with selenium exhibit subtle learning deficits and altered basal synaptic transmission and short-term plasticity in the CA1 region of the hippocampus. The goal of this study was to delineate the regional progression of neurodegeneration in the brain, determine the extent of neuronal cell death, and evaluate neurite structural changes within the hippocampus of Sepp1−/− mice. Whole brain serial sections of wild-type and Sepp1−/− mice maintained on selenium-deficient or supplemented diets over the course of 12 days from weaning were evaluated with amino cupric silver neurodegeneration stain. The neurodegeneration was present in all regions upon weaning and progressed over 12 days in Sepp1−/− mice fed selenium-deficient diet, except in the medial forebrain bundle and somatosensory cortex where the neurodegeneration developed post-weaning. The neurodegeneration was predominantly axonal, however the somatosensory cortex and lateral striatum showed silver-stained neurons. Morphologic analysis of the hippocampus revealed decreased dendritic length and spine density, suggesting that loss of Sepp1 also causes subtle changes in the brain that can contribute to functional deficits. These data illustrate that deletion of Sepp1, and presumably selenium deficiency in the brain, produce both neuronal and axonal degeneration as well as more moderate and potentially reversible neurite changes in the developing brain.
Keywords: Selenoprotein P, Amino cupric silver stain, Hippocampus morphology, Selenium deficiency, Axonopathy
1. Introduction
Selenium (Se) is an essential trace element that exerts its function as a constituent of selenoproteins, many of which are involved in metabolic and antioxidant defense pathways (Chen et al. 2003; Burk et al. 2009). Regulation of selenium levels is important in balancing the detrimental effects of both selenium toxicity and deficiency. The brain is resistant to fluctuations in selenium levels and during conditions of dietary depletion of selenium, brain selenium levels are maintained while levels elsewhere in the body are reduced (Whanger 2001; Chen et al. 2003; Nakayama et al. 2007). This suggests that selenium is essential to normal brain function and previous investigations have supported a role for selenoprotein P (Sepp1) in the maintenance and utilization of brain selenium (Hill et al. 2003; Schomburg et al. 2003).
Sepp1 is a selenium rich circulating extracellular protein, produced in the liver, brain and other tissues (Burk et al. 2005; Burk et al. 2009). Sepp1 delivers selenium to brain and testes through interaction with the apolipoprotein E receptor 2 (apoER2), and once in the cells, selenium is then incorporated into selenoproteins during their synthesis (Burk et al. 2005; Burk et al. 2009). Deletion of Sepp1 in mice decreases brain selenium levels and feeding these mice a selenium-deficient diet results in severe neurological impairments and death (Hill et al. 2004; Valentine et al. 2005; Valentine et al. 2008). In our previous studies, we identified extensive axonal degeneration in the brainstem and thalamus of Sepp1−/− mice fed a selenium-deficient diet for 14 days (Valentine et al. 2008). Neurodegeneration and neurological dysfunction was largely mitigated and death prevented in Sepp1−/− mice maintained on a selenium-enriched diet. Interestingly, even though selenium supplementation prevented degenerative change detectable by silver staining in the hippocampus, Sepp1−/− mice showed subtle learning deficits and altered basal synaptic transmission and short-term plasticity in the CA1 region of the hippocampus (Peters et al. 2006).
The present study was performed to delineate the regional progression of neurodegenerative changes in the brain, determine the extent of neuronal cell death, and evaluate non-lethal structural changes within the hippocampus of post natal Sepp1−/− mice. The temporal relationship of regional degeneration and the contribution of neuronal cell death was assessed using amino-cupric silver staining in whole brain serial sections prepared from Sepp1−/− and Sepp1+/+ mice that were maintained on a selenium-deficient diet after weaning. Dendritic morphology, including dendritic length and spine density, of the CA1 hippocampal region was evaluated following Golgi impregnation. The data present three regions of injury not previously recognized, provide evidence that certain regions of brain are highly susceptible to loss of Sepp1 during development, and support a contribution of dendritic structural change to the reported functional deficits observed in the hippocampus of Sepp1−/− mice. In some regions degeneration was observed upon weaning and generally progressed in severity throughout the course of the selenium-deficient diet regimen, and in two regions involved neuronal as well as axonal degeneration. Based on these results, detailed analysis of gliosis, oxidative stress, and selenium concentrations were performed. Together the results further characterize the phenotypic changes in the deletion of Sepp1 and provide insight on the neurological dysfunction associated with compromised Sepp1 function and dietary selenium deficiency.
2. Results
2.1 Morphologic Assessment and Staining Quantification
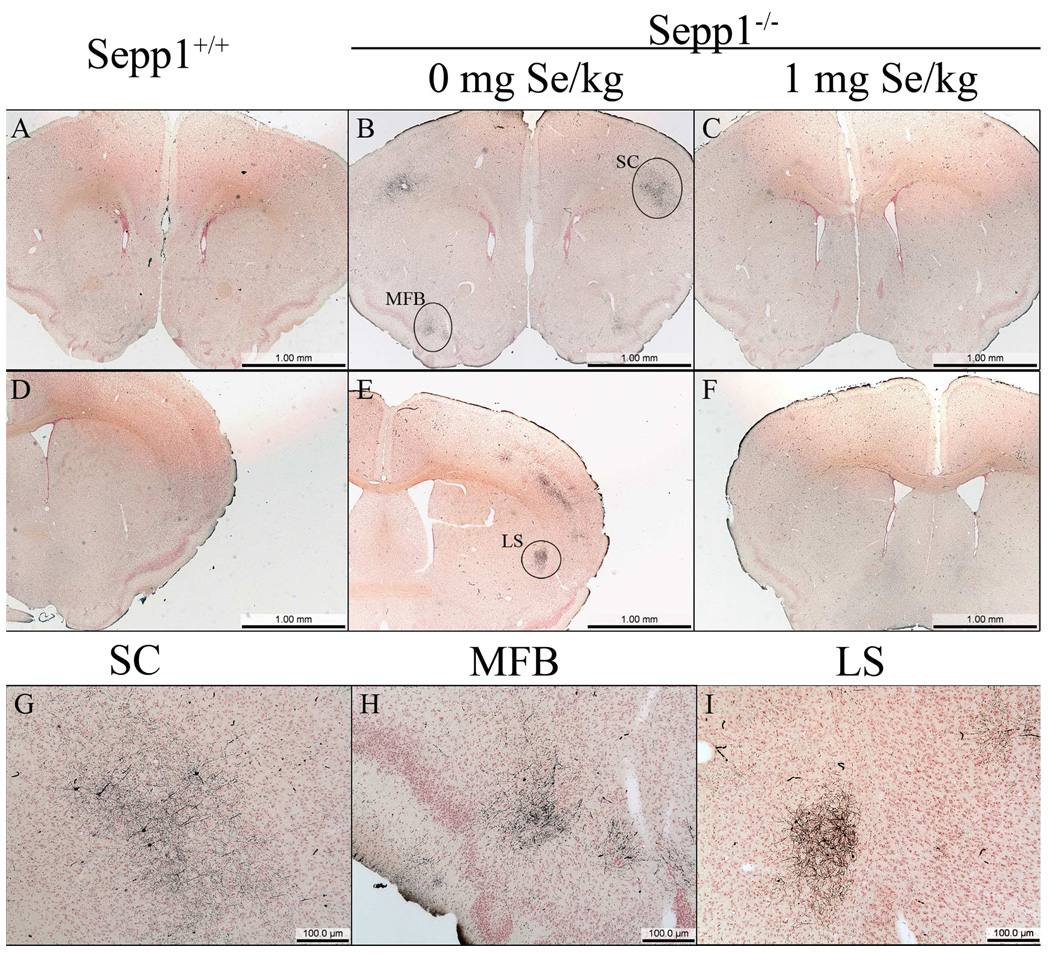
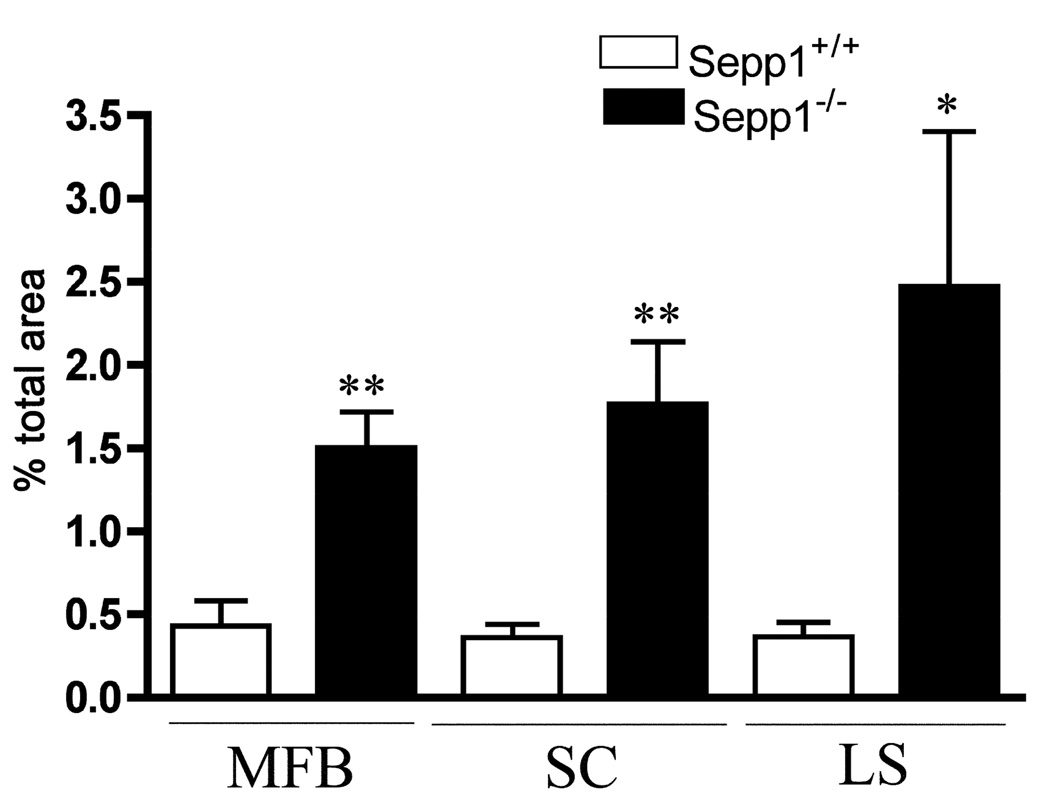
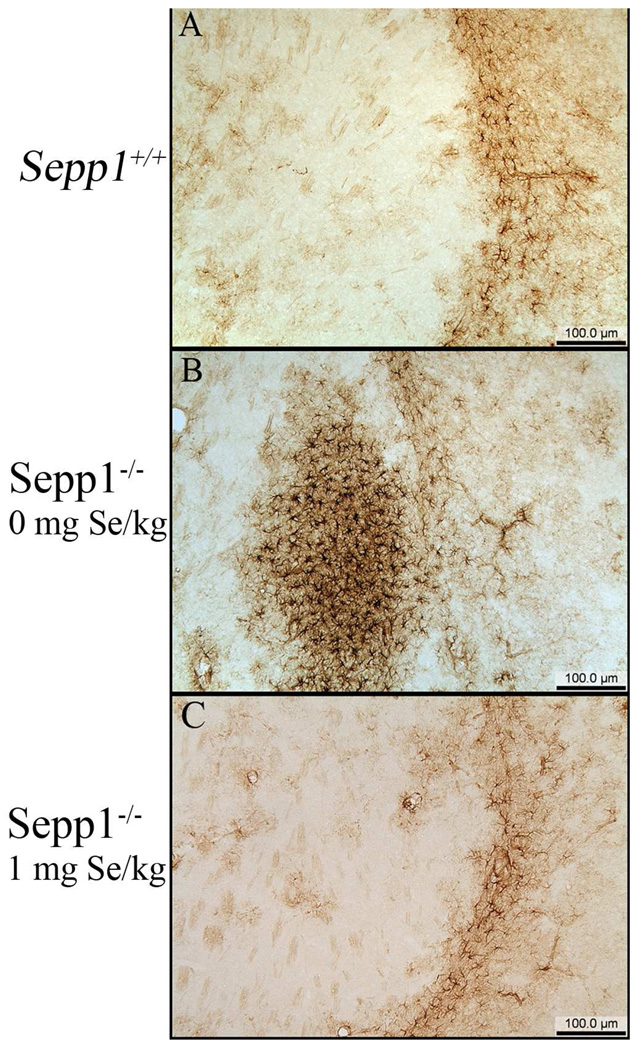
In the present study, silver degeneration staining was used to examine serial sections prepared from the entire brain, including regions more rostral to those reported previously in a similar post-weanling Sepp1−/− model (Valentine et al. 2008). In Sepp1−/− mice fed a selenium-deficient diet for 12 days post-weaning, three distinct areas of degeneration were observed in the rostral regions (Fig. 1). The three areas demonstrating staining were the medial forebrain bundle (MFB) (Fig. 1B and H), the somatosensory cortex (SC) (Fig. 1B and G), and the lateral striatum (LS) (Fig. 1E and I). In comparison, no silver staining was detected in the corresponding brain regions of Sepp1+/+ mice (Fig. 1A and D and Fig. 2) or the Sepp1−/− mice fed a high selenium diet after weaning (Fig. 1C and F). Analyses of the relative levels of silver staining determined by bi-level thresholding demonstrated a significant increase in degeneration in the MFB, SC, and LS of Sepp1−/− compared to Sepp1+/+ mice (Fig. 2). Reactive gliosis, as indicated by the presence of glial fibrillary acidic protein (GFAP)-positive astrocytes, was also present in these regions exhibiting significant silver staining of Sepp1−/− mice but not in the Sepp1+/+ mice or the Sepp1−/− mice fed a high selenium diet (Fig. 3).
Fig.1.
Degeneration and gliosis in the somatosensory cortex, medial forebrain bundle, and lateral striatum. Silver stained sections revealed the presence of degeneration in the somatosensory cortex (SC) and medial forebrain bundle (MFB) of Sepp1−/− mice fed a selenium-deficient diet (B) that was not present in Sepp1+/+ mice (A) or Sepp1−/− mice fed a high selenium diet (C). Silver staining was also present in the lateral striatum (LS) of Sepp1−/− mice fed a selenium-deficient diet (E) but not in Sepp1+/+ mice (D) or Sepp1−/− mice fed a high selenium diet (F). Higher magnification of the affected regions in the Sepp1−/− mice demonstrated the presence of degenerated axons in the SC (G), MFB (H), and LS (I) and degenerated neurons in the SC and LS. Sections were obtained from mice 12 days post weaning with sections A–C, G, and H obtained at Bregma 1.18 and sections D–F, and I at Bregma 0.14.
Fig. 2.
Quantification of the amino cupric staining in the medial forebrain bundle (MFB), somatosensory cortex (SC), and lateral striatum (LS) in Sepp1−/− mice and Sepp1+/+ mice fed a selenium-deficient diet. Comparisons of the positively stained areas showed significant increases in all three brain regions (one-tailed t-test, *p < 0.05 and **p < 0.01, n = 3 per genotype). Values represent the mean values and SE.
Fig. 3.
Reactive gliosis in the lateral striatum. Representative sections from the striatum of Sepp1+/+ (A) and Sepp1−/− mice fed a selenium-deficient diet (B) or a high selenium diet (C) were stained by immunohistochemistry for glial fibrillary acidic protein (GFAP). Increased GFAP staining of reactive astrocytes are shown in the LS of the Sepp1−/− brain compared to the Sepp1+/+ brain and the Sepp1−/− fed a high selenium diet. Sections were obtained from mice 12 days post weaning at Bregma 0.14.
2.2 Degeneration and brain selenium levels as a function of time on a selenium-deficient diet post weaning
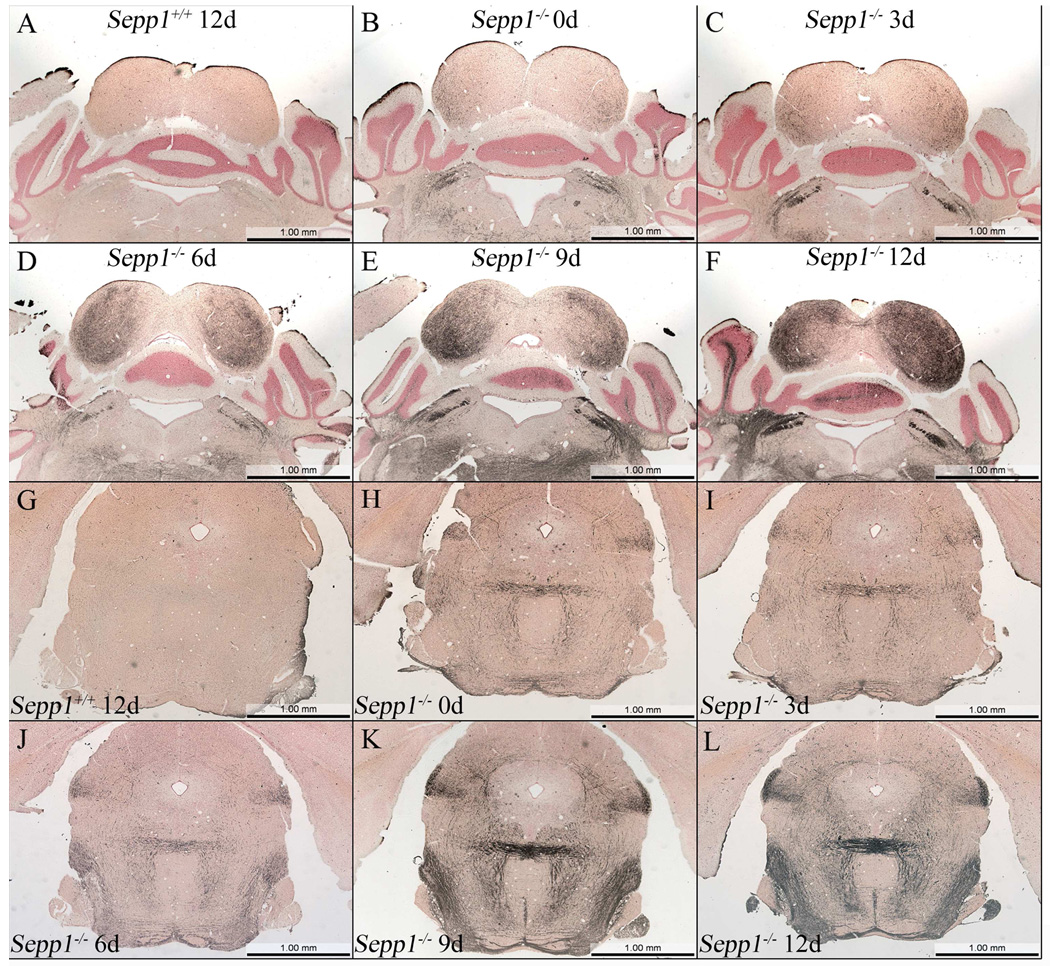
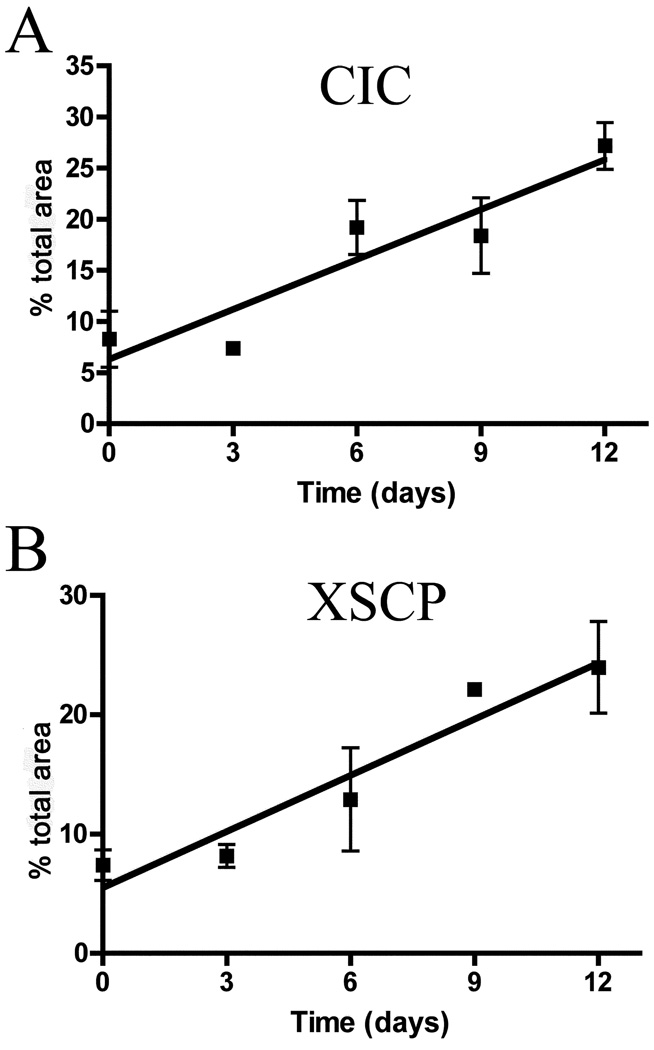
To delineate the progression of early neuronal and axonal degeneration, Sepp1−/− mice were perfused and their brains harvested upon weaning or at 3, 6, 9, or 12 days post weaning on a selenium-deficient diet. To assess the degree of neurodegeneration present over the five time points, amino cupric silver staining levels were examined. Figure 4 shows the progression of injury in two brain regions, the caudal thalamus (Bregma −4.24) and the rostral brainstem (Bregma −5.20) that were reported to exhibit extensive degeneration by 14 days post weaning (Valentine et al. 2008). Figure 4A shows the rostral brainstem of a Sepp1+/+ mouse fed a selenium-deficient diet for 12 days, while Fig. 4B, C, D, E and F show the same region in Sepp1−/− mice upon weaning (B), and at 3 (C), 6 (D), 9 (E), and 12 (F) days after being weaned onto a selenium-deficient diet. Staining was present at weaning in the central nucleus of the inferior colliculus (CIC), ventral spinocerebellar tract, superior cerebellar peduncle, and caudal pontine reticular nucleus, and became darker and more extensive over the course of 12 days, suggesting that the damage to these regions initiates prior to and progresses after weaning. A similar staining progression was observed in the caudal thalamus. Figure 4G shows the caudal thalamus of a Sepp1+/+ mouse fed selenium-deficient diet for 12 days, while Fig. 4H, I, J, K and L show the same region in Sepp1−/− mice upon weaning (H), 3 (I), 6 (J), 9 (K), and 12 (L) days after being weaned onto the selenium-deficient diet. Upon weaning, staining was observed in the decussation of the cerebellar peduncle (XSCP), tectospinal tract, paralemniscal nucleus, external cortex of the inferior colliculus, and the brachium of the inferior colliculus. To establish whether there was a correlation between the level of degeneration and time from weaning, bi-level thresholding and area of staining analysis was performed on two specific regions, the CIC and XSCP, and Pearson correlation analysis was performed. Figure 5 shows that there was a significant correlation between the area of staining and the duration from weaning in both the CIC (r2 = 0.8672, p = 0.0107) and XSCP (r2 = 0.9239 and p = 0.0046). Neurodegeneration in the striatum was also evident at weaning. However, not all staining in the more rostral regions was present at weaning, with the staining in the MFB appearing at 6 days after weaning, and staining in the SC was not observed until 12 days after weaning.
Fig. 4.
Silver staining of 2 brain regions in Sepp1+/+ and Sepp1−/− as a function of time on selenium-deficient diet. Representative sections obtained through Bregma 7.08 showed absence of staining in the Sepp1+/+ mice on day 12 (A) and the progression of staining in the Sepp1−/− mice on days 0 (B), 3 (C), 6 (D), 9 (E) and 12 (F). Sections obtained through Bregma 4.24 also showed an absence of staining in the Sepp1+/+ mice on day 12 (G) and the progression of staining in the Sepp1−/− mice on days 0 (H), 3 (I), 6 (J), 9 (K), or 12 (L).
Fig. 5.
Correlation analysis of the degeneration determined by area of positive silver staining in the central nucleus of the inferior colliculus (CIC) and the decussation of the cerebellar peduncle (XSCP) of Sepp1−/− mice fed selenium-deficient diet and time from weaning. Pearson correlation analysis was performed for (A) the CIC (r2 = 0.8672, p = 0.0107, n = 3 per genotype) and (B) the XSCP (r2 = 0.9239 and p = 0.0046, n = 3 per genotype) and show a significant relationship between staining and time. Values represent the mean values and SE.
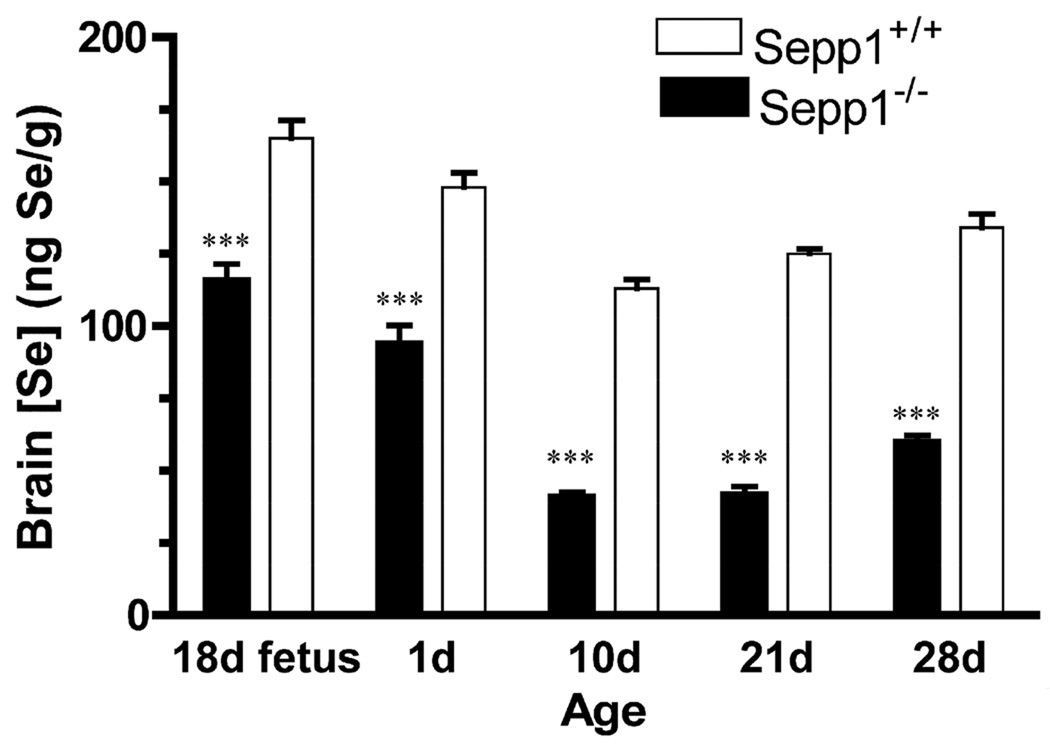
To evaluate the levels of selenium, the brains of Sepp1+/+ and Sepp1−/− mice were collected at fetal day 18, and at postnatal days 1, 10, 21, and 28. The dams and pups were fed a diet containing 0.25 mg selenium/kg. Pups were weaned at 21 days of age. At all time points examined, brain selenium levels were significantly lower in the Sepp1−/− relative to the Sepp1+/+ mice (Fig. 6). Interestingly, despite the differences in brain selenium levels both the Sepp1+/+ and Sepp1−/− groups exhibited a similar trend in brain selenium over time. Selenium levels were highest in utero and decreased postnatally until weaning, increasing thereafter.
Fig. 6.
Brain selenium levels in Sepp1+/+ and Sepp1−/− mice. Brain selenium concentrations were measured in Sepp1+/+ and Sepp1−/− mice on a diet containing 0.25 mg selenium/kg on fetal day 18, postnatal days 1, 10, 21 (weaning), and 28. Brain levels of selenium are significantly lower in Sepp1−/− mice than Sepp1+/+ at all time points examined. Statistical analysis was performed using a 1-tailed t-test (*** p < 0.001, values shown are means and SE with n > 5 per genotype).
2.3 Neuronal and axonal lesions
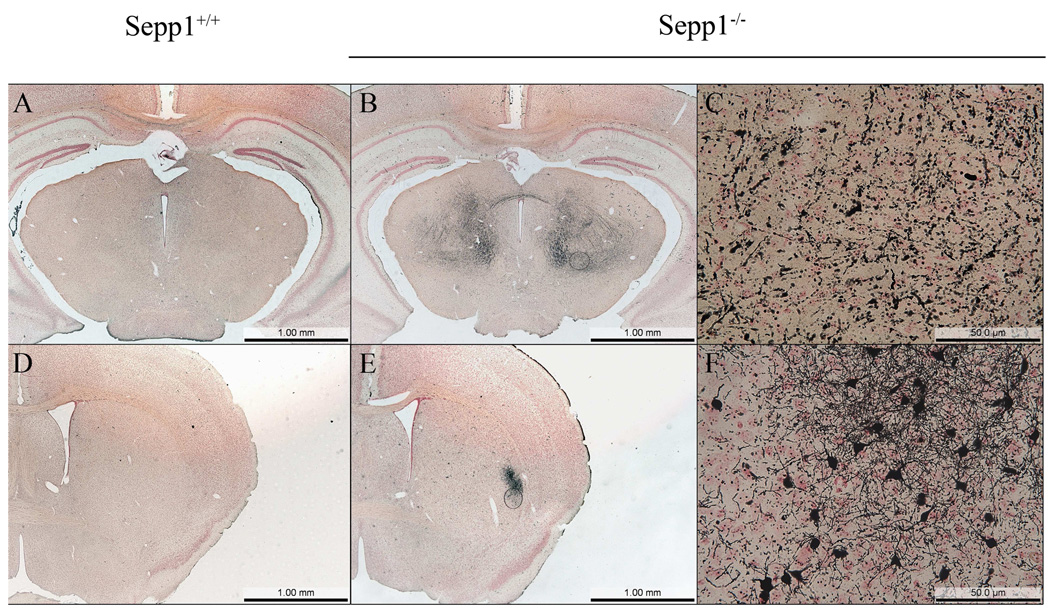
In a previous study only axonal degeneration was observed in Sepp1−/− mice fed a selenium-deficient diet for 14 days after weaning (Valentine et al. 2008). In the study reported here, earlier time points were examined to assess whether neuron cell death precedes axonal degeneration. In examining the brains of Sepp1−/− mice fed a selenium-deficient diet over the course of 12 days, it was found that the majority of staining was axonal (Fig. 7). However, the lesions observed in the LS on day 0 (Fig. 7) and in the SC on day 12 (Fig. 1G) showed the presence of positively stained neurons.
Fig. 7.
Axonal and neuronal degeneration are both present in Sepp1−/− mice fed a selenium-deficient diet. Representative sections stained using the amino cupric silver staining method are shown for thalamus (Bregma −2.46) and lateral striatum (Bregma 0.14) in both Sepp1+/+ mice fed selenium-deficient diet for 12 days after weaning (A and D) and Sepp1−/− mice fed a selenium-deficient diet (B,C, E, and F). Injury in the thalamus was characterized by axonal degeneration alone (B and C, a higher magnification of the indicated region in B) whereas degeneration in the lateral striatum included both axons and neurons (E and F, a higher magnification of the indicated region in E).
2.4 Morphologic changes in Sepp1−/− mouse hippocampus
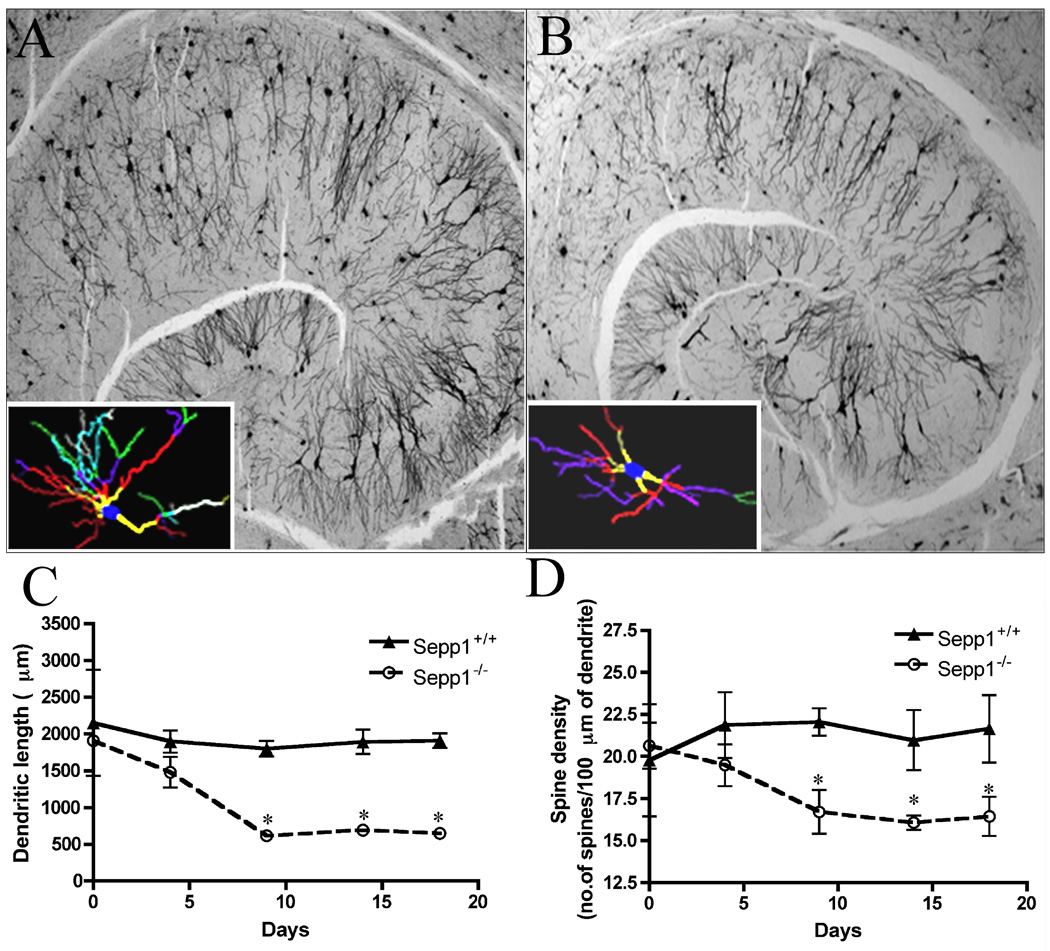
Sepp1−/− mice have disrupted hippocampus-dependent learning, showing severe alterations in synaptic transmission, short-term plasticity, and long-term potentiation in hippocampus area CA1 synapses (Peters et al. 2006), although no positive silver staining in the hippocampus of Sepp1−/− mice fed a selenium-deficient diet has been observed (Valentine et al. 2008). To determine whether more subtle changes than cell death contribute to the functional deficits in the hippocampus, Golgi impregnation was performed on brains of Sepp1+/+ and Sepp1−/− mice fed a high selenium diet for 28 days and then switched to a selenium-deficient diet (day 0) and sacrificed 0, 4, 9, 14, or 18 days on the selenium-deficient diet. Representative images of Golgi impregnated hippocampal sections are presented in Fig.8 showing the traced CA1 pyramidal neurons from Sepp1+/+ (A) and Sepp1−/− (B) mice. Neuroexplorer assisted neuronal morphometry revealed significant decreases in both dendrite length (Fig. 8C) and spine density (Fig. 8D) in Sepp1−/− mice fed the selenium-deficient diet for 9, 14, or 18 days as compared to the Sepp1+/+ mice.
Fig. 8.
Photomicrographs of Golgi impregnated 50 µm thick mouse hippocampal sections with representative tracings of CA1 pyramidal neurons from Sepp1+/+ (A) and Sepp1−/− (B) mice. Mice were fed with a high selenium-deficient 28 days and then switched to a selenium-deficient diet for 18 days. Hippocampus morphology shows important differences between Sepp1−/− and Sepp1+/+ mice. Inset A and B pyramidal neurons with no breaks in the staining along the dendrites from the CA1 sector of the hippocampus were traced and counted by the Neurolucida system at 100× under oil immersion (MicroBrightfield, VT). Colors indicate the degree of dendritic branching (yellow = 1°, red = 2°, purple = 3°, green = 4°, turquoise = 5°, gray = 6°, for color figures please refer to the online manuscript). Total dendritic length (C) and spine density (D) were significantly decreased in Sepp1−/− mice fed a selenium-deficient diet for 9, 14, and 18 days. Values represent means (SE) and statistical analysis was performed using a 1-tailed t-test (* p < 0.05, n > 3 per group).
2.5 Brain F2-isoprostane levels in Sepp1−/− mice maintained on a selenium-deficient diet
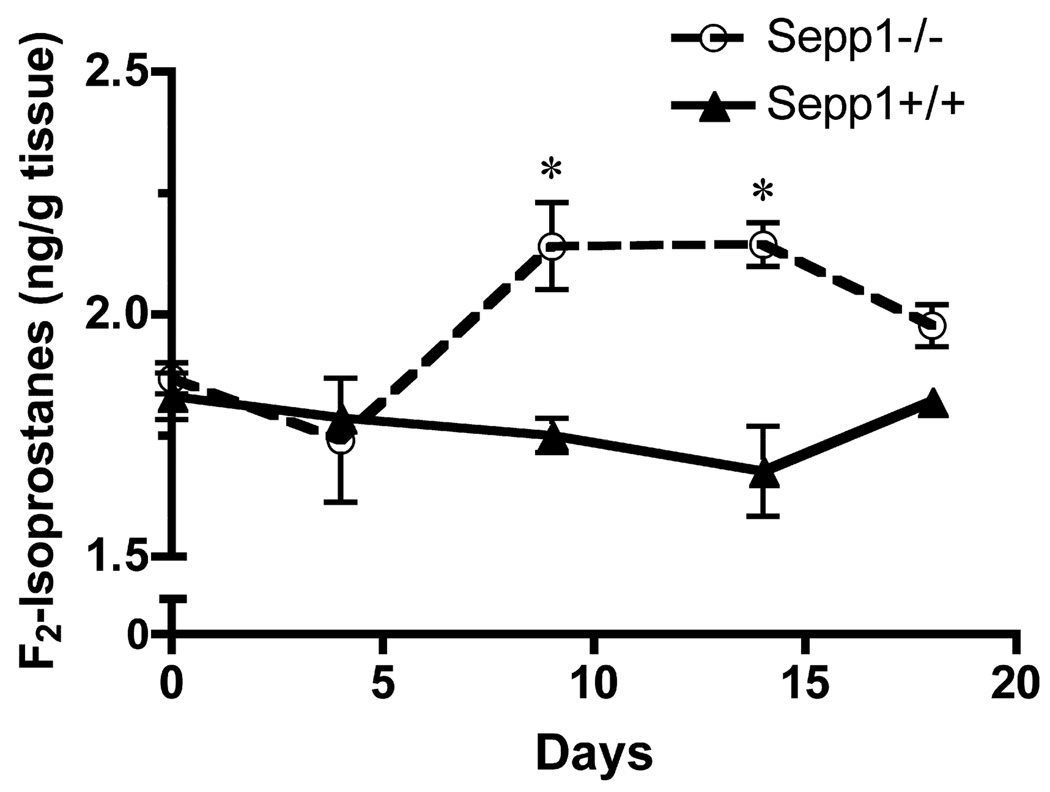
We have shown that deletion of Sepp1 causes decreased brain selenium levels, therefore we hypothesized that there would be increased oxidative stress in the brains of the knockout mice. Selenium is an essential trace element that is integrated as selenocysteine into several enzymes involved in redox homeostasis, including glutathione peroxidases and thioredoxin reductases (Zhang et al. 2010). F2-Isoprostanes were measured in the cerebrum of Sepp1−/− and Sepp1+/+ mice fed a diet containing 1 mg selenium/kg for 28 days beginning at weaning and then switched to a selenium-deficient diet (day 0). They were sacrificed 0, 4, 9, 14, or 18 days after the switch in diet. Sepp1+/+ mice had no significant changes in F2-Isoprostanes over this time period (Fig. 9). However, Sepp1−/− mice had significantly higher levels of F2-Isoprostanes starting at 9 days after weaning and continuing to 14 days after being switched to the selenium-deficient diet.
Fig. 9.
Whole brain F2-isoprostanes were significantly increased in Sepp1−/− mice relative to Sepp1+/+. Brains from Sepp1−/− and Sepp1+/+ mice fed a diet containing 1 mg selenium/kg for 28 days and then switched to a selenium-deficient diet (day 0) for 18 days were collected and cerebral F2-isoprostanes measured. Values represent means (SE) and statistical comparisons were performed using a one-tailed t-test (* p < 0.05, n > 3 per group).
3. Discussion
Selenium is an essential nutrient required for metabolic and antioxidant pathways. Its importance to the brain is illustrated by redistribution and maintenance of brain selenium levels in rodents fed a selenium-deficient diet at the expense of selenium levels in other tissues (Whanger 2001; Chen et al. 2003). Selenium deficiency has been observed in Keshan disease and low selenium levels have been observed in sepsis (Guanqing 1979; Forceville et al. 1998). Recently, genetic variants of Sepp1 have been associated with an increased risk of non-small cell lung cancer, colorectal cancer, and prostate cancer (Cooper et al. 2008; Peters et al. 2008; Gresner et al. 2009). However it is unknown whether these variants increase the risk of neurodegenerative diseases. As Sepp1 is the major selenium transport protein, it is important to characterize the degenerative effects of Sepp1 deletion-mediated selenium deficiency in the brain.
Our previous studies have identified the brainstem and the thalamus as regions severely affected by Sepp1 deletion contributing to the deterioration of motor function observed in Sepp1−/− mice fed a selenium-deficient diet (Valentine et al. 2008). Here we re-examined these areas as a function of time in Sepp1−/− mice fed a selenium-deficient diet, along with more rostral brain regions, over the course of 12 days from weaning. This analysis revealed several new characteristics regarding the regional progression and neuronal involvement of neurodegeneration. In addition to the brainstem and thalamus, the MFB, SC and LS showed extensive silver staining. The appearance of neurodegeneration in these rostral regions and the hindbrain are consistent with recent reports showing a gradient of selenium concentrations and selenoprotein distributions among differing brain regions. Notably, Kuhbacher et al. have reported that selenium levels in rat brain were the highest in hippocampus, cerebellum, brainstem, and ventricles, while Zhang et al reported that the hippocampus, olfactory area, cerebellar cortex and isocortex contain the most selenoproteins in mouse brains, while the white matter of the brain and the corpus collosum contain the least (Zhang et al. 2008; Kuhbacher et al. 2009). Lesions in both the SC and LS may contribute to the motor deterioration observed in Sepp1−/− mice (Hill et al. 2004), as lesions in the LS have been associated with severe motor deficits and the SC is involved in motor learning (Vidoni et al. 2010; Rogers et al. 2001). The MFB connects the midbrain tegmentum and the nucleus accumbens, and is involved in the reward system (Hernandez et al. 2006). Currently there is no evidence of dysfunctions of the reward system in Sepp1−/−, so the functional relevance of this lesion remains to be determined.
The majority of the brain regions exhibiting degeneration in the Sepp1−/− mice displayed some neurodegenerative change at the time of weaning. In contrast, the SC and the MFB displayed neurodegeneration only at post-weaning time points. Alloway et al. have shown that the neurons in the SC project to the LS (Alloway et al. 2006), suggesting that the more delayed neurodegeneration observed in the SC may arise as sequelae to striatal injury. The neurodegeneration in Sepp1−/− mouse brain is predominantly axonal. However, the time window for detection of neuronal degeneration by the silver staining method is considerably narrower than for detection of axonal degeneration. This suggests that in the previous studies that examined more advanced stages of degeneration (Valentine et al. 2008), neuronal debris may have been removed, therefore biasing the analysis toward detection of axonal degeneration. The present study examined earlier stages of degeneration and supported axonal degeneration as the predominant lesion for the majority of regions, but did identify dead neurons in the LS and SC.
The mechanism by which the neurodegeneration occurs in Sepp1−/− mice maintained on a selenium-deficient diet remains to be determined. Analysis of brain selenium levels from in utero to post-weaning reveals that selenium levels are significantly decreased in Sepp1−/− mice fed a selenium-deficient diet prior to being weaned as compared to Sepp1+/+ mice. Even though the pups receive selenium through the placenta and milk, Sepp1−/− mice have lower brain selenium levels, which would lead to decreased selenoproteins. Many selenoproteins are involved in oxidative stress responses, and indeed increased F2-isoprostanes were observed in the brains of Sepp1−/− mice on a selenium deficient diet. Oxidative damage is typically associated with cell death in neurons and degeneration of axons (Fischer et al. 2010). However, determining whether increased oxidative stress, e.g. from the loss of selenium dependent antioxidant enzymes, is a primary contributing event to the degeneration of neurons and axons in Sepp1−/− mice will require further investigation.
One area of the brain in Sepp1−/− mice that has not exhibited neurodegeneration by silver staining in previous studies or this investigation is the hippocampus. This is somewhat surprising considering that the hippocampus contains high levels of selenium and selenoproteins (Zhang et al. 2008) and that Wirth et al. have found neurodegeneration in both the hippocampus and cerebral cortex of mice lacking all selenoproteins due to the absence of the tRNA required for selenocysteine (tRNA[Ser]Sec) (Wirth et al. 2010). Although Sepp1−/− mice had low brain selenium levels, they appear to incorporate the available selenium into selenoproteins adequately to maintain the viability of structures within the hippocampus. However previous reports of functional deficits in the hippocampus suggest that Sepp1−/− mice may experience less severe structural changes within the hippocampus. In Golgi impregnated brains of Sepp1−/− mice fed a selenium-deficient diet we observed altered dendritic morphology involving decreases in both dendrite length and spine density of the CA1 hippocampal region relative to Sepp1+/+ mice. This altered morphology may account for our previous observation that Sepp1−/− mice have disrupted hippocampus-dependent learning, showing severe alterations in synaptic transmission, short-term plasticity, and long-term potentiation in hippocampus area CA1 synapses (Peters et al. 2006). It is unlikely that the hippocampus is the only area in the Sepp1−/− mice that shows altered cell morphology due to deletion of Sepp1 or selenium deficiency: however morphological analysis remains to be determined for other regions.
In summary, deletion of Sepp1 in mice results in both degenerative loss of neurons and axons as well as subtle changes in morphology of cells in the hippocampus that may contribute to functional deficits. Axonal degeneration appears to be the predominant event with neuronal loss observed in fewer brain regions during the time points examined in this study. The role of selenoproteins in maintaining cellular redox status suggests that oxidative injury may be a contributing process, and the progression of brain injury was accompanied by elevations in F2-isoprostanes in the present study. However, whether the increase in lipid peroxidation was a contributing event to, or a result of, axon or neuron degeneration is not clear and the molecular processes underlying Sepp1−/− mediated degeneration will require further investigation. Because loss of selenium transport in the brain by Sepp1 results in neurodegeneration and may occur in humans as a result of environmental factors or genetic variation, further studies on the functional roles of Sepp1 will advance our understanding of the potential role of Sepp1 in neurodegenerative diseases.
4. Experimental Procedure
4.1 Animals
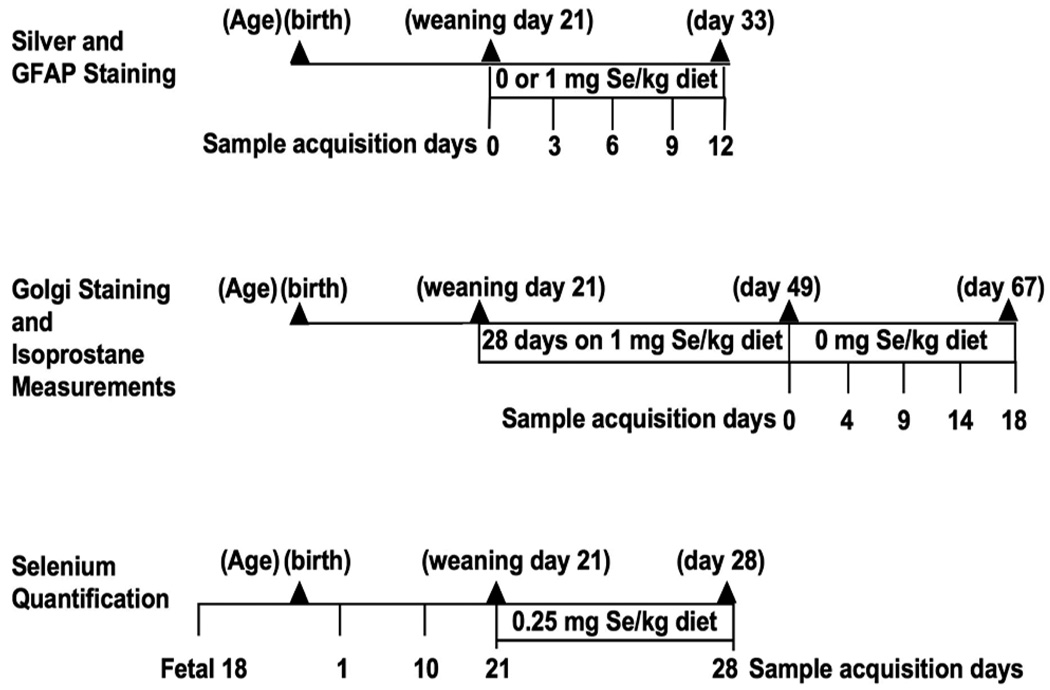
The Sepp1−/− mice were congenic with C57BL/6 mice (Hill et al. 2007). Heterozygotes were used for breeding, and their offspring were genotyped before weaning (Hill et al. 2004). A summary of the diet regimens and ages at sample acquisition for the analyses performed are presented in Scheme 1.
Scheme 1.
Diet and Sample Acquisition Timelines
For the silver degeneration staining experiments, Sepp1−/− and Sepp1+/+ male weanling mice were identified and fed ad libitum a previously reported (Hill et al. 2004) selenium-deficient Torula yeast-based diet or a high selenium diet consisting of the same Torula yeast-based diet supplemented with 1 mg selenium/kg as sodium selenite. Whole body perfusion and fixation was performed on Sepp1−/− weanling male mice fed selenium-deficient diet the day they were weaned (day 0) and on days 3, 6, 9, and 12 after weaning. Sepp1−/− male weanlings fed selenium-supplemented diet were perfused and fixed on days 6 and 12 after weaning. Sepp1+/+ mice fed selenium-deficient and selenium-supplemented diet were perfused and fixed on day 12 after weaning.
To allow morphological evaluations of hippocampal neurons more mature mice were used. To accomplish this Sepp1−/− and Sepp1+/+ mice were fed a diet containing 1 mg selenium/kg for 28 days post weaning and then the diet was changed to a selenium-deficient diet and brains were harvested after 0, 4, 9, 14, and 18 days on the selenium-deficient diet.
For the determination of brain selenium levels, tissues of Sepp1+/+ and Sepp1−/− mice were collected on fetal day 18, postnatal days 1, 10, 21 (weaning), and 28 on a diet containing a normal level of selenium (0.25 mg selenium /kg).
The mice were housed in a room with a 14 hour/10 hour light/dark cycle, and tap water containing Se < 0.6 µg/L was available ad libitum. All protocols were approved by the Vanderbilt Institutional Animal Care and Use Committee.
4.2 Perfusion fixation, histologic processing, and staining
Mice were deeply anesthetized with intraperitoneal pentobarbital before whole body perfusion. The perfusion was established through the left ventricle with efflux from the right atrium, and the mouse was perfused with wash solution (0.137 mol/L NaCl, 22 mmol/L of dextrose, 23 mmol/L sucrose, 2 mmol/L CaCl2, and 2 mmol/L sodium cacodylate) for 2 minutes at a flow rate of approximately 10 mL/minute. The wash solution was followed by fixation solution (0.12 mmol/L sucrose, 67 mmol/L sodium cacodylate, and 4% paraformaldehyde, pH 7.2–7.4) for 5 minutes at a flow rate of approximately 10 mL/min. The head was soaked overnight in fixation solution before the brain was removed and stored in fixation solution.
Twenty five fixed mouse brains (Sepp1−/− mice fed selenium-deficient diet and sacrificed 1, 3, 6, 9, and 12 days after weaning (n = 3), Sepp1−/− mice fed the high selenium diet for 6 or 12 days after weaning (n = 3), and Sepp1+/+ mice fed either the high selenium (n = 2) or selenium-deficient diet (n = 2) for 12 days) were treated with 20% glycerol and 2% dimethylsulfoxide to prevent freeze-artifacts and were embedded per block in a 5 × 5 array in a gelatin matrix using MultiBrain Technology (Neuroscience Associates, Knoxville, TN). The block of embedded brains was allowed to cure and was then rapidly frozen by immersion in isopentane chilled to −70°C with crushed dry ice. Blocks were mounted on a freezing stage of an AO 860 sliding microtome and sectioned coronally at 35 µm through the entire brain back to the caudal trigeminal complex of the brainstem (~12 mm). All sections cut were collected sequentially into a 4 × 6 array of containers filled with either 4% formaldehyde buffered with 4.2% sodium cacodylate (pH 7.2) for sections to be stained with the amino cupric silver method or Antigen Preserve solution (50% PBS, pH 7.0, 50% ethylene glycol, 1% polyvinyl pyrrolidine) for the sections to be stained by immunohistochemistry. At the completion of sectioning, each container held a serial set of 1-of-every-24th section (or 1 section every 840 µm). Each of the large sections cut from the block was a composite section holding individual sections from each brain embedded in the block, allowing for uniformity of staining across treatment groups. A serial set of every 6th section (210 µm) was stained with either amino cupric silver stain or glial fibrillary acidic protein (GFAP) immunohistochemistry by Neuroscience Associates.
The amino cupric silver staining closely followed the protocol by de Olmos et al. (de Olmos et al. 1994). Briefly, the 35 mm free-floating sections were removed from the cacodylate-buffered formaldehyde and rinsed with dH2O and then placed in dishes containing preimpregnation solution (2 mL of 0.5% cupric nitrate, 100 mg silver nitrate, 1.2 mL of 0.5% cadmium nitrate, 1.5 mL of 0.5% lanthanum nitrate, 0.5 mL of 0.5% neutral red, 53 mg α-amino butyric acid, 46 mg alanine, 1.0 mL pyridine, 1.0 mL triethanolamine, 2 mL isopropanol, and 100 mL deionized water (dH2O), microwaved until it reached 45–50°C and cooled to room temperature and filtered) and heated in the microwave until it reached 45–50°C and then allowed to cool overnight. The sections were then rinsed in dH2O followed by acetone, and placed in impregnation solution (412 mg silver nitrate, 4 mL of 100% ethanol, 0.05 mL acetone, 3 mL of 0.4% lithium hydroxide, 0.65 mL of 1 N ammonium hydroxide, and 5 mL of dH2O) for 50 minutes. After impregnation, the sections were transferred to a reducer solution (90 mL of 100% ethanol, 11 mL of 10% formalin, 6.5 mL of 1% citric acid and 800 mL dH2O) placed in a water bath maintained between 32–35°C for 25 minutes. The sections were then rinsed in dH2O and rapidly placed through a bleaching solution (10 mL of 6% potassium ferricyanide and 4% potassium chlorate, 0.2 mL of 0.06% lactic acid, 30 mL of 0.06% potassium permanganate, and 1 mL of 5% sulfuric acid) before being fixed in 2 % sodium thiosulfate and a rapid fixer solution for 1.5 minutes. The sections were then rinsed in dH2O, mounted on gelatinized glass slides and counterstained with Neutral Red to reveal normal cell bodies.
For GFAP immunohistochemistry, the sections were treated with hydrogen peroxide and blocking serum for 1 hour. The sections were then immunostained at room temperature with a primary anti-GFAP antibody (DAKO, Carpinteria, CA) with a 1:10,000 dilution for 24 hours, a secondary antibody for 1 hour, and an avidin-biotin-horseradish peroxidase complex (Vectastain ABC Elite kit; Vector Labs, Burlinghame, CA) for 2 hours. Finally, sections were treated with diaminobenzidine tetrahydochloride and mounted on gelatinized glass slides.
4.3 Morphologic assessments and staining quantification
Brain sections were initially evaluated on an Olympus BX41 microscope equipped with an Optronics Microfire digital camera to identify brain regions with positive staining. Bregma coordinates and affected brain regions were identified using a published reference (Paxinos et al. 2001). Relative levels of silver staining were then determined using bi-level thresholding and area of staining analysis using Fovea Pro tools with Adobe Photoshop software. Each region examined used comparable serial sections from all the animals.
4.4 Quantification of brain selenium levels
Selenium was determined in brain by the method of Koh and Benson as modified by Sheehan and Gao (Sheehan et al. 1990; Olson et al. 2009). Briefly, brain tissue from Sepp1+/+ and Sepp1−/− mice was digested with HNO3/HCIO4 (4/1 by volume) for 90 minutes at 190°C, reduced with HCI for 30 minutes at 150°C, and then complexed with 6.3 mmol/L 2,3-diaminonaphthalene for 30 min at 60°C. The resulting fluorophore was extracted into cyclohexane and the fluorescence was measured at excitation 366 nm/emission 544 nm.
4.5 Quantitative morphology of pyramidal neurons
Length of dendrites and spine density counts of pyramidal neurons were evaluated in Golgi impregnated 50 µm thick hippocampal sections from paraffin-embedded blocks prepared as per manufacturer’s instructions (FD Rapid GolgiStain Kit). Six or more pyramidal neurons with no breaks in staining along the dendrites from the CA1 section of the hippocampus were selected and spines counted as previously described (Milatovic et al. 2010). Tracking and counting were performed with a Neurolucida system at 100x under oil immersion (MicroBrightField, VT).
4.6 Quantification of F2-Isoprostanes
Total F2-Isoprostanes were determined from flash frozen brains by a stable isotope dilution method with detection by gas chromatography/mass spectrometry and selective ion monitoring as previously described (Morrow et al. 1999; Milatovic et al. 2007). Mouse cerebrum was homogenized in Folch solution and lipids were extracted from chloroform layer by evaporation (Milatovic et al. 2009) before hydrolysis with KOH. The pH was adjusted to 3 and 0.1 ng of 15-F2α-Isoprostane-d4 internal standard was added to the sample. F2-Isoprostanes were then purified by C18 and silica SepPak extraction and thin layer chromatography. Following formation of trimethylsilyl ether derivatives, F2-isoprostanes were analyzed by gas chromatography, negative ion chemical ionization-mass spectrometry.
4.7 Statistics
Statistical differences in the staining area among treatment groups, morphometry, and F2-isoprostanes were determined by 1-tailed t-test using Prism 4 (Graphpad Software Inc, San Diego, CA). To determine whether there was increased staining of selected regions over the course of time, Pearson correlation analysis was performed using Prism 4. Data from Sepp1+/+ mice fed either a selenium-deficient or high Se diet were combined because our previous work has shown no lesions in any brain region examined in either treatment, and no statistical differences were identified between these two groups in the present study.
Acknowledgements
The authors are grateful to Lori M. Austin for care of the mice and carrying out the whole-body perfusions, and to Amy K. Motley for performing the selenium analyses.
Role of funding source:
The work was funded by NIH grant ES02497 (R.F.B), the Center in Molecular Toxicology NIH grant ES00267 and the training program in Environmental Toxicology grant ES007028.
These funding sources did not participate in study design, in the collection, analysis, and interpretation of data; in the writing of the report; and in the decision to submit the paper for publication.
Abbreviations
- apoER2
Apolipoprotein E receptor 2
- CIC
Central nucleus of the inferior colliculus
- GFAP
Glial fibrillary acidic protein
- LS
Lateral striatum
- MFB
Medial forebrain bundle
- SC
Somatosensory cortex
- Sepp1
Selenoprotein P
- XSCP
Decussation of the cerebellar peduncle
Footnotes
Publisher's Disclaimer: This is a PDF file of an unedited manuscript that has been accepted for publication. As a service to our customers we are providing this early version of the manuscript. The manuscript will undergo copyediting, typesetting, and review of the resulting proof before it is published in its final citable form. Please note that during the production process errors may be discovered which could affect the content, and all legal disclaimers that apply to the journal pertain.
References
- Alloway KD, Lou L, Nwabueze-Ogbo F, Chakrabarti S. Topography of cortical projections to the dorsolateral neostriatum in rats: multiple overlapping sensorimotor pathways. J Comp Neurol. 2006;499(1):33–48. doi: 10.1002/cne.21039. [DOI] [PubMed] [Google Scholar]
- Burk RF, Hill KE. Selenoprotein P: an extracellular protein with unique physical characteristics and a role in selenium homeostasis. Annu Rev Nutr. 2005;25:215–235. doi: 10.1146/annurev.nutr.24.012003.132120. [DOI] [PubMed] [Google Scholar]
- Burk RF, Hill KE. Selenoprotein P-expression, functions, and roles in mammals. Biochim Biophys Acta. 2009;1790(11):1441–1447. doi: 10.1016/j.bbagen.2009.03.026. [DOI] [PMC free article] [PubMed] [Google Scholar]
- Chen J, Berry MJ. Selenium and selenoproteins in the brain and brain diseases. J Neurochem. 2003;86(1):1–12. doi: 10.1046/j.1471-4159.2003.01854.x. [DOI] [PubMed] [Google Scholar]
- Cooper ML, Adami HO, Gronberg H, Wiklund F, Green FR, Rayman MP. Interaction between single nucleotide polymorphisms in selenoprotein P and mitochondrial superoxide dismutase determines prostate cancer risk. Cancer Res. 2008;68(24):10171–10177. doi: 10.1158/0008-5472.CAN-08-1827. [DOI] [PMC free article] [PubMed] [Google Scholar]
- de Olmos JS, Beltramino CA, de Olmos de Lorenzo S. Use of an amino-cupric-silver technique for the detection of early and semiacute neuronal degeneration caused by neurotoxicants, hypoxia, and physical trauma. Neurotoxicol Teratol. 1994;16(6):545–561. doi: 10.1016/0892-0362(94)90033-7. [DOI] [PubMed] [Google Scholar]
- Fischer LR, Glass JD. Oxidative stress induced by loss of Cu,Zn-superoxide dismutase (SOD1) or superoxide-generating herbicides causes axonal degeneration in mouse DRG cultures. Acta Neuropathol. 2010;119(2):249–259. doi: 10.1007/s00401-009-0631-z. [DOI] [PMC free article] [PubMed] [Google Scholar]
- Forceville X, Vitoux D, Gauzit R, Combes A, Lahilaire P, Chappuis P. Selenium, systemic immune response syndrome, sepsis, and outcome in critically ill patients. Crit Care Med. 1998;26(9):1536–1544. doi: 10.1097/00003246-199809000-00021. [DOI] [PubMed] [Google Scholar]
- Gresner P, Gromadzinska J, Jablonska E, Kaczmarski J, Wasowicz W. Expression of selenoprotein-coding genes SEPP1, SEP15 and hGPX1 in non-small cell lung cancer. Lung Cancer. 2009;65(1):34–40. doi: 10.1016/j.lungcan.2008.10.023. [DOI] [PubMed] [Google Scholar]
- Guanqing H. On the etiology of Keshan disease: two hypotheses. Chin Med J (Engl) 1979;92(6):416–422. [PubMed] [Google Scholar]
- Hernandez G, Hamdani S, Rajabi H, Conover K, Stewart J, Arvanitogiannis A, Shizgal P. Prolonged rewarding stimulation of the rat medial forebrain bundle: neurochemical and behavioral consequences. Behav Neurosci. 2006;120(4):888–904. doi: 10.1037/0735-7044.120.4.888. [DOI] [PubMed] [Google Scholar]
- Hill KE, Zhou J, Austin LM, Motley AK, Ham AJ, Olson GE, Atkins JF, Gesteland RF, Burk RF. The selenium-rich C-terminal domain of mouse selenoprotein P is necessary for the supply of selenium to brain and testis but not for the maintenance of whole body selenium. J Biol Chem. 2007;282(15):10972–10980. doi: 10.1074/jbc.M700436200. [DOI] [PubMed] [Google Scholar]
- Hill KE, Zhou J, McMahan WJ, Motley AK, Burk RF. Neurological dysfunction occurs in mice with targeted deletion of the selenoprotein P gene. J Nutr. 2004;134(1):157–161. doi: 10.1093/jn/134.1.157. [DOI] [PubMed] [Google Scholar]
- Hill KE, Zhou J, McMahan WJ, Motley AK, Atkins JF, Gesteland RF, Burk RF. Deletion of selenoprotein P alters distribution of selenium in the mouse. J Biol Chem. 2003;278(16):13640–13646. doi: 10.1074/jbc.M300755200. [DOI] [PubMed] [Google Scholar]
- Kuhbacher M, Bartel J, Hoppe B, Alber D, Bukalis G, Brauer AU, Behne D, Kyriakopoulos A. The brain selenoproteome: priorities in the hierarchy and different levels of selenium homeostasis in the brain of selenium-deficient rats. J Neurochem. 2009;110(1):133–142. doi: 10.1111/j.1471-4159.2009.06109.x. [DOI] [PubMed] [Google Scholar]
- Milatovic D, Montine TJ, Zaja-Milatovic S, Madison JL, Bowman AB, Aschner M. Morphometric analysis in neurodegenerative disorders. Curr Protoc Toxicol. 2010;Chapter 12(Unit 12):16. doi: 10.1002/0471140856.tx1216s43. [DOI] [PMC free article] [PubMed] [Google Scholar]
- Milatovic D, Aschner M. Measurement of isoprostanes as markers of oxidative stress in neuronal tissue. Curr Protoc Toxicol. 2009;Chapter 12(Unit12):14. doi: 10.1002/0471140856.tx1214s39. [DOI] [PMC free article] [PubMed] [Google Scholar]
- Milatovic D, Yin Z, Gupta RC, Sidoryk M, Albrecht J, Aschner JL, Aschner M. Manganese induces oxidative impairment in cultured rat astrocytes. Toxicol Sci. 2007;98(1):198–205. doi: 10.1093/toxsci/kfm095. [DOI] [PubMed] [Google Scholar]
- Morrow JD, Roberts LJ., 2nd Mass spectrometric quantification of F2-isoprostanes in biological fluids and tissues as measure of oxidant stress. Methods Enzymol. 1999;300:3–12. doi: 10.1016/s0076-6879(99)00106-8. [DOI] [PubMed] [Google Scholar]
- Nakayama A, Hill KE, Austin LM, Motley AK, Burk RF. All regions of mouse brain are dependent on selenoprotein P for maintenance of selenium. J Nutr. 2007;137(3):690–693. doi: 10.1093/jn/137.3.690. [DOI] [PubMed] [Google Scholar]
- Olson GE, Whitin JC, Hill KE, Winfrey VP, Motley AK, Austin LM, Deal J, Cohen HJ, Burk RF. Extracellular glutathione peroxidase (Gpx3) binds specifically to basement membranes of mouse renal cortex tubule cells. Am J Physiol Renal Physiol. 2009 doi: 10.1152/ajprenal.00662.2009. [DOI] [PMC free article] [PubMed] [Google Scholar]
- Paxinos G, Franklin K. The Mouse Brain in Stereotaxic Coordinates. 2nd ed. San Diego, CA: Academic Press; 2001. [Google Scholar]
- Peters MM, Hill KE, Burk RF, Weeber EJ. Altered hippocampus synaptic function in selenoprotein P deficient mice. Mol Neurodegener. 2006;1:12. doi: 10.1186/1750-1326-1-12. [DOI] [PMC free article] [PubMed] [Google Scholar]
- Peters U, Chatterjee N, Hayes RB, Schoen RE, Wang Y, Chanock SJ, Foster CB. Variation in the selenoenzyme genes and risk of advanced distal colorectal adenoma. Cancer Epidemiol Biomarkers Prev. 2008;17(5):1144–1154. doi: 10.1158/1055-9965.EPI-07-2947. [DOI] [PubMed] [Google Scholar]
- Rogers RD, Baunez C, Everitt BJ, Robbins TW. Lesions of the medial and lateral striatum in the rat produce differential deficits in attentional performance. Behav Neurosci. 2001;115(4):799–811. doi: 10.1037//0735-7044.115.4.799. [DOI] [PubMed] [Google Scholar]
- Schomburg L, Schweizer U, Holtmann B, Flohe L, Sendtner M, Kohrle J. Gene disruption discloses role of selenoprotein P in selenium delivery to target tissues. Biochem J. 2003;370(Pt2):397–402. doi: 10.1042/BJ20021853. [DOI] [PMC free article] [PubMed] [Google Scholar]
- Sheehan TM, Gao M. Simplified fluorometric assay of total selenium in plasma and urine. Clin Chem. 1990;36(12):2124–2126. [PubMed] [Google Scholar]
- Valentine WM, Abel TW, Hill KE, Austin LM, Burk RF. Neurodegeneration in mice resulting from loss of functional selenoprotein P or its receptor apolipoprotein E receptor 2. J Neuropathol Exp Neurol. 2008;67(1):68–77. doi: 10.1097/NEN.0b013e318160f347. [DOI] [PubMed] [Google Scholar]
- Valentine WM, Hill KE, Austin LM, Valentine HL, Goldowitz D, Burk RF. Brainstem axonal degeneration in mice with deletion of selenoprotein P. Toxicol Pathol. 2005;33(5):570–576. doi: 10.1080/01926230500243045. [DOI] [PubMed] [Google Scholar]
- Vidoni ED, Acerra NE, Dao E, Meehan SK, Boyd LA. Role of the primary somatosensory cortex in motor learning: An rTMS study. Neurobiol Learn Mem. 2010;93(4):532–539. doi: 10.1016/j.nlm.2010.01.011. [DOI] [PubMed] [Google Scholar]
- Whanger PD. Selenium and the brain: a review. Nutr Neurosci. 2001;4(2):81–97. doi: 10.1080/1028415x.2001.11747353. [DOI] [PubMed] [Google Scholar]
- Wirth EK, Conrad M, Winterer J, Wozny C, Carlson BA, Roth S, Schmitz D, Bornkamm GW, Coppola V, Tessarollo L, Schomburg L, Kohrle J, Hatfield DL, Schweizer U. Neuronal selenoprotein expression is required for interneuron development and prevents seizures and neurodegeneration. Faseb J. 2010;24(3):844–852. doi: 10.1096/fj.09-143974. [DOI] [PMC free article] [PubMed] [Google Scholar]
- Zhang S, Rocourt C, Cheng WH. Selenoproteins and the aging brain. Mech Ageing Dev. 2010;131(4):253–260. doi: 10.1016/j.mad.2010.02.006. [DOI] [PubMed] [Google Scholar]
- Zhang Y, Zhou Y, Schweizer U, Savaskan NE, Hua D, Kipnis J, Hatfield DL, Gladyshev VN. Comparative analysis of selenocysteine machinery and selenoproteome gene expression in mouse brain identifies neurons as key functional sites of selenium in mammals. J Biol Chem. 2008;283(4):2427–2438. doi: 10.1074/jbc.M707951200. [DOI] [PubMed] [Google Scholar]


