

Abstract
OBJECTIVE
To investigate whether associations of common genetic variants recently identified for fasting glucose or insulin levels in nondiabetic adults are detectable in healthy children and adolescents.
RESEARCH DESIGN AND METHODS
A total of 16 single nucleotide polymorphisms (SNPs) associated with fasting glucose were genotyped in six studies of children and adolescents of European origin, including over 6,000 boys and girls aged 9–16 years. We performed meta-analyses to test associations of individual SNPs and a weighted risk score of the 16 loci with fasting glucose.
RESULTS
Nine loci were associated with glucose levels in healthy children and adolescents, with four of these associations reported in previous studies and five reported here for the first time (GLIS3, PROX1, SLC2A2, ADCY5, and CRY2). Effect sizes were similar to those in adults, suggesting age-independent effects of these fasting glucose loci. Children and adolescents carrying glucose-raising alleles of G6PC2, MTNR1B, GCK, and GLIS3 also showed reduced β-cell function, as indicated by homeostasis model assessment of β-cell function. Analysis using a weighted risk score showed an increase [β (95% CI)] in fasting glucose level of 0.026 mmol/L (0.021–0.031) for each unit increase in the score.
CONCLUSIONS
Novel fasting glucose loci identified in genome-wide association studies of adults are associated with altered fasting glucose levels in healthy children and adolescents with effect sizes comparable to adults. In nondiabetic adults, fasting glucose changes little over time, and our results suggest that age-independent effects of fasting glucose loci contribute to long-term interindividual differences in glucose levels from childhood onwards.
Fasting glucose levels in humans are tightly regulated within a narrow homeostatic range; elevated glucose levels are a sign of reduced insulin secretion or action and are used to test for and diagnose type 2 diabetes. Elevated fasting glucose levels within the normal nondiabetic range predict future risk of diabetes (1,2) and are associated with incident cardiovascular disease in nondiabetic individuals (3).
Previous studies suggested that fasting glucose levels are heritable (4–7), with estimates from twin studies ranging from 38 to 51%. Since 2006, a total of 16 genetic loci have been identified to be associated with fasting glucose levels in healthy adults (8–12). Longitudinal cohort studies with multiple repeated measures of fasting glucose have shown that trajectories of fasting glucose show only modest increases over time in nondiabetic individuals (13), suggesting that variation in fasting glucose is largely unaffected by age-related changes in risk factors in healthy populations and that genetic factors may be key determinants of long-term interindividual differences in fasting glucose levels. This raises the question whether the genetic contribution to population differences in fasting glucose is established early in life and evident in childhood.
We have previously shown associations between genetic variants in MTNR1B, G6PC2, and SLC30A8 and fasting glucose in children and adolescents from the European Youth Heart Study (EYHS) (14), with additional evidence from Weedon et al. (15) reporting that common variation in GCK is associated with fasting glucose in children from the Avon Longitudinal Study of Parents and Children (ALSPAC) cohort. In adults, the earliest identified genetic variants appeared to influence fasting glucose levels via effects on the glucose-sensing ability of pancreatic β-cells (9,10,12,15–18); since then, a meta-analysis of genome-wide association studies (GWASs) performed by the Meta-Analyses of Glucose and Insulin-related traits Consortium (MAGIC) identified nine additional novel fasting glucose-associated loci exhibiting a broad range of potential functionality (8). Whether these novel loci with on average smaller effect sizes are associated with fasting glucose in children is not known; however, individual studies are unlikely to be powered to investigate this.
We designed this study to meta-analyze results from over 6,000 children and adolescents participating in six studies of European origin to systematically test the separate and joint associations of the established common genetic variants associated with glucose-related traits in adults. To test differences by age, we compare individual and joint single nucleotide polymorphism (SNP) effect sizes obtained in our meta-analysis to those reported in adults.
RESEARCH DESIGN AND METHODS
Participants.
Characteristics of children and adolescents participating in the six studies included in this meta-analysis are provided in Table 1. We included over 6,000 children and adolescents from European (ALSPAC, Gene-Diet Attica Investigation on Childhood Obesity [GENDAI], French case subjects [obese], French control subjects, and EYHS) and Australian (Raine) studies. Children and adolescents of European descent without diagnosed diabetes and with fasting glucose levels <7 mmol/L were eligible for this study. Detailed study descriptions, including sampling methods, additional study-specific exclusions, and the number of children and/or adolescents contributed by each study are included in Supplementary Data (Supplementary Table 1).
TABLE 1.
Study-specific means and SDs of selected characteristics in participants included in the meta-analysis
| ALSPAC | EYHS | French obese case subjects | French control subjects | GENDAI | Raine | |||||||
|---|---|---|---|---|---|---|---|---|---|---|---|---|
| Males |
Females |
Males |
Females |
Males |
Females |
Males |
Females |
Males |
Females |
Males |
Females |
|
| n | 894 | 860 | 927 | 1,077 | 263 | 320 | 310 | 324 | 491 | 556 | 549 | 502 |
| Age (years) | 15.4 (0.3) | 15.4 (0.3) | 11.9 (2.9) | 12.0 (2.9) | 11.2 (2.9) | 10.8 (3.4) | 11.9 (2.4) | 11.9 (2.2) | 11.2 (0.7) | 11.2 (0.7) | 14.1 (0.2) | 14.1 (0.2) |
| Fasting glucose (mmol/L) | 5.3 (0.4) | 5.1 (0.4) | 5.1 (0.4) | 5.0 (0.4) | 4.9 (0.5) | 4.9 (0.5) | 4.9 (0.4) | 4.9 (0.4) | 4.8 (0.5) | 4.7 (0.5) | 4.9 (0.4) | 4.7 (0.4) |
| Fasting insulin (pmol/L)* | 56.4 (32.8) | 64.5 (30.3) | 51.1 (31.3) | 59.7 (34.5) | 72.6 (72.5) | 75.9 (79.0) | NA | NA | 36.6 (22.3) | 44.4 (26.7) | 57.0 | 63.0 |
| HOMA-IR* | 2.3 (1.4) | 2.5 (1.3) | 2.0 (1.3) | 2.2 (1.4) | 2.7 (2.7) | 2.7 (3.1) | NA | NA | 0.7 (0.4) | 0.8 (0.5) | 2.1 | 2.2 |
| HOMA-B* | 105.05 (64.1) | 131.9 (79.9) | 104.3 (64.1) | 136.9 (92.8) | 174.0 (322.7) | 192.0 (210.8) | NA | NA | 79.8 (32.6) | 94.6 (37.5) | 143.5 | 188.1 |
| Triglycerides (mmol/L) | 0.8 (0.4) | 0.9 (0.3) | 0.78 (0.3) | 0.9 (0.4) | 1.1 (0.6) | 1.1 (0.6) | 0.7 (0.4) | 0.8 (0.4) | 0.7 (0.3) | 0.7 (0.2) | 1.0 (0.7) | 1.0 (0.5) |
| HDL (mmol/L) | 1.2 (0.3) | 1.4 (0.3) | 1.5 (0.4) | 1.5 (0.03) | 1.2 (0.3) | 1.2 (0.3) | 1.4 (0.4) | 1.4 (0.3) | 1.4 (0.3) | 1.3 (0.3) | 1.4 (0.3) | 1.4 (0.3) |
| LDL (mmol/L) | 2.0 (0.5) | 2.2 (0.6) | 2.5 (0.6) | 2.6 (0.7) | 2.7 (0.7) | 2.8 (0.7) | 2.9 (0.8) | 3.1 (0.7) | 3.2 (0.6) | 3.1 (0.6) | 2.3 (0.6) | 2.4 (0.7) |
| Systolic bloodpressure (mmHg) | 125.8 (10.4) | 121.1 (10.7) | 107.8 (11.8) | 103.8 (9.5) | 115.5 (15.5) | 112.2 (13.9) | 111.2 (10.5) | 108.8 (8.8) | 120.2 (13.5) | 120.2 (14.1) | 116.0 (11.1) | 111.0 (10.0) |
| Diastolic blood pressure (mmHg) | 68.1 (9.2) | 66.8 (8.2) | 61.3 (7.1) | 61.7 (6.7) | 69.2 (11.7) | 67.9 (11.6) | 55.2 (10.0) | 55.0 (10.3) | 75.1 (11.2) | 74.9 (10.9) | 59.2 (7.2) | 59.4 (7.8) |
| Height (cm) | 174.0 (7.5) | 165.0 (6.0) | 152.3 (18.5) | 149.4 (14.6) | 155.1 (16.8) | 149.1 (16.5) | 150.1 (15.0) | 149.3 (12.5) | 148.7 (7.9) | 148.7 (7.8) | 166.7 (8.8) | 162.6 (6.1) |
| Weight (kg) | 63.7 (11.8) | 59.3 (11.0) | 44.3 (16.2) | 42.4 (13.6) | 74.4 (28.1) | 68.1 (26.3) | 40.4 (12.3) | 40.2 (10.6) | 44.6 (9.7) | 44.3 (9.8) | 59.4 (14.5) | 57.9 (12.1) |
| BMI (kg/m2) | 20.9 (3.3) | 21.7 (3.7) | 18.4 (2.8) | 18.5 (3.1) | 29.9 (6.4) | 29.4 (6.6) | 17.5 (2.2) | 17.7 (2.5) | 20.3 (3.4) | 19.8 (3.4) | 21.2 (4.2) | 21.9 (4.2) |
*Medians (interquartile range) are provided.
NA, not available.
Measurements.
Glucose concentration was measured using commercially available enzymatic assays after an overnight fast; full details of the method used by each study are provided in Supplementary Table 1. Fasting insulin concentration was measured using immunoassays (Supplementary Table 1). The homeostasis model assessment (HOMA) was used to estimate insulin resistance {HOMA-IR = [fasting glucose (mmol/L) × insulin (μU/mL)/22.5]} and β-cell function {HOMA-B = [insulin (μU/mL) × 20]/[glucose (mmol/L) − 3.5]} (19), both of which have been validated as surrogate markers in healthy children (20). BMI was calculated as weight/height2; exact details of height and weight measurements differed by cohort and are described in the Supplementary Data.
Genotyping, imputation, and quality control.
Individual studies either performed de novo genotyping of selected SNPs or provided “in silico” results based on GWAS data, as detailed in Supplementary Table 1. EYHS and GENDAI provided de novo genotyping results; French case and control subjects, Raine, and ALSPAC studies provided in silico data. Studies used slightly different criteria to exclude low-quality samples and SNPs before imputation; call rates for SNPs or proxies included in this study were all >95%. Hardy-Weinberg equilibrium test P values were > 0.05 for de novo and > 0.005 for in silico genotypes. Imputation of additional autosomal SNPs in the GWASs was performed using either MACH or IMPUTE computer programs from the HapMap CEU [Centre d'Etude du Polymorphisme Humain (Utah residents with ancestry from northern and western Europe)] reference panel (21,22). Full details on quality control and other filters applied to SNPs, and samples are provided in Supplementary Table 1, including information on genotyped and imputed variants and proxies.
Statistical analysis
Study-specific analyses.
In each study, effect alleles were defined as the glucose or insulin-raising allele for each SNP according to results from the recent GWAS of adults (8). Study-specific analyses were performed using linear regression, assuming additive genetic effects and adjusting for age, sex, and BMI according to a prespecified standard analysis plan. Untransformed fasting glucose and natural log-transformed fasting insulin, HOMA-B, and HOMA-IR were used as outcomes as the latter three variables were not normally distributed. Additional study-specific covariates were included in regression models for EYHS (country, laboratory) and Raine (adjustment for ethnic stratification by principle components analysis).
Meta-analysis.
We combined results across studies by random effects meta-analysis methods using the metan command in Stata 10.1 and DerSimonian-Laird approach (23). We investigated determinants of heterogeneity across studies by meta-regression using the metareg command and by calculation of I2, which is defined as the percentage of the total variation across studies due to heterogeneity between studies. Effect alleles of proxy SNPs were coded according to the effect allele frequency of the lead SNP. Highest probability (“best guess”) genotypes were used for analysis of imputed SNPs.
Comparison of effect sizes between adults and children/adolescents.
We compared individual SNP effect sizes for fasting glucose from our meta-analysis of children and adolescents to those obtained in replication studies included in the recent MAGIC GWAS of nondiabetic adults (8) using a Cochran Q test of heterogeneity and by calculating a CI around the difference of effect size between adults and children.
Score analysis.
We used data from the EYHS cohort to compute a weighted risk score to assess the combined associations of all 16 fasting glucose risk alleles on glucose levels. The risk score is calculated using the following equation:
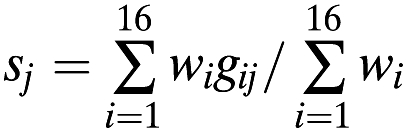 |
where sj is the score for individual j, gij is the number of risk alleles (0, 1, 2, or dosage of the risk allele) for SNP i carried by individual j, and wi is the effect size in children for SNP i. The denominator is the sum (over all SNPs) of effect sizes.
A total of 1,782 individuals with complete genotype information contributed data to the score analysis; the mean BMI for the 9- to 11-year-old and 14- to 16-year-old age-groups in these EYHS participants was 17.4 and 20.7 kg/m2, respectively. Linear regression assuming an additive effect of the score was used to test the association with fasting glucose levels (mmol/L) adjusting for age, BMI, sex, country, and the laboratory in which samples were analyzed. To graphically plot fasting glucose levels by values of the genetic score, we categorized individuals on the basis of their genetic score into 10 groups with values of ≤11, >11–12.5, >12.5–14, >14–15.5, >15.5–17, >17–18.5, >18.5–20, >20–21.5, >21.5–23, and >23.
Comparison of the effect of the genetic score on fasting glucose between adults and children used data from the EYHS for children and data from the Framingham Heart Study for adults, which was the largest of four cohorts used by the MAGIC investigators to analyze the genetic score (8).
For children and adolescents, the weights for the weighted risk score were calculated using the combined effect size from the meta-analysis of all six children and adolescent studies. For adults, the weights were calculated using effect sizes from the replication cohorts in the adult meta-analysis. Sensitivity analyses were performed for the weighted score in children using adult weights to avoid inflation of type 1 error, which may occur if weights from the derivation study are used to test the effect of the genetic score in the same study.
RESULTS
Meta-analysis of results for the 16 SNPs in or near fasting glucose loci in over 6,000 children and adolescents (Fig. 1) showed associations with fasting glucose levels not previously demonstrated in children or adolescents for ADCY5 (rs11708067), CRY2 (rs11605924), GLIS3 (rs7034200), PROX1 (rs340874), and SLC2A2 (rs11920090), in addition to confirming associations for variants in or near G6PC2 (rs560887), MTNR1B (rs10830963), SLC30A8 (rs13266624), and GCK (rs4607517). All effect sizes were directionally consistent with those observed in the MAGIC GWASs of adults, with the exception of TCF7L2, where there was a notable difference in effect size between adults and children/adolescents.
FIG. 1.

Effects of fasting glucose–associated variants in children, adolescents, and adults (in order of decreasing adult effect sizes).
Variants in DGKB (rs2191349), GCKR (rs780094), TCF7L2 (rs7903146), ADRA2A (rs10885122), MADD (rs7944584), FADS1 (rs174550), and C2CD4B (rs11071657) did not show significant associations with fasting glucose in this study.
In previous meta-analyses of adults, glucose-raising alleles of the fasting glucose variants in or near G6PC2, MTNR1B, GCK, DGKB, ADCY5, FADS1, GLIS3, C2CD4B, SLC30A8, and TCF7L2 were also strongly associated with lower β-cell function estimated by HOMA-B. We observed reduced levels (β-coefficient [95% CI]) of HOMA-B for children and adolescents carrying glucose-raising alleles in or near GLIS3 (−0.023 [−0.040 to −0.006], P = 0.007) with borderline significant associations for ADCY5 (−0.019 [0.0002 to −0.038], P = 0.05) and PROX1 (−0.016 [−0.033 to 0.001], P = 0.067). We confirm our previously reported associations for HOMA-B (14) of G6PC2 (−0.074 [−0.103 to −0.046], P = 4.04 × 10⁻⁷), MTNR1B (rs10830963; −0.038 [−0.065 to −0.011], P = 0.006), and GCK (−0.047 [−0.067 to −0.028], P = 2.21 × 10⁻⁶) in this much larger meta-analysis sample; associations for all other loci had P values > 0.13.
The MAGIC study in adults reported a novel association between a variant upstream of IGF1 and fasting insulin/HOMA-IR, as well as confirming an association between rs780094 in GCKR with both of these traits. We observed no associations between any of the variants investigated in this study and fasting insulin or HOMA-IR in children or adolescents (all P values > 0.12). In addition, the associations for the two insulin/HOMA-IR loci were shown to be of much smaller size for GCKR in comparison with the adult study and have inconsistent directions across studies for IGF1.
The weighted risk score including all variants investigated for association with fasting glucose in the current study followed a normal distribution, with a mean score (range) of 17.4 (7.2–27.5). Fasting glucose levels increased by 0.026 mmol/L (0.021–0.031) (P = 5.6 × 10⁻²²) for each unit increase in the score (Fig. 2). Comparison of children and adolescents at low (score ≤12) versus high (score ≥23) genetic susceptibility showed a difference of 0.25 mmol/L between these groups.
FIG. 2.

Mean fasting glucose (95% CI) by categories of the genetic fasting glucose risk score in 822 boys and 960 girls of EYHS.
Effect sizes for fasting glucose associations in children, adolescents, and adults appeared to be similar for all loci with the exception of DGKB, GCKR, and TCF7L2, which showed smaller point estimates in children. Effect sizes for ADRA2A and SLC2A2 also suggested heterogeneity between adults, adolescents, and children, but these differences were not statistically significant (Fig. 1 and Supplementary Table 3).
Comparison of results for the weighted genetic risk score in children and adolescents with the same risk score in adults on the basis of the Framingham Heart Study showed a difference (mean [95% CI]) of 0.34 mmol/L (0.25–0.43) in fasting glucose between adults with a score of ≤12 and those with a score ≥23 (8) compared with children and adolescents who showed a difference of 0.25 mmol/L (0.15–0.35) for the same groups; this mean difference was not significantly different between adults and children (P = 0.19). There was also no significant difference between the genetic scores if the weights used in the children and adolescent analysis were calculated using replication effect sizes from the MAGIC GWAS in adults.
The MAGIC study of adults used data from replication cohorts to investigate the proportion of variance in fasting glucose explained by the 14 fasting glucose–associated loci with replication data (all fasting glucose loci except for those on TCF7L2 and SLC30A8) and found an R2 value ranging from 3.2 to 4.4% in the six replication studies used in their analysis. In the current study, the 14 fasting glucose–associated loci investigated in the MAGIC study of adults had an R2 value of 4.3% (5.1% including TCF7L2 and SLC30A8) in the EYHS study sample, consistent with the estimates from adult study samples.
We observed little heterogeneity for fasting glucose associations between studies (Supplementary Table 2), with the exception of rs10830963 in MTNR1B and rs4607517 in GCK, which displayed an appreciable level of heterogeneity visible in forest plots and indicated by I2 values of 72.4 and 30.3%, respectively. Meta-regression analyses showed that differences in mean age between studies explained the majority of the heterogeneity in the analysis for MTNR1B. In studies where the mean age of children was <12 years, the association between MTNR1B and fasting glucose was 0.040 (0.018–0.062) (β [per allele] [95% CI]), whereas in children and adolescents >12 years of age, the association was 0.106 (0.067–0.146).
None of the factors considered in the meta-regression (age, fasting glucose levels, BMI, proportion of boys in the study sample) explained an appreciable amount of heterogeneity observed for GCK, with only 5.5% of the between-study variance explained.
DISCUSSION
Novel loci recently identified to be associated with fasting glucose in adults have an important contribution to differences in fasting glucose levels from an early age. Using data from over 6,000 children and adolescents, we show that variants identified by their association with fasting glucose in adults are associated with fasting glucose levels in children and adolescents with substantial additive effects. As in studies of adults, associations of variants with fasting glucose in children and adolescents appear to be mediated via reduced β-cell function rather than insulin sensitivity, with associations being independent of obesity levels.
Effect sizes in adults, adolescents, and children did not differ in magnitude for the majority of glucose variants, suggesting that genetically determined population differences in fasting glucose are not only present at an early age, but are maintained and constant over time.
The reason for effect estimates of ADRA2A, DGKB, GCKR, and TCF7L2 being somewhat smaller in children and adolescents is unclear. It is possible that associations of these variants with glucose increase with age. However, longitudinal analyses of repeated measures of fasting glucose in nondiabetic adults do not provide evidence to support this, as reported in a recent article that found no differences in the effect sizes of these variants over time (24).
Determinants of fasting glucose trajectories in nondiabetic individuals.
The results of our meta-analysis of fasting glucose levels in children and adolescents and our comparison with effect sizes in adults indirectly support previous studies investigating fasting glucose trajectories over time in nondiabetic individuals. Trajectories of fasting glucose in nondiabetic individuals show only modest increases over time (13), suggesting that age-related changes in risk factors have little influence on fasting glucose levels in these individuals, and similar effect sizes in children, adolescents, and adults for the majority of established fasting glucose loci also point toward the associations of fasting glucose loci being age independent, a property that has not been previously reported. This study supports a model in which genetic variants have an important contribution to fasting glucose levels from an early age with differences in the normal fasting glucose range between individuals being partly determined by the constellation of variants inherited, with each person having a specific fasting glucose “set point” that results from the combined effects of multiple fasting glucose loci behaving in an additive manner. Although age-related risk factors (e.g., BMI) contribute to variance in fasting glucose at a cross-sectional level, because of the time-independency displayed by fasting glucose loci and the lack of effect of age-related risk factor changes on fasting glucose levels, genetic population differences in fasting glucose are maintained long term over the course of a lifetime.
Investigation of heterogeneity.
Our meta-regression analyses suggested that the between-study heterogeneity observed for the MTNR1B SNP is largely explained by differences in the age distribution between these studies of children and adolescents. This result is consistent with our previous result that the influence of MTNR1B on glucose levels shows interaction with pubertal stage (14), possibly resulting from the transient period of insulin resistance that occurs during puberty (25) and indicating the effects of the MTNR1B variant may be greater in the context of greater insulin secretory demand. Importantly, the range of effect sizes observed at various stages of puberty is consistent with the effect size observed in adults.
It has not yet been investigated whether effects of MTNR1B are also more pronounced in risk allele–carrying adults exposed to chronically increased secretory demand and at higher risk for type 2 diabetes; for example, in the context of obesity and insulin resistance. However, the current data suggest that at least in children and adolescents, the effect of MTNR1B does not differ by BMI, with both meta-regression analysis and visual inspection of effect sizes suggesting no difference in effect size in studies of children and adolescents with different mean BMI.
Strengths and limitations.
This is the first study to demonstrate that the majority of novel fasting glucose loci identified in GWASs of adults are detectable in childhood and with effect sizes comparable to those reported in replication studies of adults. We used a diverse selection of study samples including “hypernormal” control children in addition to obese case subjects increasing the generalizability of results and underlining the fact that associations of the established fasting glucose loci are independent of obesity levels. Previous studies of children and adolescents investigating fasting glucose loci were based on relatively small sample sizes. Single studies are mostly underpowered to detect associations for all but the earliest reported GWAS variants displaying the largest effect sizes, also demonstrated by individual study results included in our meta-analysis. In the current study, we have overcome the problem of false-negative replication results by meta-analyzing a total of six studies including >6,000 children and adolescents, constituting the largest study of fasting glucose–associated loci in children and adolescents to date.
The original MAGIC GWASs showed associations with β-cell function, as measured by HOMA-B, for at least 10 of the 16 fasting glucose variants (8), and subsequent more detailed physiological characterization confirmed defects in insulin processing and/or insulin secretion for fasting glucose, raising alleles in or near TCF7L2, SCL30A8, C2CD4B, MTNR1B, GCK, FADS1, DGKB, and PROX1 (26). The fasting glucose-raising allele of MADD was associated with abnormal insulin processing, with no association with insulin secretion, whereas the fasting glucose-raising allele of rs560887 in G6PC2 was associated with greater insulin secretion (26). In the current study, we show inverse associations of fasting glucose-raising alleles of G6PC2, MTNR1B, GCK, and GLIS3 with HOMA-B (and potentially weaker associations for ADCY5 and PROX1), consistent with HOMA-B results in adults. Being restricted to investigation of a surrogate measure based on fasting glucose and insulin is a limitation of our study. More detailed characterization of β-cell function would be required to distinguish effects on insulin secretion from HOMA-B associations that simply exist by virtue of each variant’s fasting glucose link, as potentially the case for ADCY5 and GLIS3, which showed no associations with insulin processing, secretion, or sensitivity in adults (26). However, epidemiological measures of β-cell function or insulin secretion are invasive and require regular blood draws during an oral glucose tolerance test, not commonly performed in studies of children and adolescents.
An additional limitation is that the use of proxies or imputed SNPs for some of the variants may have lead to diluted effects, and, as such, the lack of association observed for some of the variants in this study may be due to potential measurement error or nondifferential misclassification of imputed SNPs.
Public health implications.
The finding that the majority of fasting glucose loci have comparable effect sizes in adolescents, children, and adults demonstrates that genetically susceptible individuals are exposed to higher levels of glucose and their detrimental effects on the vasculature from an early age and raises the question about the clinical relevance of long-term small elevations in fasting glucose levels in normoglycemic individuals. Stable fasting hyperglycemia is observed in individuals with GCK maturity-onset diabetes of the young (MODY), a monogenic form of diabetes caused by mutations in the GCK gene, and is maintained over the course of a lifetime (27), with many of these individuals showing no symptoms, suggesting that stable mild fasting hyperglycemia may not in itself be detrimental. However, differences in fasting glucose levels between extremes of the fasting glucose genetic susceptibility show a substantial effect size given the narrow physiological range of fasting glucose, which is similar to that seen in adults if one considers the different fasting glucose SDs in children, adolescents, and adults (0.35–0.53 mmol/L in the included studies of children and adolescents and 0.43–1.4 mmol/L in nondiabetic adults included in fasting glucose GWASs) (8). Fasting glucose levels within the normal range are associated with an increase in the risk of future type 2 diabetes (1,2), with a >50% increased risk estimated for the fasting glucose difference seen between extremes of the fasting glucose score in adults (8). For cardiovascular complications, a recent large meta-analysis suggested that elevations of fasting glucose <7 mmol/L in nondiabetic individuals carry a modestly elevated risk for coronary heart disease, with hazard ratios (95% CI) of 1.17 (1.08–1.26) and 1.11 (1.04–1.18) when comparing adults at levels of 6.1–7.0 and 5.6–6.1 mmol/L, respectively, to the reference group with low levels of 3.9–5.6 mmol/L (3). The degree to which early genetic differences in fasting glucose that remain stable throughout life translate into type 2 diabetes or its cardiovascular complications remains to be quantified. However, the availability of multiple SNPs associated with fasting glucose will allow assessment of the causal nature of associations between this trait with type 2 diabetes and cardiovascular disease using the Mendelian randomization approach.
In conclusion, novel fasting glucose loci identified in studies of adults are associated with fasting glucose levels in healthy children and adolescents with effect sizes comparable to adults for individual and combined SNP associations. In nondiabetic individuals, fasting glucose changes little over time, and our results suggest that age-independent associations of fasting glucose loci contribute to long-term interindividual differences in glucose levels from childhood onward. The mechanisms through which individuals that are genetically susceptible to higher fasting glucose throughout life are at increased risk for type 2 diabetes and the potentially associated risk of cardiovascular complications remain to be investigated.
ACKNOWLEDGMENTS
ALSPAC.
The U.K. Medical Research Council (MRC) (grant 74882), The Wellcome Trust (grant 076467), and the University of Bristol provided core support for ALSPAC. Funding for fasting glucose and insulin, and for D.A.L.’s contribution to this manuscript, was provided by the U.S. National Institutes of Health (NIH): National Institute of Diabetes and Digestive and Kidney Diseases (grant R01-DK-077659). This publication is the work of the authors, and A.B. et al. will serve as guarantors for the contents of this article.
The authors are extremely grateful to all families who took part in the ALSPAC study. The authors thank the midwives for help with recruiting the families and the whole ALSPAC team, which includes interviewers, computer and laboratory technicians, clerical workers, research scientists, volunteers, managers, receptionists, and nurses. The authors thank the Sample Logistics and Genotyping Facilities at the Wellcome Trust Sanger Institute (U.K.) and the Centre National de Genotypage (France) for generating the ALSPAC GWA data.
EYHS.
The EYHS was funded by grants from The Danish Heart Foundation; The Danish Medical Research Council Health Foundation; The Danish Council for Sports Research; The Foundation in Memory of Asta Florida Bolding Renée Andersen; The Faculty of Health Sciences, University of Southern Denmark; The Estonian Science Foundation (grants 3277 and 5209); and the MRC, U.K.
The authors are very grateful to all children participating in the EYHS and their families. The authors are also grateful for the contribution of all members of the EYHS Group and the MRC Epidemiology laboratory team.
French children.
French genetic studies were supported in part by the “Conseil Regional Nord-Pas-de-Calais: Fonds européen de développement économique et regional,” Genome Quebec-Genome Canada, and the British MRC. French control subjects belong to the STANISLAS Family Study, which is part of the Biological Resources Centre (BRC): “Interactions Gène-Environnement en Physiopathologie CardioVasculaire” (IGE-PCV). The STANISLAS Family Study was supported by the “Caisse Nationale d’Assurance Maladies des Travailleurs Salariés” (CNAM), the “Institut National de la Santé et de la Recherche Médicale” (INSERM), the “Région Lorraine,” the “Communauté Urbaine du Grand Nancy,” and the “Henri Poincaré” University of Nancy I.
The authors acknowledge B. Heude (INSERM UMR 1018, Villejuif, France) for providing DNA samples of the lean children from the Fleurbaix-Laventie study. The authors are deeply grateful for the cooperation of the families participating in the STANISLAS cohort, and the authors thank the staff of the “Centre de Médecine Préventive” of Vandoeuvre-lès-Nancy (France) for their involvement in the recruitment of the STANISLAS cohort.
GENDAI.
The work of I.P. was in part funded through the ENGAGE Consortium grant from the European Community’s Seventh Framework Programme (HEALTH-F4-2007-201413). Genotyping was supported in part by Diabetes U.K. grant RD08/0003704.
The GENDAI investigators would like to thank all the field investigators for samples and data collection and all children and their parents for their participation in the study.
Raine.
The authors gratefully acknowledge the National Health and Medical Research Council for its long-term contribution to funding the study over the last 20 years and also the following institutions for providing funding for core management of the Raine study: The University of Western Australia (UWA); Raine Medical Research Foundation; UWA Faculty of Medicine, Dentistry and Health Sciences; and The Telethon Institute for Child Health Research and Women and Infants Research Foundation. The authors gratefully acknowledge the assistance of the Western Australian DNA Bank (a National Health and Medical Research Council of Australia National Enabling Facility). The authors also acknowledge the support of the National Health and Medical Research Council of Australia (grants 572613 and 003209) and the Canadian Institutes of Health Research (grant MOP-82893). The authors thank the assistance of the Telethon Institute for Child Health Research and the Raine Medical Research Foundation of the UWA.
The authors are grateful to the Raine study participants and their families and to the Raine study research staff for cohort coordination and data collection.
No potential conflicts of interest relevant to this article were reported.
A.B. wrote the initial draft of the manuscript, researched data, contributed to discussion, and reviewed and edited the manuscript. S.J.S., N.J.T., N.B.-N., N.M.W., and S.K. wrote sections of the manuscript, researched data, contributed to discussion, and reviewed and edited the manuscript. L.J.B., S.B., P.D., D.M.E., A.G., N.H., D.A.L., C.L., R.J.F.L., S.J.L., M.I.M., T.A.M., N.C.N., J.P.N., I.N., C.E.P., B.S.P., I.P., S.M.R., N.S., S.V.-S., G.V.D., L.J.P., P.F., G.D.S., and U.E. contributed to discussion and reviewed and edited the manuscript. N.J.W. and C.L. designed the study, wrote and edited the manuscript, contributed to discussion, and reviewed and edited the manuscript.
Footnotes
This article contains Supplementary Data online at http://diabetes.diabetesjournals.org/lookup/suppl/doi:10.2337/db10-1575/-/DC1.
REFERENCES
- 1.Tirosh A, Shai I, Tekes-Manova D, et al. Normal fasting plasma glucose levels and type 2 diabetes in young men. N Engl J Med 2005;353:1454–1462 [DOI] [PubMed] [Google Scholar]
- 2.Nichols GA, Hillier TA, Brown JB. Normal fasting plasma glucose and risk of type 2 diabetes diagnosis. Am J Med 2008;121:519–524 [DOI] [PubMed] [Google Scholar]
- 3.Sarwar N, Gao P, Seshasai SR, et al. Diabetes mellitus, fasting blood glucose concentration, and risk of vascular disease: a collaborative meta-analysis of 102 prospective studies. Lancet 2010;375:2215–2222 [DOI] [PMC free article] [PubMed] [Google Scholar]
- 4.Katoh S, Lehtovirta M, Kaprio J, et al. Genetic and environmental effects on fasting and postchallenge plasma glucose and serum insulin values in Finnish twins. J Clin Endocrinol Metab 2005;90:2642–2647 [DOI] [PubMed] [Google Scholar]
- 5.Snieder H, Boomsma DI, van Doornen LJ, Neale MC. Bivariate genetic analysis of fasting insulin and glucose levels. Genet Epidemiol 1999;16:426–446 [DOI] [PubMed] [Google Scholar]
- 6.Schousboe K, Visscher PM, Henriksen JE, Hopper JL, Sørensen TI, Kyvik KO. Twin study of genetic and environmental influences on glucose tolerance and indices of insulin sensitivity and secretion. Diabetologia 2003;46:1276–1283 [DOI] [PubMed] [Google Scholar]
- 7.Leslie RD, Beyan H, Sawtell P, Boehm BO, Spector TD, Snieder H. Level of an advanced glycated end product is genetically determined: a study of normal twins. Diabetes 2003;52:2441–2444 [DOI] [PubMed] [Google Scholar]
- 8.Dupuis J, Langenberg C, Prokopenko I, et al. New genetic loci implicated in fasting glucose homeostasis and their impact on type 2 diabetes risk. Nat Genet 2010;42:105–116 [DOI] [PMC free article] [PubMed] [Google Scholar]
- 9.Prokopenko I, Langenberg C, Florez JC, et al. Variants in MTNR1B influence fasting glucose levels. Nat Genet 2009;41:77–81 [DOI] [PMC free article] [PubMed] [Google Scholar]
- 10.Bouatia-Naji N, Bonnefond A, Cavalcanti-Proença C, et al. A variant near MTNR1B is associated with increased fasting plasma glucose levels and type 2 diabetes risk. Nat Genet 2009;41:89–94 [DOI] [PubMed] [Google Scholar]
- 11.Chambers JC, Zhang W, Zabaneh D, et al. Common genetic variation near melatonin receptor MTNR1B contributes to raised plasma glucose and increased risk of type 2 diabetes among Indian Asians and European Caucasians. Diabetes 2009;58:2703–2708 [DOI] [PMC free article] [PubMed] [Google Scholar]
- 12.Bouatia-Naji N, Rocheleau G, Van Lommel L, et al. A polymorphism within the G6PC2 gene is associated with fasting plasma glucose levels. Science 2008;320:1085–1088 [DOI] [PubMed] [Google Scholar]
- 13.Andres R, Tobin JD. Aging and the disposition of glucose. Adv Exp Med Biol 1975;61:239–249 [DOI] [PubMed] [Google Scholar]
- 14.Kelliny C, Ekelund U, Andersen LB, et al. Common genetic determinants of glucose homeostasis in healthy children: the European Youth Heart Study. Diabetes 2009;58:2939–2945 [DOI] [PMC free article] [PubMed] [Google Scholar]
- 15.Weedon MN, Clark VJ, Qian Y, et al. A common haplotype of the glucokinase gene alters fasting glucose and birth weight: association in six studies and population-genetics analyses. Am J Hum Genet 2006;79:991–1001 [DOI] [PMC free article] [PubMed] [Google Scholar]
- 16.Sparsø T, Andersen G, Nielsen T, et al. The GCKR rs780094 polymorphism is associated with elevated fasting serum triacylglycerol, reduced fasting and OGTT-related insulinaemia, and reduced risk of type 2 diabetes. Diabetologia 2008;51:70–75 [DOI] [PubMed] [Google Scholar]
- 17.Orho-Melander M, Melander O, Guiducci C, et al. Common missense variant in the glucokinase regulatory protein gene is associated with increased plasma triglyceride and C-reactive protein but lower fasting glucose concentrations. Diabetes 2008;57:3112–3121 [DOI] [PMC free article] [PubMed] [Google Scholar]
- 18.Chen WM, Erdos MR, Jackson AU, et al. Variations in the G6PC2/ABCB11 genomic region are associated with fasting glucose levels. J Clin Invest 2008;118:2620–2628 [DOI] [PMC free article] [PubMed] [Google Scholar]
- 19.Matthews DR, Hosker JP, Rudenski AS, Naylor BA, Treacher DF, Turner RC. Homeostasis model assessment: insulin resistance and beta-cell function from fasting plasma glucose and insulin concentrations in man. Diabetologia 1985;28:412–419 [DOI] [PubMed] [Google Scholar]
- 20.Gungor N, Saad R, Janosky J, Arslanian S. Validation of surrogate estimates of insulin sensitivity and insulin secretion in children and adolescents. J Pediatr 2004;144:47–55 [DOI] [PubMed] [Google Scholar]
- 21.Li Y, Abecasis GR. Mach 1.0: Rapid haplotype reconstruction and missing genotype inference. Am J Hum Genet 2006;S79:2290 [Google Scholar]
- 22.Marchini J, Howie B, Myers S, McVean G, Donnelly P. A new multipoint method for genome-wide association studies by imputation of genotypes. Nat Genet 2007;39:906–913 [DOI] [PubMed] [Google Scholar]
- 23.Stata Corp Stata Statistical Software: Release 10. College Station, TX, StataCorp LP, 2007 [Google Scholar]
- 24.Jensen AC. Genetic impact on glucose levels in a longitudinal study. In European Diabetes Epidemiology Group. Port Heli, Greece, EDEG, 2010 [Google Scholar]
- 25.Lee JM. Insulin resistance in children and adolescents. Rev Endocr Metab Disord 2006;7:141–147 [DOI] [PubMed] [Google Scholar]
- 26.Ingelsson E, Langenberg C, Hivert MF, et al. Detailed physiologic characterization reveals diverse mechanisms for novel genetic loci regulating glucose and insulin metabolism in humans. Diabetes 2010;59:1266–1275 [DOI] [PMC free article] [PubMed] [Google Scholar]
- 27.World Health Organization Definition, Diagnosis and Classification of Diabetes Mellitus. Part 1: Diagnosis and Classification of Diabetes Mellitus. Geneva, World Health Org., 1999 [Google Scholar]