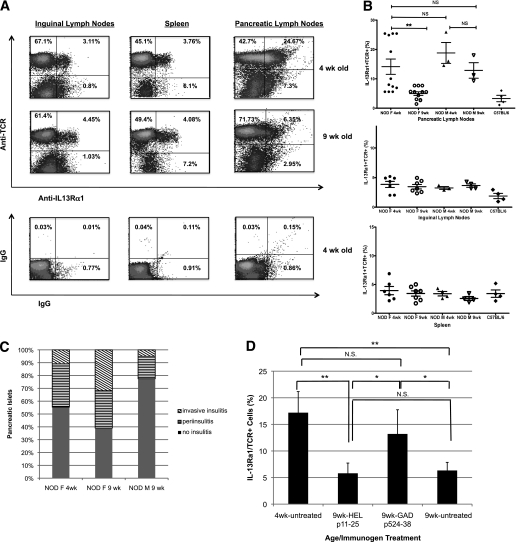
FIG. 7.
IL-13Rα1 expression on T cells in the PLNs is enhanced in young prediabetic NOD mice. ILNs, PLNs, and spleens from 4- or 9-week-old NOD mice were analyzed by fluorescence-activated cell sorter for TCRαβ and IL-13Rα1 expression. A: Representative density plots from 4-week-old (top plots) and 9-week-old (bottom plots) female NOD tissues. The plots shown are ungated populations, with the numbers indicating the percentages of cells in each quadrant. B: Quantitative analysis of IL-13Rα1+ T cells in individual 4-week-old or 9–11-week-old NOD mice, female (F) and male (M), or female C57BL/6 controls—each marker indicates an individual mouse. The means were calculated from seven experiments performed under identical conditions; statistical analysis was performed using Student t test (**P < 0.005). C: The pancreas was collected from three NOD mice, individuals in (B), fixed, processed, and stained as described in the research design and methods. At least 50 islets were evaluated for the severity of leukocyte infiltration: normal (filled bar), peri-insulitis (horizontal stripes), and invasive (diagonal stripes). D: PLNs from female NOD mice immunized at 3 weeks of age with p524-538/IFA or HEL 11–25/IFA, were collected at 9 weeks of age and analyzed by flow cytometry. Untreated 4- and 9-week-old mice were used as controls. The data represents two experiments, with three mice per group. Statistical analysis was performed using Student t test (*P < 0.05, **P < 0.005). N.S., not significant.

