

Abstract
Brain oscillatory activity has long been thought to have spatial properties, the details of which are unresolved. Here we examine spatial organizational rules for the human brain oscillatory activity as measured by blood oxygen level-dependent (BOLD) signal. Resting-state BOLD signal was transformed into frequency space (Welch's method) and averaged across subjects, and its spatial distribution was studied as a function of four frequency bands, spanning the full BOLD bandwidth. The brain showed anatomically constrained distribution of power for each frequency band. This result was replicated on a repository dataset of 195 subjects. Next, we examined larger-scale organization by parceling the neocortex into regions approximating Brodmann areas (BAs). This indicated that BAs of simple function/connectivity (unimodal), versus complex properties (transmodal), are dominated by low-frequency BOLD oscillations, and within the visual ventral stream we observe a graded shift of power to higher-frequency bands for BAs further removed from the primary visual cortex (increased complexity), linking BOLD frequency properties to hodology. Additionally, BOLD oscillation properties for the default mode network demonstrated that it is composed of distinct frequency-dependent regions. When the same analysis was performed on a visual–motor task, frequency-dependent global and voxelwise shifts in BOLD oscillations could be detected at brain sites mostly outside those identified with general linear modeling. Thus, analysis of BOLD oscillations in full bandwidth uncovers novel brain organizational rules, linking anatomical structures and functional networks to characteristic BOLD oscillations. The approach also identifies changes in brain intrinsic properties in relation to responses to external inputs.
Introduction
Inextricable interrelationship between form and function is a fundamental rule of biology. This rule is especially evident in neuroscience, from single channels, to individual neurons, to columns of neurons, and to large-scale brain circuits, all demonstrating intricate relationships between shape and function. Here we examine spatial organizational rules for the human brain regarding oscillatory activity as measured by blood oxygen level-dependent (BOLD) signal.
Various electrophysiological methods provide precise temporal information, at millisecond resolution, regarding neuronal activity. Depending on electrode configuration, from single-unit electrodes to brain surface electrodes (as used in electroencephalographic studies, EEG) one is able to sample neural activity at various scales, from subcellular to individual cells and up to complex networks across the whole brain. Yet these high-frequency sampling techniques suffer from either being spatially too restricted (as in single channel, single cell, or a few cells) or spatially ill defined [e.g., low-impedance electrode recordings of local field potentials (LFPs) or EEG data that sample from millions of neurons, but localizing these sources remains a hard problem]. As a consequence, although a large amount of information is known regarding the role of various frequency bands of electrical activity in cognition, behavior, attention, and linking neurons into assemblies and facilitating synaptic plasticity (Rodriguez et al., 1999; Engel et al., 2001; Buzsáki and Draguhn, 2004; Chalk et al., 2010; Palva et al., 2010), spatial distribution of brain oscillatory activity has remained ill defined. Alternatively such spatial distribution is assumed to be broad, because since the discovery of EEG (Berger, 1929), it has been noted that it exhibits distinct power for different frequencies at grossly different brain locations (Shackman et al., 2010) [for example, the alpha rhythm, at ∼10 Hz, shows peak amplitude at midline parieto-occipital electrodes (Shaw, 2003)].
As fMRI BOLD signal is based on local changes in blood flow, it has high spatial specificity, yet this comes at the cost of compression in the range of oscillatory frequencies that can be observed. Still, low-frequency BOLD oscillations have become a successful tool with which large-scale brain networks are identified and their properties studied (Biswal et al., 1995; Greicius et al., 2003; Fox et al., 2005; Raichle, 2006). Such fMRI studies are commonly done during “resting state,” where spontaneous fluctuations of brain activity are used to subdivide the brain into independent functional resting-state networks (RSNs) (Cole et al., 2010). We extend the concept and peer into brain organization of BOLD oscillatory activity as a function of power within various frequency bands, examining both resting-state and stimulus-evoked activity. Suggestions and partial observations of BOLD frequency-dependent power differences in different brain regions have been reported (Mitra et al., 1997; Cordes et al., 2002; Wise et al., 2004; Duff et al., 2008; Salvador et al., 2008; He et al., 2010; Zuo et al., 2010). Here we demonstrate that the approach leads to derivation of novel organizational rules for the human brain, linking anatomical and functional brain units to differences in power for distinct frequency band BOLD oscillations.
Materials and Methods
Subjects.
Twenty-three healthy subjects participated in the experiment (10 females, 13 males; average age = 35.2 years, SD = 11.1 years). All subjects were right handed and gave informed consent to procedures approved by the Northwestern University Institutional Review Board.
Procedures.
Seventeen subjects were scanned for whole-brain fMRI under two conditions, (1) visual–motor rating task (Baliki et al., 2006) and (2) rest. Before scanning, subjects were trained outside of the scanner to perform the visual-rating task. This consisted of rating the length of a moving bar presented on a computer screen. Subjects were instructed to indicate the length of the bar by spacing their thumb and index finger while a device taped onto their fingers recorded their movement. A potentiometer was attached to the device and produced voltage signals based on finger position. During the resting scan, subjects were instructed to remain alert with their eyes open. Both scans lasted 10 min. Additionally, six subjects participated in a 12 min resting fMRI scan where only three midline sagittal slices were collected at a higher sampling frequency. To test that structured frequency distribution is unique to the brain, one subject participated in a resting scan of the right thigh at low and high sampling rates lasting 10 and 12 min, respectively.
fMRI acquisition.
Whole-brain functional MR data were acquired with a 3T Siemens TIM Trio whole-body scanner with echo-planar imaging (EPI) capability. An eight-channel head coil optimized for prefrontal cortical activity was used. Multislice T2*-weighted echo-planar images were acquired using the following settings: repetition time TR = 2.5 s, echo time TE = 30 ms, flip angle = 90°, slice thickness = 3 mm, in-plane resolution = 3.475 × 3.475 mm2. Thirty-six slices covered the whole brain from the cerebellum to the cortex. There were 244 volumes acquired per task in all participants.
Fast BOLD weighted EPI scans were acquired with a TR = 185 ms, echo time TE = 30 ms, flip angle = 25°, slice thickness = 5 mm, FOV = 256 mm, in-plane resolution = 4 × 4 mm2. Three sagittal slices covered the midline brain from the cerebellum to the cortex. Four thousand volumes were acquired over a period of 12 min.
Thigh scans were performed with a two-element spine matrix and body matrix using the same fMRI parameters as above (slow and fast scans), with sagittal slices covering the midthigh to the knee joint in the slow fMRI scan, and the midthigh to the midshank in the fast fMRI scan.
Anatomical scans.
The following parameters were used to collect T1-weighted anatomical MRI images: TR = 2.1 s, TE = 4.38 ms, flip angle = 8°, FOV = 220 mm, slice thickness = 1 mm, in-plane resolution = 0.86 × 0.86 mm2, and number of sagittal slices = 160. Rapid T1 images were acquired for six subjects with the following parameters: TR = 4.4 s, TE = 2.46 ms, flip angle = 90°, FOV = 250 mm, slice thickness = 5 mm, in-plane resolution = 0.78 × 0.78 mm2, and number of sagittal slices = 25.
fMRI data preprocessing.
Functional MRI data were preprocessed using FEAT (FMRI Expert Analysis Tool) Version 5.98, part of FSL (FMRIB's Software Library, www.fmrib.ox.ac.uk/fsl). This included skull extraction, slice-timing correction, bulk head-motion correction, spatial smoothing (Gaussian kernel of full-width-half-maximum 5 mm for slow fMRI and 6 mm for fast fMRI), and a high-pass (150 s) temporal filter. All participants maintained peak-to-peak head motion < 3 mm for all scans. Probabilistic independent component analysis was then implemented in MELODIC (Multivariate Exploratory Linear Decomposition into Independent Components) to decompose preprocessed data (excluding fast-fMRI data) into independent time courses and spatial maps (Hyvärinen and Pajunen, 1999). Temporal and spatial components associated with motion, CSF, and white matter were automatically identified and their time courses were regressed out of the BOLD signal as covariates of no interest. CSF and white matter signal were further accounted for by identifying time course activities of single voxels in the lateral ventricle and posterior cerebral white matter and were regressed out of the BOLD signal. Head motion (derived from motion correction) and the global mean BOLD signal were also removed by means of linear regression.
Functional MRI data of the thigh was preprocessed with FEAT using the same motion correction, slice-timing correction, spatial smoothing, and a high-pass temporal filter as the brain scans. MELODIC was not performed on the thigh scans.
Autonomic signal collection and processing.
Continuous heart rate and respiration signals were collected at 400 Hz for all subjects with an ADInstruments 4/30 Powerlab recording system and LabChart software. Cardiac pulse was recorded with a force transducer attached to the big toe of the right foot. Breathing was recorded with an elastic strap enclosing a force transducer placed around the lower rib cage. Signal processing was performed with an in-house Matlab algorithm. Heart rate (HR) was determined on a beat-to-beat basis by measuring the amount of time between consecutive heartbeats (seconds per beat). This signal was inverted to beats per second. Respiratory volume per unit time (RVT) was determined by measuring the amplitude of each respiratory peak and dividing by the time from the beginning of inhale to the end of exhale for each breath. Each signal was inspected by eye for missing beats or breaths, and was corrected by spline interpolation. Of all signal used in the analysis, less than ∼5% required correction.
Spectral analysis.
Spectral analysis was performed using custom Matlab (The MathWorks, 2009) routines and is similar to methods reported previously (Zuo et al., 2010). Frequency power of the BOLD signal was determined voxelwise using Welch's method and normalized by dividing by total power. This normalization was necessary as the absolute power of BOLD remains unknown simply because the absolute intensity of BOLD signal in time space is also unknown and assigned an arbitrary value in all standard fMRI analyses. The average power of each frequency band [low frequency (LF): 0.01–0.05 Hz, medium frequency 1 (MF1): 0.05–0.10 Hz, medium frequency 2 (MF2) 0.10–0.15 Hz, and high frequency (HF): 0.15–0.20 Hz] was calculated at each voxel and converted into four different maps for each subject. Individual subject maps were transformed into standard space using FLIRT (Jenkinson and Smith, 2001) and multiplied by a standard gray matter mask. Group mean power spectral density distribution maps were created by averaging maps across subjects. Subject-level maps were transformed to z-score maps by subtracting the mean voxelwise power for the entire brain and dividing by the SD. Group mean z-statistic images, or spectral density maps (SDMs), were generated by entering subject z-score maps into FSL FEAT analysis using mixed-effects ordinary least-squares regression. z-statistic images were thresholded at z > 2.3, and clusters, correcting for multiple comparisons, were determined by a cluster significance threshold of p < 0.05. Paired t tests between regions exceeding threshold were compared for power at each frequency band; p < 0.05 was considered a significant change.
The group default mode network (DMN) was determined by averaging subject-level z-statistic images from an independent component analysis in MELODIC, registered to standard space and thresholded at z > 2.3. Whole-brain power density maps were then masked with the group-average DMN to create DMN power spectral density maps.
Brodmann analysis.
Subject brains registered to standard space were divided into Brodmann regions using a standard atlas from MRIcron (Rorden and Brett, 2000). The mean z-score power for each region within subject was determined to calculate group mean and SE. Brodmann regions were placed into multimodal or unimodal groups according to prior classification (Mesulam, 1998). For easier visualization, Brodmann regions were ordered by rank of power in the LF band.
Visual–motor task analysis.
To determine brain regions associated with performing the visual–motor task, finger movement reflecting size of the task bar was recorded and convolved with a standard hemodynamic response function (gamma function: lag = 6 s, SD = 3 s). The resulting time series was modeled into a general linear model (GLM) analysis using FMRIB's FILM with local autocorrelation (Worsley, 2005). Second-level group statistical maps were generated using an ordinary least-squares, mixed-effects model. z-statistic maps were thresholded at z > 2.3, correcting for multiple comparisons with a cluster significance threshold of p < 0.05. This threshold was chosen to maximize overlap between task-related regions and regions showing significant changes in BOLD frequency band power. To determine the differences in BOLD frequency band power distribution between rest and task, a voxelwise paired t test was performed on SDMs using an ordinary least-squares, mixed-effects model. z-statistic images were thresholded at z > 2.3, and clusters, correcting for multiple comparisons, were determined by a cluster significance threshold of p < 0.05. Percentage overlap was determined by the ratio of significant voxels with significant changes in power overlapping the number of significant voxels related to the task as determined by GLM.
Physiological noise analysis.
To determine the effect of cardiorespiratory activity on the distribution of frequency band power for the entire brain, HR and RVT signals were averaged at every TR and the resulting vectors were removed voxelwise from the BOLD using Matlab linear regression. Of the 17 subjects, 12 subjects were included in the analysis, 1 subject had missing data, and 4 subjects had temporal artifacts in the autonomic signal that could not be corrected by interpolation.
z-scored SDMs were generated from rapid TR fMRI scans in a manner similar to those obtained with slower TRs. z-scores for each frequency band were generated by subtracting the mean voxelwise power for the midline sagittal slice and dividing by the SD. Subject z-score maps were averaged using a fixed-effects model to create group level z-statistic maps. BOLD signal significantly affected by physiological noise was determined by observing the distribution of power around frequency bands known to be associated with cardiorespiratory activity and showing relevant peaks for the group average midline slice BOLD frequency spectrum (0.2–0.4 Hz, and 0.75–1.5 Hz). Regions exceeding z > 2.3 for these frequency bands were masked from further analysis of the midline slice. The group average z-score distribution for the slow fMRI dataset was obtained using the same mask. BOLD SDMs of the right leg were made in a manner identical to the brain SDMs, without physiologic correction.
Results
Whole-brain frequency distribution maps
The frequency range for BOLD signal is highly compressed (in contrast to LFP or EEG), due to the blood hemodynamic filtering and fMRI sampling rate. Still, in analogy to EEG literature where oscillatory activity is indexed by mean power in predefined frequency bands, BOLD signal can readily be subdivided into separate frequency bands (the four frequency ranges we use are as follows: LF = 0.01–0.05 Hz, MF1 = 0.05–0.10 Hz, MF2 = 0.10–0.15 Hz, and HF = 0.15–0.20 Hz, limited by our sampling rate of fMRI signal, TR = 2.5 s). We subdivide the bandwidth into equal regions as the BOLD power spectrum shows 1/f, or scale-free behavior, with no obvious peaks (He at al., 2010) (see also Fig. 2B below). Power for each of these bands can be determined for every voxel of the brain in individual subject fMRI data. Averaging these values across subjects then reveals mean populational power distribution for BOLD oscillations as a function of frequency bands. We used this approach on fMRI resting-state data (n = 17 subjects). Group-averaged power histograms for the four channels for gray matter voxels within the whole brain indicates that largest power is in the lowest frequency band, and mean power decreases with increasing frequency bands. Moreover, the histograms for LF, MF1, and MF2 show unique distributions with LF exhibiting the most extended distribution of power, MF1 having the sharpest, and MF2 and LF ranging in between. These differences in distributions provide justification regarding the choice of frequency band cutoffs (Fig. 1, right histograms). Group-averaged voxelwise spatial distribution of power for BOLD oscillations shows a striking pattern of spatial segregation of magnitudes across the frequency bands, and a spatially structured gradient of transitions from low to high magnitude power, for each frequency band (Fig. 1, left brain maps). Moreover, different bands appear localized to anatomically defined structures. Highest-magnitude power for LF band is located in frontal, parietal, and occipital cortices, and lowest power in temporal and subcortical areas. There seems to be a gradual reversal of this pattern for higher-frequency bands, with HF band showing lowest-magnitude power in frontal, parietal, and occipital cortices, and highest power in cingulate and temporal cortices and subcortical areas.
Figure 2.
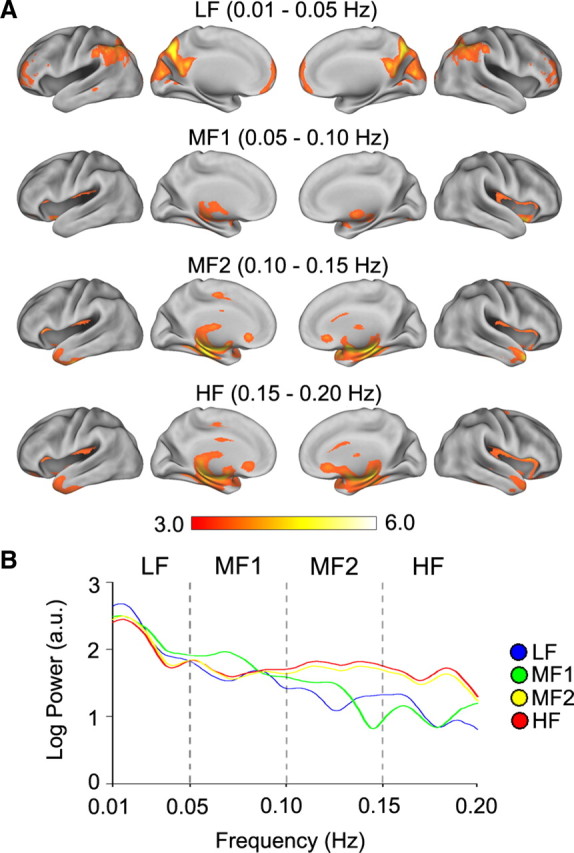
Band-specific SDMs showing the spatial structure of statistically significant power for BOLD oscillations for each frequency band. A, The four rows show statistically significant SDMs for four frequency bands for resting-state fMRI in n = 17 subjects (mixed-effects model, z > 2.3, cluster p < 0.05, corrected for multiple comparisons). B, Average power spectral density for all voxels comprising SDMs in A, calculated by averaging the time series for all voxels within each SDM, transforming to a power spectrum for each subject, and then averaging power spectra across subjects.
Figure 1.

Spatial structure of power spectral density distribution for BOLD oscillations in the whole brain in resting-state fMRI. Power spectrum of BOLD was subdivided into four equal bands: LF, MF1, MF2, and HF, and power for each band was measured only for gray matter voxels, averaged across subjects (n = 17). The four rows show spatial distribution of mean magnitude of power for each frequency band. Right, Histograms of group-averaged mean power distribution for the four frequency bands, for the entire brain. The lowest-frequency band (LF) has the highest power, and is localized mainly to prefrontal, parietal, and occipital cortex. The higher-frequency bands exhibit less power, and localize more within cingulate, insula, temporal cortex, and subcortical structures. Each row depicts the brain in the sequence of left (L) lateral, L medial, right (R) medial, and R lateral views. Note that the power range is distinct for each row (color bar range), derived from the corresponding histogram (same color code for >70% power).
To statistically quantify the spatial localization of power for BOLD oscillations as a function of the four frequency bands, we transformed the absolute values of power to z-scores, and calculated group-averaged statistically significant band-specific SDMs. The SDMs were determined for our resting-state fMRI for n = 17 subjects dataset (Fig. 2A), as well as for a second set of resting-state fMRI where n = 195 subjects from the 1000 Functional Connectome Project (nitrc.org/projects/fcon_1000, data not shown). For frequency bands of LF, MF2, and HF, the SDDMs are very similar between the two datasets. Moreover, the power spectrum generated from all voxels constituting thresholded SDMs (n = 17 subjects dataset) shows that LF power is highest for all SDMs, but SDMs also peak within LF and MF1 frequency bands while MF2 and HF spectra are essentially identical (Fig. 2B). Across the two datasets the SDMs show that the statistically most significant power for LF is located in prefrontal, parietal, and occipital cortices; MF1 is most consistently localized to subcortical regions and mainly in the thalamus and basal ganglia; MF2 in the insula and temporal cortex; and HF also is localized to the insula, temporal cortex as well as subcortical regions. These results are the first systematic demonstration of BOLD power distribution as a function of frequency and are in agreement with a recent report showing that fMRI power spectra vary across different brain regions (He et al., 2010). They also match with results of two studies: (1) Zuo et al. (2010) studied resting-state fMRI power spectra using two different approaches [amplitude of low-frequency fluctuations (ALFF) and fractional ALFF], divided power spectrum into four bands (slightly different from ours), and observed that individual frequency bands show distinct spatial profiles. Specifically, their Figure S4 shows many similarities to the SDMs we identify in Figure 2. (2) Salvador et al. (2008) examined brain resting-state functional connectivity (defined by a mutual information coherence metric), for three frequency bands, and their mutual information map for each brain area (90 divisions) relative to the rest of the brain (their Fig. 2) shows many similarities to our results in Figures 1 and 2.
Gross parceling of neocortex reveals segregation by frequency bands of BOLD oscillations
Above we demonstrate spatial segregation of power for BOLD oscillations by analyzing the brain on a per-voxel basis. To test whether this spatial resolution is critical and whether a more gross parcellation of the brain would still identify frequency band-specific rules for BOLD oscillations, we analyzed the same fMRI resting-state data (n = 17 subjects) when the neocortex was subdivided to constituent regions of interest that approximate Brodmann areas (BAs). We grouped BAs using categorization of the regions based on synaptic properties (Mesulam, 1998) that when studied as gray matter density networks exhibit distinct topological properties (Bassett et al., 2008), namely BAs that are classified as unimodal and transmodal. Unimodal BAs encode basic features of sensation or motor output, are cytoarchitecturally most differentiated, and receive and transmit information to limited cortical regions, while transmodal areas are limbic and paralimbic regions with more diverse and heterogeneous connectivity and function (Mesulam, 1998).
We calculated averaged z-scored power for each BA, over all voxels and both hemispheres, for all four frequency bands of BOLD oscillations and rank ordered them by power in LF band. Group-averaged (n = 17 subjects) power distribution (Fig. 3A) shows that unimodal BAs are dominated by LF band, while transmodal areas are dominated by MF2 and HF band BOLD oscillations.
Figure 3.

Distribution of power spectral density for BOLD oscillations, across the four frequency bands, when the neocortex is subdivided into large regions of interest. A, Mean power for each frequency band is shown for 27 BAs (averaged over both hemispheres), rank ordered by power in LF band. BAs classified by anatomical and physiological criteria as unimodal and transmodal are shown. Unimodal BAs encode basic features of sensation, while transmodal BAs are paralimbic and limbic cortices with more diverse functional and anatomical features (Mesulam, 1998). Transmodal BAs, in contrast to unimodal areas, are dominated by high-frequency bands. B, Visual cortical BAs (delineated on adjacent brain) ordered hierarchically with increasing complexity in connectivity and information processing (ventral stream). This ordering corresponds to an overall decrease of power in LF and increased power in MF2 and HF bands for BAs further removed from primary visual cortex, with the exception of BA 21.
The result above suggests the general principle that brain regions with more complex information processing should exhibit more power in higher-frequency BOLD oscillations. We tested this notion for BAs comprising the ventral visual stream. Ordering these BAs by processing hierarchy (Ungerleider and Haxby, 1994), that is, by the information flow from primary visual cortex to subsequent relays within the ventral visual stream, we generally observe decreased power in LF, and increased power in MF2 and HF bands (Fig. 3B). Thus, with increased complexity of (connectivity, cytoarchitecture, and information) processing within the sensory stream, transforming sensation to visual cognition is accompanied with increased amplitude for high-frequency BOLD oscillations.
Analysis of individual BAs indicates a general principle of correspondence between frequency content and hodology. Therefore, both single-voxel and BA-parceled analyses point to the principle that power of BOLD oscillations varies with brain anatomy, as well as underlying connectivity and/or functional complexity.
Frequency-dependent organization of default mode network
The SDM for LF band (Fig. 2) shows that largest power in this lowest-frequency BOLD oscillations is located in medial prefrontal and medial and lateral posterior parietal cortices, which together approximate brain regions that comprise the most prominent intrinsically connected network, namely the DMN (Raichle et al., 2001; Greicius et al., 2003; Greicius and Menon, 2004; Fox et al., 2005; Raichle, 2006). A similar observation was made previously by Zuo et al. (2010). In resting-state fMRI, the DMN is usually identified by first filtering the BOLD signal to a range that approximately corresponds to the LF and MF1 bands in our analysis and then applying either independent component or seed-based connectivity analyses (Raichle et al., 2001; Greicius et al., 2003; Greicius and Menon, 2004; Fox et al., 2005; Raichle, 2006; Biswal et al., 2010). However, Figure 1 also indicates that the brain regions comprising DMN also show oscillations at higher frequencies albeit at lower amplitudes, prompting the hypothesis that the DMN may be composed of frequency-dependent subregions. To test this hypothesis, we isolated the DMN by independent components analysis (Fig. 4, inset) and determined spatial properties for frequency-dependent BOLD oscillations within DMN for resting fMRI.
Figure 4.

Spatial structure of power spectral density distribution for BOLD oscillations in the DMN in resting-state fMRI. Top inset depicts the DMN as identified by independent components analysis. The four columns show spatial distribution of mean magnitude of power for each frequency band. Each column shows right medial and lateral views, and a horizontal slice corresponding to the inset.
In similarity to the whole-brain results (Fig. 1), group-averaged power histograms for the four channels for gray matter voxels within the DMN indicates that largest power is in the lowest frequency band, power decreases with increasing frequency bands, and each band shows unique power distributions (data not shown). Corresponding spatial mean power distribution (Fig. 4) for each frequency band show a specific spatial localization of power for BOLD oscillations in the DMN. The most posterior portion of precuneus/posterior cingulate part of DMN is dominated by LF band, while orbital frontal and temporal cortex parts of DMN show BOLD oscillations mainly at MF2 and HF bands. The result demonstrates that the DMN has regions dominated by different frequency bands, and suggests the more general idea that resting-state networks may be composed of multiple subnetworks dominated with specific frequency BOLD oscillations.
BOLD power shifts for a task
The same 17 subjects also performed a visual–motor attentional task. In frequency space, we can pose the question as to how the task interacts with the characteristic oscillatory frequencies of the brain. The task may be viewed as pumping energy at a given frequency, which in this case was in the LF frequency band. How does this additional energy resonate with the distributed brain oscillators and what is the spatial pattern for this new power profile? In essence, GLM analysis makes the tacit assumption that task-related brain activity is limited to regions correlated with the task. The frequency domain analysis provides the means with which we can test the extent of reorganization of brain oscillations in the presence of a task in contrast to the absence of a task, and thus contrast changes in brain intrinsic properties for an extrinsic input.
Performing the same analysis for the task fMRI as we did for resting-state BOLD, we can quantify brain BOLD signal frequency-dependent characteristics for the task. A paired comparison between resting-state and task fMRI for whole-brain power of BOLD oscillations, for each frequency band, showed decreased mean and SD for LF, increased mean for MF1, and increased SD for MF2 (paired t test, p < 0.05) (Fig. 5B). These band-specific whole-brain shifts in power of BOLD oscillations further justify the choice of subdividing the spectrum into the four frequency bands.
Figure 5.

Shifts in power of BOLD oscillations during a task. A, Brain areas increased (red-yellow) and decreased (blue-green) with the task, based on standard GLM (n = 17 subjects; mixed-effects model, z > 2.3 and z < −2.3, cluster p < 0.05, corrected for multiple comparisons). B, Whole-brain changes in the mean and standard deviation (STD) of power distribution for the four bands of BOLD oscillations (each circle is one subject; thick lines = average, paired t test, *p < 0.05). Overall power is decreased in LF band and increased in MF1, while standard deviation is decreased for LF and increased for MF2 band. C, Voxelwise changes in power between rest and task, for each frequency band relative to the task [paired t test, mixed-effects model, z > 2.3 (red) and z < −2.3 (blue), cluster p < 0.05, corrected for multiple comparisons]. In the LF band (top row), only regional decreases in power are observed (blue), and these are localized to areas both within and outside task-positive and task-negative activations, based on GLM analysis (shaded areas). Bottom three rows, Higher-frequency bands show only regional increases in power and these overlap more with task-negative brain regions. The bar graph shows percentage overlap between voxels changing in power and those involved in the task.
To identify the spatial voxelwise power changes due to the presence of the task, we performed a voxelwise paired t test between the two conditions for each frequency band. The result shows a robust band-dependent difference between the two tasks. In the LF band, we only observe regional decreases in energy, while for MF1, MF2, and HF bands, we observe only regional increases in power (Fig. 5C). Thus, in the presence of a task, global and local energy is being pumped from low-frequency to higher-frequency bands, an observation consistent with reports of DMN disengagement during a task (Raichle et al., 2001; Greicius et al., 2003; Greicius and Menon, 2004; Fox et al., 2005; Raichle, 2006) and in agreement with recent results showing that during a task, local field potentials decrease in power for low frequencies and increase for higher frequencies or for broadband spectra (Manning et al., 2009; Miller et al., 2009). In the present study, we were able to spatially specify such changes in power. The brain regions where activity increased and decreased by the task (Fig. 5A), based on a voxelwise GLM of the time course of the task, only minimally overlapped with the brain regions where frequency-specific energy increases or decreases were observed (Fig. 5C). The extent of overlap between activity and frequency shifts (Fig. 5C, bar graphs) was <30%, and more extensive in relation to task-negative brain regions. Thus, during a task brain oscillatory activity shifts uniquely for different frequency bands in a spatially specific manner, changing activity in brain regions mostly not directly engaged in the task.
Thus, frequency space comparison between brain states provides novel information, which is independent from that garnered with standard GLM-based analyses. The results imply that during performance of a given task, there are large shifts in BOLD oscillatory activity for widespread brain areas outside of those activated for the task.
Potential confounds
Earlier research shows that in resting-state studies, high- and low-frequency activity can be contaminated by multiple physical and physiological confounds, and especially by heart rate and respiration sources and for higher-frequency BOLD oscillations (Wise et al., 2004; Shmueli et al., 2007; van Buuren et al., 2009). Our results above indicate that power for different frequency bands varies by anatomical and functional properties of the brain, has specific functional connectivity properties, and is globally and locally modulated by task. Moreover, we replicate the frequency band-specific SDMs in two groups of subjects, and in the group of 195 subjects, we observe much higher statistical significances for the identified SDMs. This all suggests that observed frequency-dependent structures seen in the neocortex and subcortical regions are minimally contaminated by confounds. Still, we performed a series of control studies to further test the extent to which physiological confounds may be contributing to our results.
As we collected heart rate and respiration signals online during resting-state fMRI, we could test their influence on the whole-brain SDMs. To this end, we first regressed out heart rate and respiration signal on a per-voxel basis in each subject [as previously suggested (Shmueli et al., 2007)], and then reanalyzed the data to determine the corrected group SDMs (n = 12 subjects) for the four frequency bands. The resultant maps showed little difference from uncorrected ones (data not shown).
A rapid fMRI scan sequence was done (n = 6 subjects, TR = 0.18 s) and a single midsagittal slice was analyzed. The choice of the slice was due to the expectation that midline BOLD signal should be the area most contaminated with physiological noise (Zuo et al., 2010). Physiological noise was identified in two regions of the group-averaged power spectrum (Fig. 6A). In the midsagittal slice, power for these two frequency bands identified the brainstem, borders between the brainstem and cerebellum, white matter, and other edges bordering the slice (Fig. 6A, insets). Group-averaged spatial distribution of z-scored power for our standard frequency bands was determined for the midline slice, after excluding voxels contaminated with physiological noise (mainly brainstem and cerebellum) (Fig. 6A, top). When the same analysis procedure was applied to the data where the whole brain was studied at a TR = 2.5, we observe close similarity of power distribution between the two datasets. Thus, we conclude that neocortical and subcortical BOLD oscillations, across all four frequency bands, are minimally contaminated with physiological noise, while brainstem and cerebellar BOLD signals contain more noise.
Figure 6.

Two experiments designed to identify possible confounds for spontaneous BOLD oscillations. A, To identify sources of physiological noise resting-state fMRI was done (n = 6 subjects) in a single brain slice, studied with fast scanning, and compared to whole-brain resting fMRI. Group-averaged spectrum (top, for the single slice imaged at TR = 0.185 s) identifies two ranges associated with cardiorespiratory noise (right two gray boxes; 0.2–0.4 Hz and 0.75–1.5 Hz). Group-averaged activity for power within these two specific bands, in the imaged midsagittal slice (right brains labeled with arrows; fixed-effects model, z > 2.3, cluster p < 0.05, corrected for multiple comparisons, accompanying color bar), identifies the brainstem, parts of the cerebellum, and white matter. The fast fMRI scans were examined in the frequency range of the slow data (leftmost box in top power spectrum, arrow: expanded in the lower-power graph). The spatial distribution of frequency band-specific z-scored power for BOLD for the supra-brainstem midsagittal slice is similar between slow and fast scans (bottom two rows of brain images; each column is for a specific frequency band as delimited; top row is mean of n = 6 subjects, fast scan; bottom row is mean of n = 17 subjects, slow scan). The color bar represents average z-scored power. B, To examine the contribution of blood flow to BOLD oscillations, fMRI was done in the leg muscle in one subject. Frequency band-specific power histograms show Gaussian distributions for BOLD signal in the leg (top). z-scored spatial distribution of frequency band-specific power exhibits no clustering comparable to the brain (the one large cluster in LF band is located on a tendon), even at low threshold (right panel).
To further clarify that neural tissue is necessary for the observed BOLD spatial segregation, we examined fMRI signal (at TR = 2.5) for muscle, and performed the same power distribution analysis as for brain fMRI scans. The frequency-specific power histograms demonstrated Gaussian distributions (Fig. 6B), whereas similar histograms for the brain were markedly varied (Fig. 1). The SDMs show that BOLD signal for muscle, across the frequency bands examined, exhibits a pattern more random/disorganized than that in the brain (Fig. 6B, bottom). The same analysis was performed on the muscle at TR = 0.18 s with similar results (not shown). Therefore, the spatial structure observed for brain BOLD oscillations (excluding brainstem and cerebellum) are minimally contaminated by physiological confounds and moreover the observed patterns are specific to brain tissue.
Discussion
This is the first systematic study of human whole-brain organization of BOLD oscillatory activity for the whole bandwidth of frequencies available with fMRI. The results demonstrate a reproducible structure for distribution of power across the four frequency bands of BOLD oscillations, particularly for the neocortex and subcortex. We observe novel, frequency-dependent, organizational rules for the whole brain when analyzed on a per-voxel basis, when the neocortex was grossly parceled into large chunks, BAs, and for the best characterized resting-state network, DMN. Moreover, by examining whole-brain power characteristics and voxelwise redistribution of power for fMRI in a simple task, in comparison to resting state, we uncover global frequency-dependent shifts and observe that large regions of the brain, the majority of which localize to outside of the regions responding to the task, change their BOLD oscillatory characteristics. The latter raises new intriguing questions as to even the definition of what is the brain fMRI response for a given task. Therefore, the approach reveals brain properties distinct from that commonly identified in time domain analyses.
The current study is a natural extension of a long list of studies, first pioneered by Biswal et al. (1995), showing that studying spontaneous fluctuations of resting-state brain fMRI signal provides new insights regarding the functional organization of the brain. More recently many groups have examined resting-state fMRI for higher-frequency BOLD oscillations (Mitra et al., 1997; Cordes et al., 2002; Wise et al., 2004; Duff et al., 2008; Salvador et al., 2008; He et al., 2010; Malinen et al., 2010; Zuo et al., 2010). Different studies subdivide the BOLD frequency bandwidth to 3–4 separate length bands (Salvador et al., 2008; Malinen et al., 2010; Zuo et al., 2010). Here we divided the BOLD bandwidth into four equal bands and provide multiple lines of evidence that each band shows specific properties. The work of Zuo et al. (2010) is most pertinent, as their approach is similar to ours; they too observed band-specific spatial structure, and additionally demonstrated that such structures are stable between repeat scans. On the other hand, Salvador et al. (2008) examined brain functional connectivity for three frequency bands (within the same range as our bands), and indicated that limbic and temporal regions exhibit the largest measures of coherence in their higher-frequency bands, consistent with our results. Given these earlier results (Salvador et al., 2008; Zuo et al., 2010) and our demonstration of band-specific SDMs in two separate groups of subjects, we conclude that resting-state BOLD oscillations, throughout the full BOLD bandwidth, exhibit frequency-dependent anatomically constrained spatial structure in the human brain.
We provide multiple lines of evidence to dispel the notion that the higher band BOLD signal in the brain is primarily a reflection of confounds (Wise et al., 2004; Shmueli et al., 2007; Chang and Glover, 2009; van Buuren et al., 2009; Teichert et al., 2010). Muscle scans indicate that blood flow alone is not sufficient for the structured organization of BOLD oscillations, and fast scans demonstrate that high-frequency physiological noise has little influence on the power distribution in midline cortical regions. Additionally, the suggestion that observed results are not due to confounds is supported by the fact that obtained spatial structure for 17 subjects could be replicated in another 195 subjects (data not shown), and is also approximately reproduced by others (Salvador et al., 2008; Zuo et al., 2010).
The basis of all fMRI studies is the assumption that BOLD signal reflects underlying electrical properties of local neuronal tissue because single neuronal activity as well as local field potentials strongly correlate with BOLD signal (Logothetis et al., 2001; Mukamel et al., 2005; Lee et al., 2010). Given this assumption and the obtained results, we can state that local human brain tissue exhibits characteristic electrical oscillatory activity. We do not know the correspondence between the BOLD frequency bands studied here and EEG frequencies; as a result, we cannot point to specific electrical, rhythmic or arrhythmic, oscillations, although new accumulating evidence points to such correspondences (Nir et al., 2008; He et al., 2010). Recent experiments suggest that BOLD signal may be more a reflection of local dendrosomatic processing and synaptic activity (Lippert et al., 2010), and optogenetic studies coupled with fMRI provide strong evidence that BOLD signal, at least in the neocortex and around the 0.1 Hz range, is due primarily to excitatory neuronal activity (Lee et al., 2010), suggesting that at least parts of our observations regarding segregation of BOLD oscillatory activity are due to local excitatory neuronal circuitry. Still, the direct relationship between local field potentials and excitatory and inhibitory neuronal activity remains to be shown for lower- and higher-frequency bands of BOLD oscillations.
In a seminal review article, Mesulam (1998) conceptualized the neuroanatomy of the cerebral cortex based on cytoarchitectonic and functional grounds and categorized the BAs into three categories. Recently, Bassett et al. (2008), using graph theoretical methods, examined gray matter density properties across these categories and showed that the multimodal brain areas are more hierarchically organized than the unimodal or transmodal areas. Here we demonstrate a remarkable difference between unimodal and transmodal areas regarding frequency-specific power of BOLD oscillations. The result suggests that more complex brain areas are dominated with higher-frequency BOLD oscillations. The observed pattern is also in agreement with the density of cholinergic innervation, which increases from unimodal to transmodal BAs (Mesulam, 1998). This idea was then corroborated by examining properties of BOLD oscillations within the visual ventral stream, where we observe that sensory–fugal information flow (increased complexity in information processing) is coupled with decrease in power in low-frequency, and increase in higher-frequency, BOLD oscillations. The notion that synaptic/functional/cytoarchitectonic complexity may be coupled with frequency-dependent BOLD oscillations is new and requires future studies as to relevance to sensory, motor, and cognitive processes.
The DMN is the most extensively studied resting-state network in the brain. It is deactivated in externally driven tasks and preferentially activated during internally focused tasks. When the DMN is determined by independent component analysis or by seed-based analysis (e.g., Biswal et al., 1995; Fox et al., 2005; Raichle, 2006; Cole et al., 2010), it is commonly defined by low-frequency BOLD oscillations. Here we used the DMN as an example case to illustrate the notion that resting-state networks may be comprised of frequency-specific subcomponents. The result challenges the definition of resting-state networks and suggests that they need to be investigated as a function of frequency of BOLD oscillations. Recent combined EEG and fMRI studies are consistent with this view and are beginning to unravel the relationships between band-specific EEG power spectra and distinct resting-state networks (Mantini et al., 2007; Jann et al., 2010).
Examining whole-brain and voxelwise shifts in power for BOLD oscillations during a task, in comparison to rest, we show global and local shifts in BOLD oscillations. The observed shifts were frequency band specific and spatially mostly occurred in brain areas not activated/deactivated by the task. Thus, frequency space comparison between brain states provides novel information, which is independent from that garnered with standard GLM-based analyses. Our frequency space approach has the advantage of not requiring a hemodynamic function. More importantly, the results imply that during performance of a given task there are large shifts in oscillatory activity for widespread brain areas outside of those activated for the task. By contrasting mutual information between resting state and a task (Salvador et al., 2008) could examine shifts in brain connectivity by a task. Both techniques link properties of the brain in rest to that during a task, yet the approaches are distinct and lead to different results. How the task details would modulate global and local frequency-dependent shifts in power remains to be studied. Still, the current result is a strong demonstration for the idea that GLM-based analyses does not fully capture brain states. Our approach provides a direct method for examining the effects of external inputs on brain intrinsic dynamics, expanding on investigations of the influence of internal dynamics on task related brain activity (Fox et al., 2007; Mennes et al., 2010).
Overall, examining frequency characteristics of BOLD oscillations, taking into account its full bandwidth, provides a new view of the organization of the brain. Mechanistically the obtained results are consistent with the idea that brain states are a consequence of brain dynamics, where interactions between various frequency oscillators is a critical component of this dynamics, with the novelty that oscillatory characteristics are embedded within spatial structure. We speculate that these patterns are adaptive and optimize information processing by increasing contrast between transient and sustained oscillations for distinct brain states, and for intrinsic versus extrinsic brain processes. Moreover, the structured power distribution of the human brain is likely a product of the limited capacity of transmission rate and integration capacity of neuronal processing elements that underlie the brain as a dynamical network.
Footnotes
The study was supported by NIH–NINDS Grant NS35115. M.N.B. is funded by an anonymous foundation. We thank the entire Apkarian laboratory for discussions and support; we also thank all participants for their time. We thank G. Cecchi, M. M. Mesulam, S. A. Khan, and D. Pelli for advice and suggestions.
References
- Baliki MN, Chialvo DR, Geha PY, Levy RM, Harden RN, Parrish TB, Apkarian AV. Chronic pain and the emotional brain: specific brain activity associated with spontaneous fluctuations of intensity of chronic back pain. J Neurosci. 2006;26:12165–12173. doi: 10.1523/JNEUROSCI.3576-06.2006. [DOI] [PMC free article] [PubMed] [Google Scholar]
- Bassett DS, Bullmore E, Verchinski BA, Mattay VS, Weinberger DR, Meyer-Lindenberg A. Hierarchical organization of human cortical networks in health and schizophrenia. J Neurosci. 2008;28:9239–9248. doi: 10.1523/JNEUROSCI.1929-08.2008. [DOI] [PMC free article] [PubMed] [Google Scholar]
- Berger H. On the electroencephalogram of man. The fourteen original reports on the human electroencephalogram. In: Gloor P, translator. New York: Elsevier; 1929. Reprint. 1969. [Google Scholar]
- Biswal B, Yetkin FZ, Haughton VM, Hyde JS. Functional connectivity in the motor cortex of resting human brain using echo-planar MRI. Magn Reson Med. 1995;34:537–541. doi: 10.1002/mrm.1910340409. [DOI] [PubMed] [Google Scholar]
- Biswal BB, Mennes M, Zuo XN, Gohel S, Kelly C, Smith SM, Beckmann CF, Adelstein JS, Buckner RL, Colcombe S, Dogonowski AM, Ernst M, Fair D, Hampson M, Hoptman MJ, Hyde JS, Kiviniemi VJ, Kötter R, Li SJ, Lin CP, et al. Toward discovery science of human brain function. Proc Natl Acad Sci U S A. 2010;107:4734–4739. doi: 10.1073/pnas.0911855107. [DOI] [PMC free article] [PubMed] [Google Scholar]
- Buzsáki G, Draguhn A. Neuronal oscillations in cortical networks. Science. 2004;304:1926–1929. doi: 10.1126/science.1099745. [DOI] [PubMed] [Google Scholar]
- Chalk M, Herrero JL, Gieselmann MA, Delicato LS, Gotthardt S, Thiele A. Attention reduces stimulus-driven gamma frequency oscillations and spike field coherence in V1. Neuron. 2010;66:114–125. doi: 10.1016/j.neuron.2010.03.013. [DOI] [PMC free article] [PubMed] [Google Scholar]
- Chang C, Glover GH. Effects of model-based physiological noise correction on default mode network anti-correlations and correlations. Neuroimage. 2009;47:1448–1459. doi: 10.1016/j.neuroimage.2009.05.012. [DOI] [PMC free article] [PubMed] [Google Scholar]
- Cole DM, Smith SM, Beckmann CF. Advances and pitfalls in the analysis and interpretation of resting-state FMRI data. Front Syst Neurosci. 2010;4:8. doi: 10.3389/fnsys.2010.00008. [DOI] [PMC free article] [PubMed] [Google Scholar]
- Cordes D, Haughton V, Carew JD, Arfanakis K, Maravilla K. Hierarchical clustering to measure connectivity in fMRI resting-state data. Magn Reson Imaging. 2002;20:305–317. doi: 10.1016/s0730-725x(02)00503-9. [DOI] [PubMed] [Google Scholar]
- Duff EP, Johnston LA, Xiong J, Fox PT, Mareels I, Egan GF. The power of spectral density analysis for mapping endogenous BOLD signal fluctuations. Hum Brain Mapp. 2008;29:778–790. doi: 10.1002/hbm.20601. [DOI] [PMC free article] [PubMed] [Google Scholar]
- Engel AK, Fries P, Singer W. Dynamic predictions: oscillations and synchrony in top-down processing. Nat Rev Neurosci. 2001;2:704–716. doi: 10.1038/35094565. [DOI] [PubMed] [Google Scholar]
- Fox MD, Snyder AZ, Vincent JL, Corbetta M, Van Essen DC, Raichle ME. The human brain is intrinsically organized into dynamic, anticorrelated functional networks. Proc Natl Acad Sci U S A. 2005;102:9673–9678. doi: 10.1073/pnas.0504136102. [DOI] [PMC free article] [PubMed] [Google Scholar]
- Fox MD, Snyder AZ, Vincent JL, Raichle ME. Intrinsic fluctuations within cortical systems account for intertrial variability in human behavior. Neuron. 2007;56:171–184. doi: 10.1016/j.neuron.2007.08.023. [DOI] [PubMed] [Google Scholar]
- Greicius MD, Menon V. Default-mode activity during a passive sensory task: uncoupled from deactivation but impacting activation. J Cogn Neurosci. 2004;16:1484–1492. doi: 10.1162/0898929042568532. [DOI] [PubMed] [Google Scholar]
- Greicius MD, Krasnow B, Reiss AL, Menon V. Functional connectivity in the resting brain: a network analysis of the default mode hypothesis. Proc Natl Acad Sci U S A. 2003;100:253–258. doi: 10.1073/pnas.0135058100. [DOI] [PMC free article] [PubMed] [Google Scholar]
- He BJ, Zempel JM, Snyder AZ, Raichle ME. The temporal structures and functional significance of scale-free brain activity. Neuron. 2010;66:353–369. doi: 10.1016/j.neuron.2010.04.020. [DOI] [PMC free article] [PubMed] [Google Scholar]
- Hu X, Le TH, Parrish T, Erhard P. Retrospective estimation and correction of physiologic motion in functional MRI. Magn Reson Med. 1995;34:201–212. doi: 10.1002/mrm.1910340211. [DOI] [PubMed] [Google Scholar]
- Hyvärinen A, Pajunen P. Nonlinear independent component analysis: existence and uniqueness results. Neural Netw. 1999;12:429–439. doi: 10.1016/s0893-6080(98)00140-3. [DOI] [PubMed] [Google Scholar]
- Jann K, Kottlow M, Dierks T, Boesch C, Koenig T. Topographic electrophysiological signatures of FMRI resting state networks. PLoS One. 2010;5:e12945. doi: 10.1371/journal.pone.0012945. [DOI] [PMC free article] [PubMed] [Google Scholar]
- Jenkinson M, Smith S. A global optimisation method for robust affine registration of brain images. Med Image Anal. 2001;5:143–156. doi: 10.1016/s1361-8415(01)00036-6. [DOI] [PubMed] [Google Scholar]
- Lee JH, Durand R, Gradinaru V, Zhang F, Goshen I, Kim DS, Fenno LE, Ramakrishnan C, Deisseroth K. Global and local fMRI signals driven by neurons defined optogenetically by type and wiring. Nature. 2010;465:788–792. doi: 10.1038/nature09108. [DOI] [PMC free article] [PubMed] [Google Scholar]
- Lippert MT, Steudel T, Ohl F, Logothetis NK, Kayser C. Coupling of neural activity and fMRI-BOLD in the motion area MT. Magn Reson Imaging. 2010;28:1087–1094. doi: 10.1016/j.mri.2009.12.028. [DOI] [PubMed] [Google Scholar]
- Logothetis NK, Pauls J, Augath M, Trinath T, Oeltermann A. Neurophysiological investigation of the basis of the fMRI signal. Nature. 2001;412:150–157. doi: 10.1038/35084005. [DOI] [PubMed] [Google Scholar]
- Malinen S, Vartiainen N, Hlushchuk Y, Koskinen M, Ramkumar P, Forss N, Kalso E, Hari R. Aberrant temporal and spatial brain activity during rest in patients with chronic pain. Proc Natl Acad Sci U S A. 2010;107:6493–6497. doi: 10.1073/pnas.1001504107. [DOI] [PMC free article] [PubMed] [Google Scholar]
- Manning JR, Jacobs J, Fried I, Kahana MJ. Broadband shifts in local field potential power spectra are correlated with single-neuron spiking in humans. J Neurosci. 2009;29:13613–13620. doi: 10.1523/JNEUROSCI.2041-09.2009. [DOI] [PMC free article] [PubMed] [Google Scholar]
- Mantini D, Perrucci MG, Del Gratta C, Romani GL, Corbetta M. Electrophysiological signatures of resting state networks in the human brain. Proc Natl Acad Sci U S A. 2007;104:13170–13175. doi: 10.1073/pnas.0700668104. [DOI] [PMC free article] [PubMed] [Google Scholar]
- Mennes M, Kelly C, Zuo XN, Di Martino A, Biswal BB, Castellanos FX, Milham MP. Inter-individual differences in resting-state functional connectivity predict task-induced BOLD activity. Neuroimage. 2010;50:1690–1701. doi: 10.1016/j.neuroimage.2010.01.002. [DOI] [PMC free article] [PubMed] [Google Scholar]
- Mesulam MM. From sensation to cognition. Brain. 1998;121:1013–1052. doi: 10.1093/brain/121.6.1013. [DOI] [PubMed] [Google Scholar]
- Miller KJ, Zanos S, Fetz EE, den Nijs M, Ojemann JG. Decoupling the cortical power spectrum reveals real-time representation of individual finger movements in humans. J Neurosci. 2009;29:3132–3137. doi: 10.1523/JNEUROSCI.5506-08.2009. [DOI] [PMC free article] [PubMed] [Google Scholar]
- Mitra PP, Ogawa S, Hu X, Uğurbil K. The nature of spatiotemporal changes in cerebral hemodynamics as manifested in functional magnetic resonance imaging. Magn Reson Med. 1997;37:511–518. doi: 10.1002/mrm.1910370407. [DOI] [PubMed] [Google Scholar]
- Mukamel R, Gelbard H, Arieli A, Hasson U, Fried I, Malach R. Coupling between neuronal firing, field potentials, and FMRI in human auditory cortex. Science. 2005;309:951–954. doi: 10.1126/science.1110913. [DOI] [PubMed] [Google Scholar]
- Nir Y, Mukamel R, Dinstein I, Privman E, Harel M, Fisch L, Gelbard-Sagiv H, Kipervasser S, Andelman F, Neufeld MY, Kramer U, Arieli A, Fried I, Malach R. Interhemispheric correlations of slow spontaneous neuronal fluctuations revealed in human sensory cortex. Nat Neurosci. 2008;11:1100–1108. doi: 10.1038/nn.2177. [DOI] [PMC free article] [PubMed] [Google Scholar]
- Palva JM, Monto S, Kulashekhar S, Palva S. Neuronal synchrony reveals working memory networks and predicts individual memory capacity. Proc Natl Acad Sci U S A. 2010;107:7580–7585. doi: 10.1073/pnas.0913113107. [DOI] [PMC free article] [PubMed] [Google Scholar]
- Raichle ME. Neuroscience. The brain's dark energy. Science. 2006;314:1249–1250. [PubMed] [Google Scholar]
- Raichle ME, MacLeod AM, Snyder AZ, Powers WJ, Gusnard DA, Shulman GL. A default mode of brain function. Proc Natl Acad Sci U S A. 2001;98:676–682. doi: 10.1073/pnas.98.2.676. [DOI] [PMC free article] [PubMed] [Google Scholar]
- Rodriguez E, George N, Lachaux JP, Martinerie J, Renault B, Varela FJ. Perception's shadow: long-distance synchronization of human brain activity. Nature. 1999;397:430–433. doi: 10.1038/17120. [DOI] [PubMed] [Google Scholar]
- Rorden C, Brett M. Stereotaxic display of brain lesions. Behav Neurol. 2000;12:191–200. doi: 10.1155/2000/421719. [DOI] [PubMed] [Google Scholar]
- Salvador R, Martínez A, Pomarol-Clotet E, Gomar J, Vila F, Sarró S, Capdevila A, Bullmore E. A simple view of the brain through a frequency-specific functional connectivity measure. Neuroimage. 2008;39:279–289. doi: 10.1016/j.neuroimage.2007.08.018. [DOI] [PubMed] [Google Scholar]
- Shackman AJ, McMenamin BW, Maxwell JS, Greischar LL, Davidson RJ. Identifying robust and sensitive frequency bands for interrogating neural oscillations. Neuroimage. 2010;51:1319–1333. doi: 10.1016/j.neuroimage.2010.03.037. [DOI] [PMC free article] [PubMed] [Google Scholar]
- Shaw JC. The brain's alpha rhythms and the mind. New York: Elsevier; 2003. [Google Scholar]
- Shmueli K, van Gelderen P, de Zwart JA, Horovitz SG, Fukunaga M, Jansma JM, Duyn JH. Low-frequency fluctuations in the cardiac rate as a source of variance in the resting-state fMRI BOLD signal. Neuroimage. 2007;38:306–320. doi: 10.1016/j.neuroimage.2007.07.037. [DOI] [PMC free article] [PubMed] [Google Scholar]
- Teichert T, Grinband J, Hirsch J, Ferrera VP. Effects of heartbeat and respiration on macaque fMRI: implications for functional connectivity. Neuropsychologia. 2010;48:1886–1894. doi: 10.1016/j.neuropsychologia.2009.11.026. [DOI] [PMC free article] [PubMed] [Google Scholar]
- Ungerleider LG, Haxby JV. ‘What’ and ‘where’ in the human brain. Curr Opin Neurobiol. 1994;4:157–165. doi: 10.1016/0959-4388(94)90066-3. [DOI] [PubMed] [Google Scholar]
- van Buuren M, Gladwin TE, Zandbelt BB, van den Heuvel M, Ramsey NF, Kahn RS, Vink M. Cardiorespiratory effects on default-mode network activity as measured with fMRI. Hum Brain Mapp. 2009;30:3031–3042. doi: 10.1002/hbm.20729. [DOI] [PMC free article] [PubMed] [Google Scholar]
- Wise RG, Ide K, Poulin MJ, Tracey I. Resting fluctuations in arterial carbon dioxide induce significant low frequency variations in BOLD signal. Neuroimage. 2004;21:1652–1664. doi: 10.1016/j.neuroimage.2003.11.025. [DOI] [PubMed] [Google Scholar]
- Worsley KJ. Spatial smoothing of autocorrelations to control the degrees of freedom in fMRI analysis. Neuroimage. 2005;26:635–641. doi: 10.1016/j.neuroimage.2005.02.007. [DOI] [PubMed] [Google Scholar]
- Zuo XN, Di Martino A, Kelly C, Shehzad ZE, Gee DG, Klein DF, Castellanos FX, Biswal BB, Milham MP. The oscillating brain: complex and reliable. Neuroimage. 2010;49:1432–1445. doi: 10.1016/j.neuroimage.2009.09.037. [DOI] [PMC free article] [PubMed] [Google Scholar]