Abstract
The validation parameters for pharmaceutical analyses were examined for the accelerator mass spectrometry measurement of 14C/C ratio, independent of chemical separation procedures. The isotope ratio measurement was specific (owing to the 14C label), stable across samples storage conditions for at least 1 year, linear over four orders of magnitude with an analytical range from 0.1 Modern to at least 2000 Modern (instrument specific). Furthermore, accuracy was excellent (between 1 and 3%), while precision expressed as coefficient of variation was between 1 and 6% determined primarily by radiocarbon content and the time spent analyzing a sample. Sensitivity, expressed as LOD and LLOQ was 1 and 10 attomoles of 14C, respectively (which can be expressed as compound equivalents) and for a typical small molecule labeled at 10% incorporated with 14C corresponds to 30 fg equivalents. Accelerator mass spectrometry provides a sensitive, accurate and precise method of measuring drug compounds in biological matrices.
Method validation proves that an analytical method is acceptable for its intended purpose. In recent years, conferences supported by the American Association of Pharmaceutical Scientists and the US FDA refined the concepts behind providing validated bioanalytical data from chromatographic and ligand-binding assays in support of new drug development [1], but these assays offer only comparative quantitation requiring internal standards and/or calibration curves. Accelerator mass spectrometry (AMS) is a method of directly quantifying the concentration of a rare isotope (<parts per billion [ppb]) versus a common isotope in a uniform matrix derived from a defined biological sample. AMS shares many characteristics with quantitation by isotope decay counting (e.g., liquid scintillation counting [LSC]), which also does not use internal standards or compound-specific calibration; however, AMS offers much greater sensitivity, specificity and versatility. Validation of AMS for pharmaceutical development adheres to the goals of the recent bioanalytical validation conferences but must rely on more analytically suitable guidelines from the US Pharmacopeia [2], International Conference on Harmonization [3] and the FDA [4,5] for a structure to perform and report such validations. Validation of any analytical method derives from trustworthy data on specificity, linearity, accuracy, precision, range, detection limit, quantitation limit and robustness [6]. This paper shows that AMS quantitation of an isotopic tracer or molecular label is a fundamentally validated measurement in its own right and that it can be used with bioanalytical separation instruments to provide valid bioanalytical quantitation for biomedical research and/or pharmaceutical development.
Accelerator mass spectrometry has developed over the past three decades for quantifying radioisotope concentrations in natural samples for specific isotopes whose half-lives are so long that decay counting is very inefficient (generally, isotopes with half-lives greater than approximately 100 years). Kutschera provides an overview of the breadth of current AMS applications [7]. AMS is most often applied to 14C for carbon dating archaeological or earth science samples. The progress in these areas is found in the proceedings of both international radiocarbon conferences and international AMS conferences held triennially and published in the journals: Radiocarbon (University of Arizona) and Nuclear Instruments and Methods B (Elsevier), respectively. Multiple interlaboratory comparison programs carried out by international radiocarbon dating facilities show that AMS is more accurate, precise, and robust than decay-counting techniques, including LSC and gas proportional counting (GPC) [8]. These programs covered 14C concentrations relevant to dating purposes: the parts per trillion (ppt) to parts per quadrillion (ppq) range of 14C/C concentrations that correspond to present day levels of 14C in living organisms back to organic residues that have been dead for 50,000 years. AMS was driven by the desire for radiocarbon dating milligram-sized samples whose natural decay rates were only 0.001–0.2 decays per min (dpm). Reliable absolute quantitation of a single sample was emphasized because these samples were small, unique, irreplaceable materials linked to a specific archaeological, social, or geological event, such as the medieval origin of a linen cloth on which appears an iconic image [9]. When biomolecular tracing with AMS was first demonstrated [10], procedures were developed from existing AMS processes for quantifying biochemical isolates for dating purposes [11] using the sample-preparation methods and the spectrometer operations that were already suitable for geoscience chronometry.
A basic overview of AMS operation in biomedical measurements can be found in short form [12] or in quantitative detail elsewhere [13]. The value of AMS for drug development is generally discussed by Turteltaub and Vogel [14], Lappin and Garner [15], and Wilding and Bell [16]. AMS counts specific isotopes using tandem isotope-ratio MS, but AMS is best thought of as an atom counter rather than a mass spectrometer. The typical concerns of molecular MS, such as species ionization or matrix effects, are not present in the AMS method. Instead, the mass of the single analyte is well known (14 amu for 14C) and all spectrometer parameters are stably maximized for the isotope(s) being counted. AMS measurements (for both earth and biological sciences) require the contamination-free definition of the assayed material and an isotopically nonfractionating conversion of the selected isolate to a uniform, matrix-independent form that readily makes negative elemental ions. These ions are transported, selected and identified by stable spectrometric sectors that propagate the ions from a sample to both the rare and common isotope detectors without differential losses. Even the ‘mass resolution’ of the several dipole magnets in an AMS is not important to valid operation of AMS. The comparison of a sampled isotope ratio to that of a National Institute of Science and Technology (US-NIST) traceable external reference standard quantifies an absolute isotope concentration for each measurement. AMS quantifies a 14C/C ratio which can be expressed succinctly by an internationally defined unit, ‘Modern’, which is approximately the concentration of natural 14C that is found throughout the atmosphere and living organisms [17]. This 14C/C concentration (1.118 ppt) is expressible in many different units, independent of the molecular weight or specific activity of a labeled compound under study.
We discuss the validation of 14C AMS analysis of biological materials for specificity, stability, linearity, range, repeatability, precision, accuracy, sensitivity, additivity and robustness. We do not discuss here any chemical-isolation procedures that may be necessary as a complement to the AMS measurement to provide chemical specificity, most importantly extraction and chromatography.
Validation measurements
Specificity
Specificity is the unequivocable detection of the compound under study in relevant samples independent of effects of impurities, matrices or degradation processes. Specificity is most often achieved through molecular isolation or identification, often as separation in a chromatograph, mass spectrometer or binding assay. AMS quantifies only a 14C molecular label that is nonspecific for the biochemical identity containing the 14C. Molecular specificity thus depends on sample isolation processes that limit the quantified 14C to those that are related to the studied compound. Unlike decay counting, AMS is specific to the isotopic identity (atomic mass and charge) of the detected atom, not its decay product. Other radioactive elements or optical noise (e.g., chemiluminescence) do not introduce sample-dependent nonspecificity to the quantitation. Matrix interferences are completely removed from AMS quantitation through the homogenization of all compounds and matrices to a common inorganic form (CO2 and carbon) prior to measurement [18]. This homogeneity is an essential property of isotope-ratio MS, ensuring that the isotope concentration measured for any fraction of the sample is equivalent to the average concentration of the entire sample.
Combining secondary ionization MS (SIMS) with AMS provided spatial information on 14C concentrations [19], but the ionization of carbon atoms from an organic matrix is so inefficient that decay-based radiography is more sensitive, if time consuming. AMS has been directly linked to separation instruments (GC and LC) by Lieberman et al. [20] and Choi et al. [21], but the chemical specificity must still be validated with respect to the chromatographic parameters and is not a general property of the AMS quantitation per se. AMS nonspecificity for the sources of 14C in a sample means that biochemical isolations define the measured isotope ratio; natural sources of 14C must be taken into account and unrecognized sources of 14C (contamination) must be scrupulously avoided or understood [13]. The effects of natural or purposely introduced 14C concentrations that contribute to quantitation and estimations of error are covered below.
Accelerator mass spectrometry specificity is thus best defined as an isotopic ‘instrument background’ obtained by introducing a sample that should be comprised of fossil fuel-derived carbon (i.e., no 14C). Any counts identified as 14C in the detector may be faint levels of 14C memory in the ion source from previous samples or adsorbed atoms in the sample from the atmosphere, but most are stable carbon isotopes that fortuitously scatter at low probability (≤10−10) from the molecular breakup of background ions in the AMS. Carbon dating extends to materials as old as 50,000 years [22], from which 14C concentrations of ppq (1:1015) are quantified. Biochemical AMS spectrometers are often operated at instrument backgrounds of order 10 ppq, primarily including scattered non-14C ions. These scattered ions change little from sample to sample because all samples are reduced to a particular inorganic form, and this instrument background is subtracted as a component of the experimentally derived biological or chemical control samples. Thus, the specificity of the instrument for quantifying the isotopic label extends to the order of parts per quadrillion.
Stability
Stability of an analytical method means that aliquots of the same sample provide equivalent quantitation after storage for various periods. The stability of AMS quantification over time arises from its lack of biochemical specificity, since no chemical or physical degradation affects the isotope concentration in a stored aliquot unless a volatile component is generated and allowed to escape. Even the natural decay of the radioisotope is easily calculated and corrected but is not significant. 14C concentration decays at a rate of 1% every 83 years and isotopic loss by decay is within any measurement errors for samples stored for decades. AMS stability relates only to the quantitation of the isotopic label within the total or a portion of a homogeneous suspension of the stored material. Chemical separations (e.g., metabolic profiles) of stored materials may diverge from initially measured profiles. This is not unique to AMS quantitation and is rightly a part of validation concerns for sample fractionation (e.g., chromatography) and storage profiles.
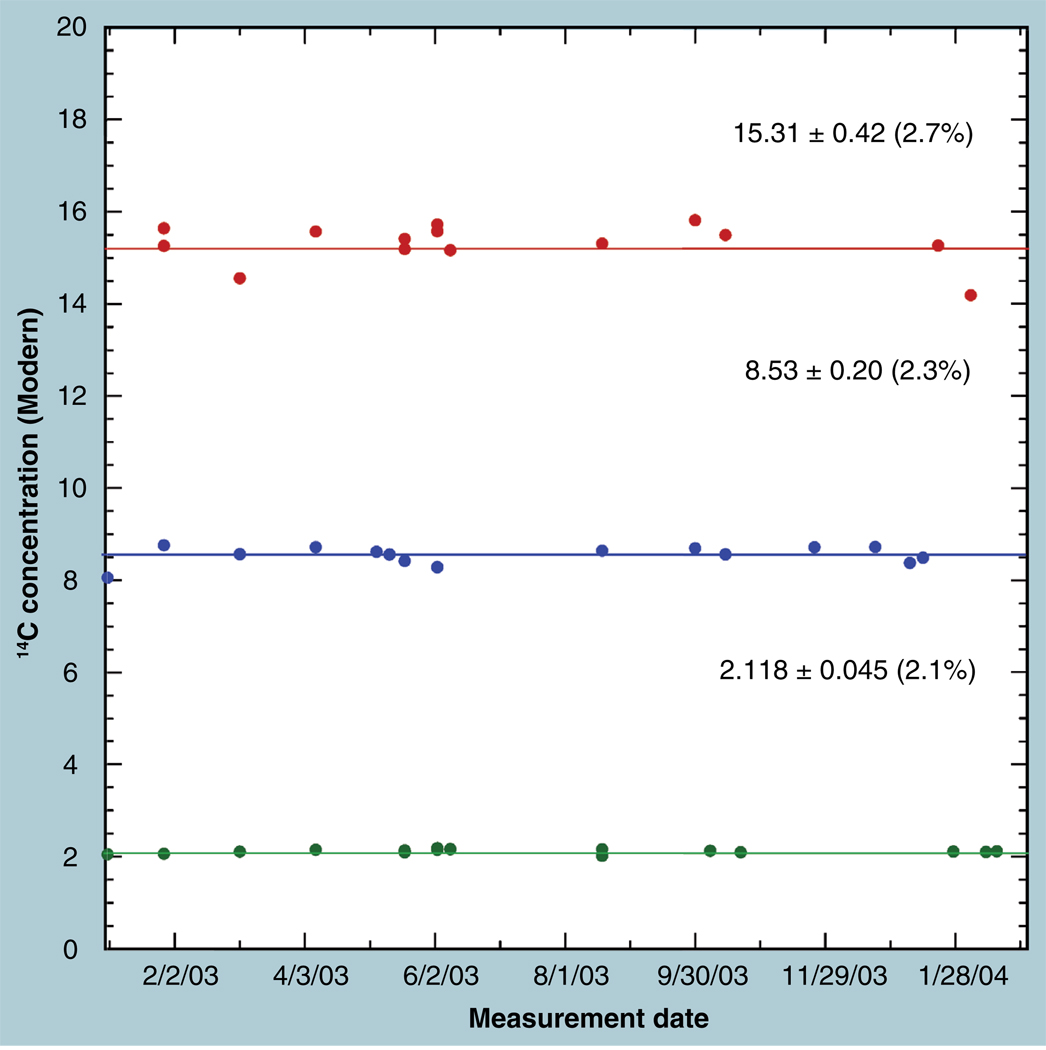
Figure 1 shows the stability over 1 year of AMS quantitation of the isotopic label concentrations in three stored sera that underwent at least 15 measurements from frozen aliquots. The coefficients of variation (CV) of the averages over that year were under 3% for all samples and there is no significant trend versus time (r2 = 0.067, 0.059 and 0.0012 [top to bottom]). The stability of AMS quantitation of the isotope concentration in homogenized fluids is enhanced by the independence of the measurement on the volume and amount of carbon in the measured aliquot. A uniform volume (20 µl) of the vortexed thawed samples were taken for each serum measurement in Figure 1, but any differences in the exact volumes have no effect on the isotope ratio measurement: a larger (smaller) volume would have proportionately more (less) of both the 14C and the total carbon of the original sample. The concentration of carbon per volume of serum is homeostatically constant in humans (~42 mg/ml) and the specific activity of the labeled drug is presumably known, so that the quantified concentration of drug equivalents in the sera is just as stable as the measured isotope concentrations.
Figure 1. Stability of accelerator mass spectrometry measurements of total 14C in three human serum samples is shown by periodic aliquots obtained from multiple freeze–thaw cycles throughout a year.
Coefficient of variations of the measured isotope concentrations were within 3%.
The stability of the fullerene filamentous powder, to which all samples at most AMS facilities are reduced prior to measurement, was tested on archived materials with the graphite’s 14C concentration as 0.7756 ± 0.0041 Modern in December 1988, and then as 0.7850 ± 0.0043 Modern in 2006, a difference of 1.2% [23]. The later measurement was higher than the initial one and may be due to contemporary atmospheric carbon adsorbing onto the fullerene powder over the 18 years, although the sample was sealed in a screw-top gasketed vial and not previously opened. This particular form of graphite powder is especially absorbent of organic vapors, and care must be taken to store the prepared materials away from any sources of 14C-labeled volatiles [24]. The difference of 1.2% is within a two standard deviation (SD) uncertainty on the difference. This shows that samples can be prepared, reduced to elemental carbon, stored and shipped for later AMS measurement without concern for chemical or isotopic changes over periods of years, let alone the more usual delay of days or weeks.
Linearity & range
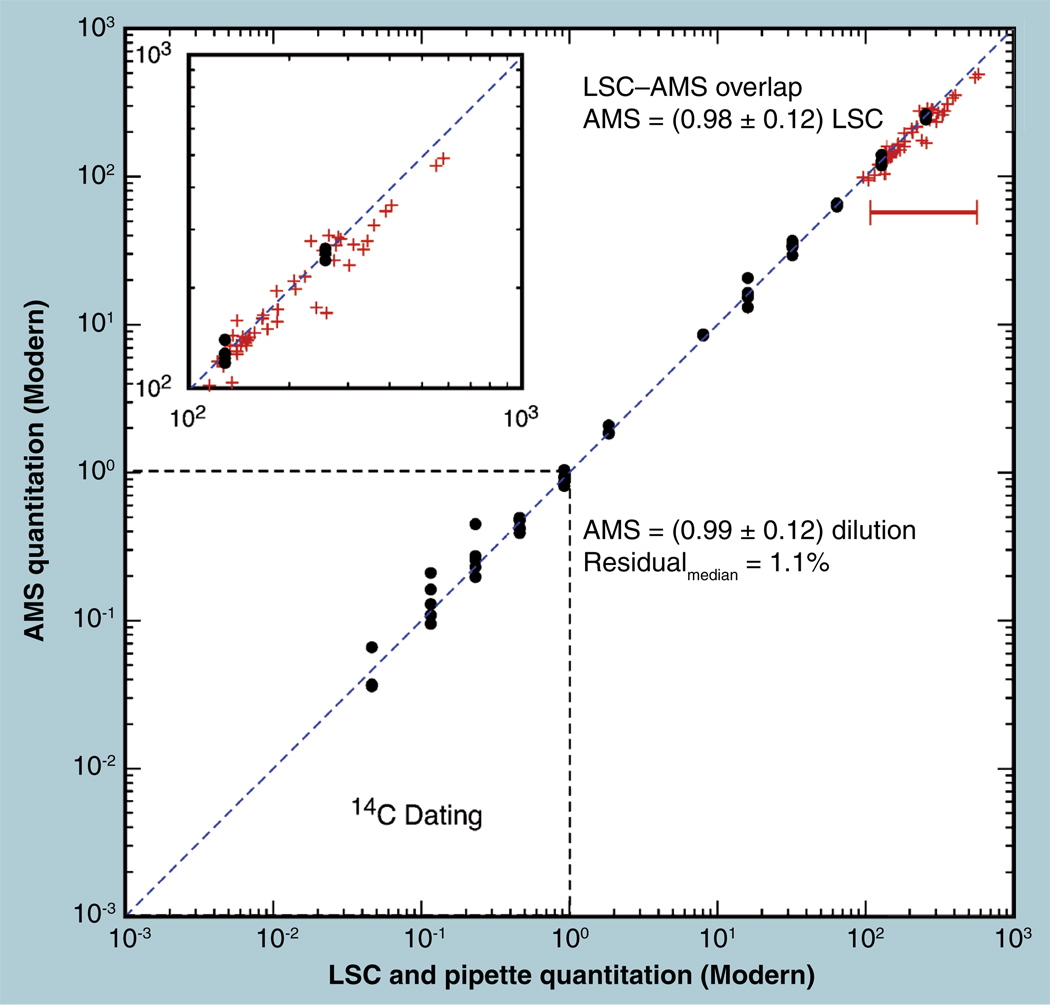
Linearity of an analytical method is a measure of the proportionality of the analyzed result to the amount of the analyte in the sample. AMS is designed to have absolute quantitation and, thus, linear response, over a wide range of isotope concentrations. The linearity of the lower three orders of magnitude of the AMS range, ppq to ppt, are rigorously demonstrated by the regular International Radiocarbon Intercomparisons [8] and International Radiocarbon Calibrations [22] to assure carbon-dating accuracy. Biomedical applications primarily (but not necessarily) quantify above the natural concentration of 1.2 ppt (Modern). Dilution series of biological fluids that begin at easily counted LSC concentrations are a common demonstration of linearity [25]. We show such a plot in Figure 2 (solid dots) for a urine dilution series over a range of 104. There is also a range of 14C concentrations above 100 Modern, for which milliliter urine samples are easily quantified by LSC while smaller aliquots (100 µl) are quantifiable by AMS. Over 50 human urines in this range were measured by both methods (shown as crosses in Figure 2 and the inset plot). The slope of these data matched those of the dilution series. The slopes and errors are consistent with a unity relationship. Certain difficulties in comparing LSC and AMS urinary 14C concentrations are discussed below.
Figure 2. Linearity of accelerator mass spectrometry (AMS) quantitation over five orders of magnitude is demonstrated by a urine dilution series (three or six samples at each concentration), 50 direct comparisons between liquid scintillation counting and AMS measurements of the same materials, and by the well documented range of 14C dating down to parts per quadrillion concentrations.
Linear regressions over the large dynamic range available from AMS are not possible because higher doses/responses dominate the minimization of residuals in deriving the fits. The straight line in the log–log plot in Figure 2 indicates that the relation is a power law and the best fit is found as the mean and SD of the ratio of the AMS measure to the direct LSC value (0.98 ± 0.12) or the calculated dilution factor (0.99 ± 0.12), showing a direct one to one proportionality. A linear regression of the logs of the data (forcing the regression program to minimize the fractional residuals for all data points), confirms linearity (exponent of power law = 0.989 ± 0.011, r2 = 0.9965). The median of the residuals to a constant slope between AMS and LSC/dilution in Figure 2 is 0.0% (sic) and the root mean squared (RMS) residual of all the data is 16% (8.5% above 0.8 Modern), showing that AMS is as linear as LSC over this range. Sub-Modern concentrations of 14C are validated through radiocarbon dating intercomparisons using LSC systems that are much more advanced than common systems in biochemical or environmental laboratories. The data in Figure 2 mean that AMS has been directly compared with LSC without dilutions or enrichments over six orders of magnitude, except from 1 Modern to 100 Modern. The urine dilution series spans this region with a reliable linear regression, validating linear AMS quantitation.
FDA guidelines suggest testing linearity for a target concentration of analyte by quantifying a tight range of three standards, such as 80, 100, and 120% of target, or a broader range of 50, 100 and 150%. This may be useful in specific AMS measurements of biological materials that have undergone extensive, possibly nonquantitative, isolation or purification, but the design and history of AMS indicates that the absolute quantitation of 14C in the presented sample material is linear well within 20% at all times. Thus, AMS is a valuable tool for drug development, during which response may not be well predicted, requiring multiple calibrations of other instruments. With wide range applicability, quantitation is assured even if quantified results fall well outside the range of expected concentrations.
Repeatability, precision & accuracy
Precision and accuracy are individually addressed but are intimately entwined in a quantitative technology for which multiple calibration materials are not widespread. Precision is a measure of reproducibility from multiple measures of several samples, preferably spanning a period of time and a range of concentrations. Accuracy is assessed from multiple measures of reference materials with well-known concentrations or from direct comparison to already accepted quantitative methods. Accuracy is implied once a method’s specificity, linearity, repeatability and precision are validated. First, the degree of repeatability of the instrument measurements was found to show that precision and accuracy can be reliably quantified by AMS.
Repeatability
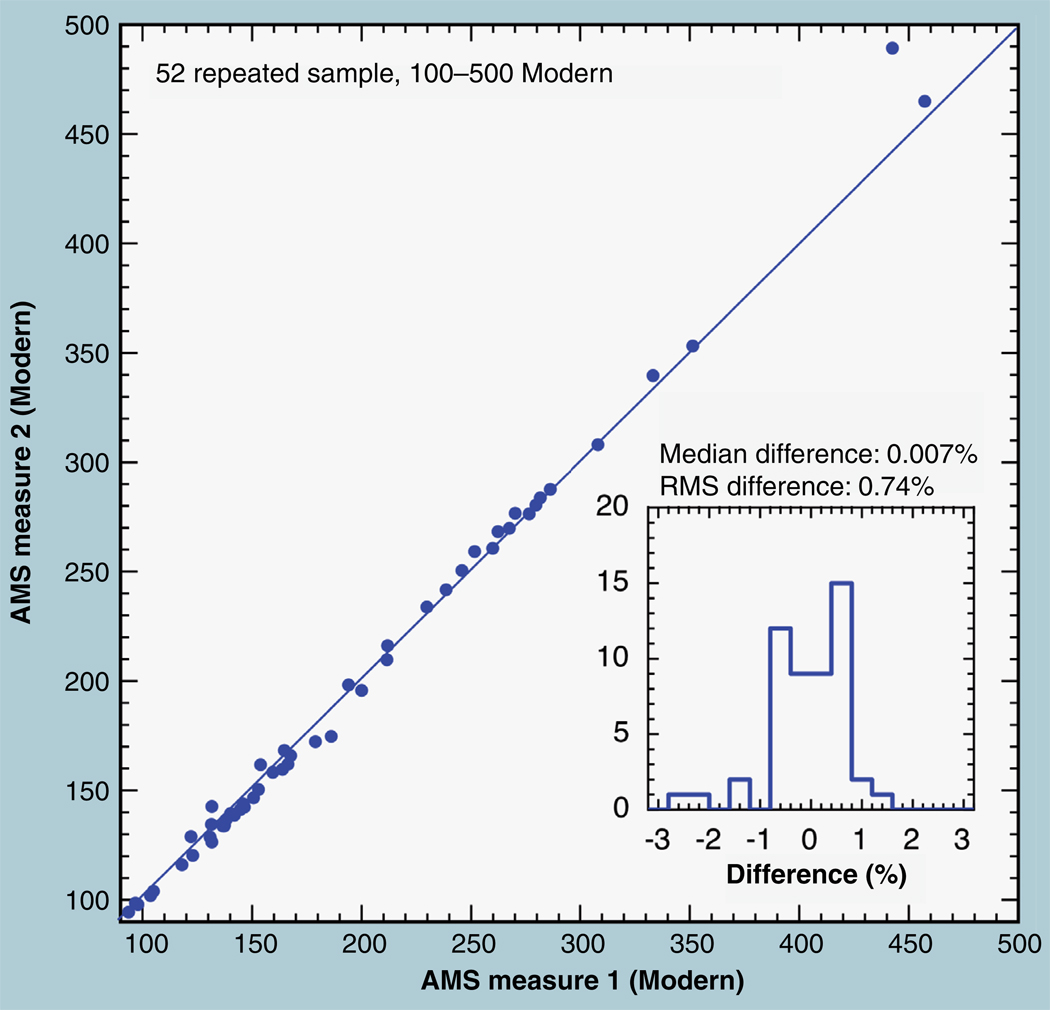
The inherent repeatability of AMS isotope ratio measurement is found by measuring a set of prepared and mounted samples on different occasions, preferably separated by several days under normal operating conditions. Figure 3 shows repeat normalized measurements of carbon samples derived from human urine that were obtained 10 days apart after the spectrometer had undergone several power cycles and measurement runs for other materials. The samples were removed from the ion source and stored in an argon-filled plastic bag. Samples are bombarded by caesium metal in the ion source and CsOH forms during removal in air that reacts with CO2 in the air, incorporating atmospheric 14C into an exposed sample. For this reason, samples are seldom retained and remeasured after being ceasiated, but samples with high 14C concentration are minimally affected by absorbed atmospheric CO2. Figure 3 shows that normalized measurements of samples from 90 to 450 Modern are reproducibly measured to a median difference of 0.007% with an RMS difference between the two sets of 0.74%, showing the high degree of repeatability of the spectrometer and its operation.
Figure 3. Total of 52 urine samples having high 14C concentrations (90–450 Modern) were remeasured 10 days apart.
Reproducibility averaged less than 0.01%, with an root mean squared difference of 0.74% between the two measurements. The inset shows that the frequency distribution of residuals was not Gaussian.
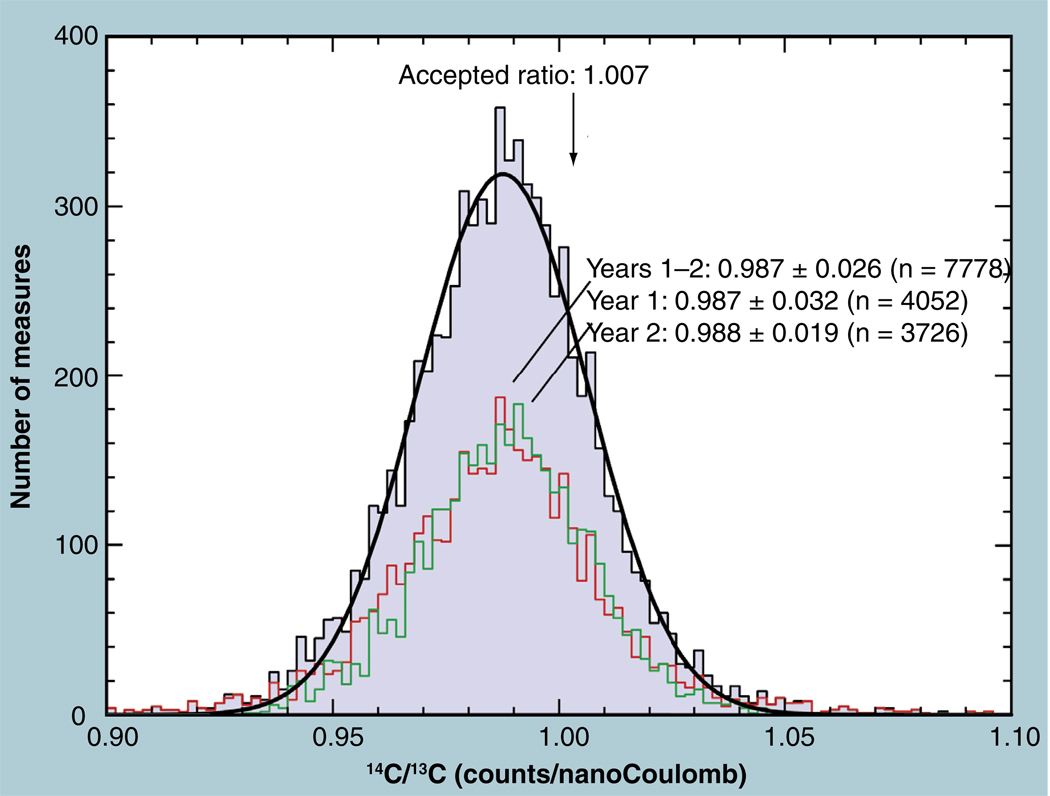
The repeatability of sample combustion, reduction and the routine operation of the spectrometer was demonstrated by measurements of the external standard that was included in every set of samples loaded into the spectrometer [64]. Figure 4 shows the frequency distribution of nearly 8000 isotope-ratio measurements on approximately 2000 separate samples of commonly used external standard, IAEA C-6 sucrose [26]. The theoretical ratio of 14C to 13C in this material is 1.61 × 10⁻¹⁰, which is expressed as 14C per nanoCoulombs (nC) of accelerated 13C ion current through division by the number of nanoCoulombs per singly charged 13C ion (the charge on the electron, a physical constant), 1.60 × 10⁻¹⁰ nC/ion, yielding an expected isotope ratio of 1.007 cts 14C per nC 13C. Figure 4 shows that these measurements (made over the course of 2 years) have an average raw ratio of 0.987, 2.0% less than the theoretical value as expected from the greater (but constant) scatter loss of the slower 14C through the spectrometer. The values closely follow a Gaussian distribution with a CV of 2.7%. These measurements were made under a variety of operators, operating conditions and graphite-production sources throughout 2 years, demonstrating the inherent repeatability of the AMS process from combustion to measurement over long periods, despite operator biases or spectrometer variances.
Figure 4. Frequency distribution of the raw isotope ratio for 4450 measurements of a 14C standard over the period of two years shows a 2.7% standard deviation in a nearly normal distribution.
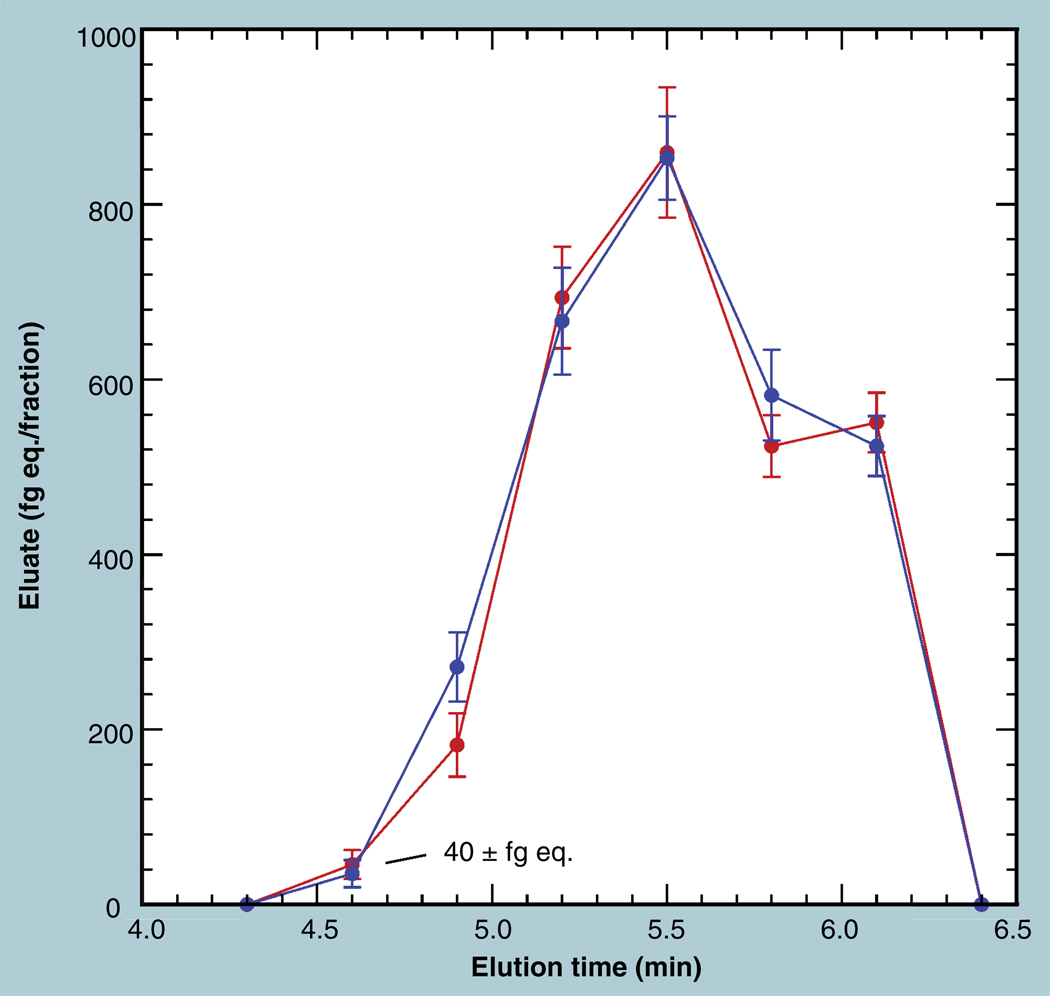
Accelerator mass spectrometry quantifies not only total isotopic label in defined samples of collected tissues or fluids, but also quantifies metabolic profiles and other small biochemical isolates. Eluents of LC separation, especially UPLC, contain very little carbon after solvent removal by centrifuge evacuation. An accurate aliquot of diluent carbon is added to the dried eluent to obtain enough mass for processing and for accurate quantitation of the tracer present in the fraction independent of variations of the fraction’s natural carbon content [13]. Figure 5 exemplifies the repeatability of this entire separation process, followed by sample dilution, combustion, reduction and measurement using separate UPLC runs performed on different days. The tracer level for each fraction is found by subtracting the known 14C concentration of the diluent carbon from the measured concentration for each fraction. The tracer level is then converted to grams of equivalent drug using the isomolar fraction (fraction of molecules containing 14C) of the labeled compound and its molecular weight. The uncertainties in both the sample isotope ratio and the carrier isotope ratio are propagated to provide a quotable uncertainty in the difference and, hence, in the specific metabolite quantity. Thus, AMS provides highly quantitative metabolite profiles with only external standards and no concern about differential ionization, the availability of internal standards, or compound-specific calibration curves. Note, especially, that zero drug equivalent (within stated error) is within the capability of AMS measurements, since the diluent carbon does have a known level of 14C. The introduction of a quantitative guidance for toxicity testing of circulating human metabolites of drug candidates emphasized the need for a method that robustly quantifies metabolic products, without resorting to perhaps unpredicted and unavailable internal standards [27].
Figure 5. Repeatability in accelerator mass spectrometry analysis of metabolite profiles by UPLC is shown for two LC runs completed on separate days.
The mass of equivalent drug was determined from the 14C concentration, the specific labeling of the compound and the molecular weight. Error bars represent propagated errors due to measurement of both the fraction and the added carrier compound.
The reproduced trace in Figure 5 is significantly correlated (Spearman rank correlation = 0.943). The differences between the repeats average 0.6% with an RMS difference of 5.4%, primarily contributed by the 5-min point. The individual error bars represent 1 SD uncertainty due to both sample and carrier measurement precision and, as such, should overlap at only two thirds of the data points. Only one of six replications do not overlap, however, showing a better than normal repeatability for the procedure. The nonoverlapping elution fraction is at the start of a metabolite peak, where very slight changes in fraction definition have comparatively larger effects. Quantitation is in the attomole range for this 2% labeled compound, allowing mass quantitation into the tens of femtograms.
The repeatability studies at high 14C concentrations (Figure 3) and low 14C concentrations (Figure 5) suggest that AMS measurements are highly reproducible (≤1%) and that complete process reproducibility was within 5%.
Precision
Accelerator mass spectrometry precision of a single measurement follows closely the Poisson uncertainty of the inverse of the square root of the total 14C counts [28]. A single measurement is made to almost any desired precision by obtaining sufficient counts, but the AMS measurement process includes sample aliquoting and conversion, as well as spectrometric quantification. Figure 1 demonstrated stability and, thus, a precision limit, in measuring multiple aliquots of sera to approximately 2.5%, in agreement with the long term AMS repeatability for an external standard material shown in Figure 4. Two other materials are frequently measured and provide other data to characterize measurement precision.
Biochemical isolations often produce samples that have very low carbon content. The preferred method of presenting the sample in the AMS spectrometer is as a stable reduced carbon (solid). A high-throughput process was described and patented for this purpose [29] which works best with a minimum of 350 µg of carbon. Biochemical isolates of even smaller mass are measured in a ‘carrier-added’ mode, in which known amounts of a well-characterized compound are added to the sample prior to processing to graphite. Tributyrin is a nonpolar, viscous fluid hydrocarbon at room temperature with low vapor pressure that is highly suitable for such a carrier. It is 60% carbon and contains no nitrogen, easing the condensation of the CO2 from the sample’s combustion. Typically, a 1-µl glass capillary of tributyrin (0.615 mg C) is added to samples of low mass. Multiple ‘blank’ samples the carrier are also processed and measured with the sample series. When the background materials are low in 14C, the Poisson nature of AMS counting allows an improvement in background precision and lower LLOQ through longer measurement periods. 14C-free materials are undesirable for this purpose, however, because measuring trustworthy background errors requires very long measurements, and the inadvertent incorporation of carbon ‘contamination’ is undetectable [13].
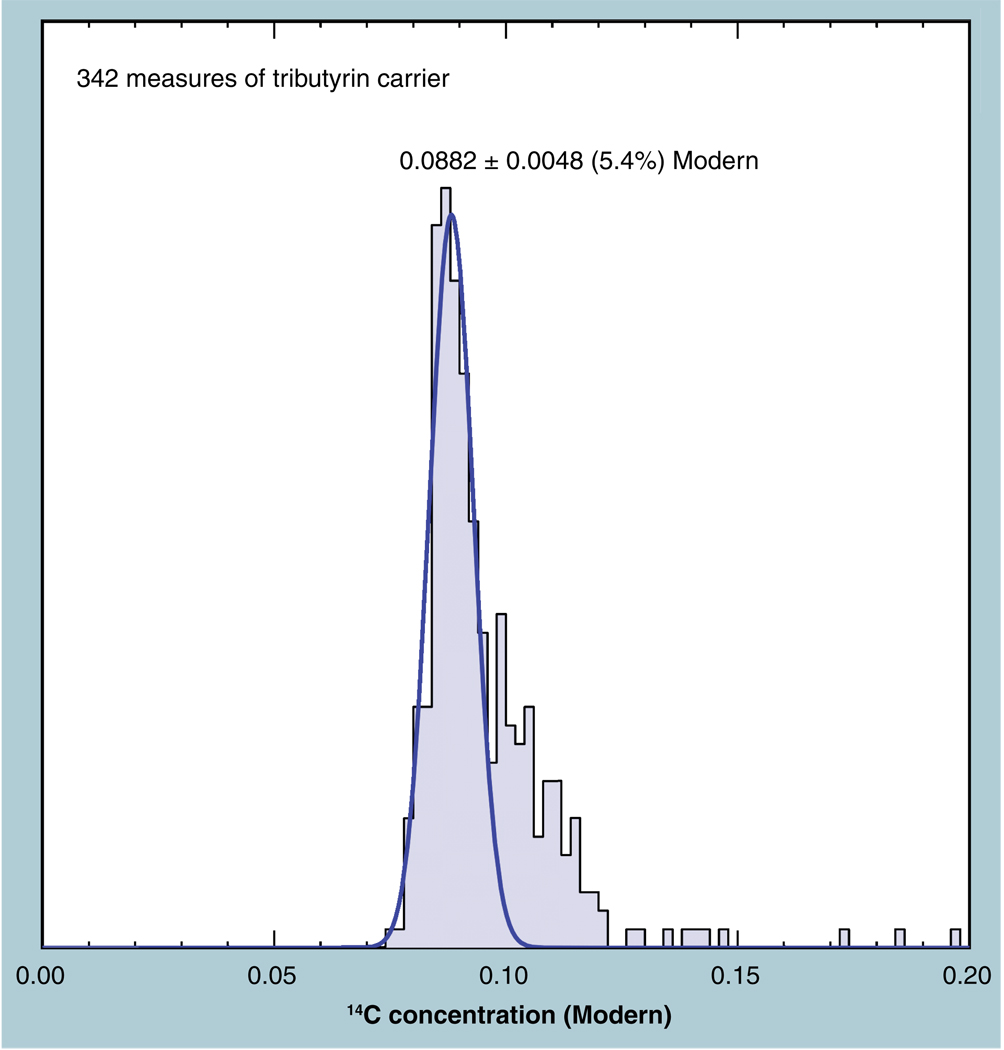
Several hundred measures of the tributyrin carrier had a normal distribution, approximately 8.8% Modern, with an enhanced tail toward higher values (Figure 6). Very small contaminations of adsorbed Modern CO2 on sample vessels can add 14C to produce such a tail. The normal distribution is fit to the primary peak of the frequency distribution and indicates a precision 5.4% CV. This precision is dominated by counting statistics, because often only 1000 counts were obtained for each measurement in these low 14C samples, predicting a precision no better than 3%. Higher counting precision is possible for low 14C samples through longer count times, at a cost of decreased daily throughput. In routine operation, 15–20 samples are measured per hour, but series of carrier-added fractions decrease this to approximately 10–15 per hour.
Figure 6. Frequency distribution of a 0.1-Modern carrier compound has a standard deviation of 5.4%, due primarily to counting statistics limited by impatient operators. A tail toward high values indicates occasional contamination with higher 14C.
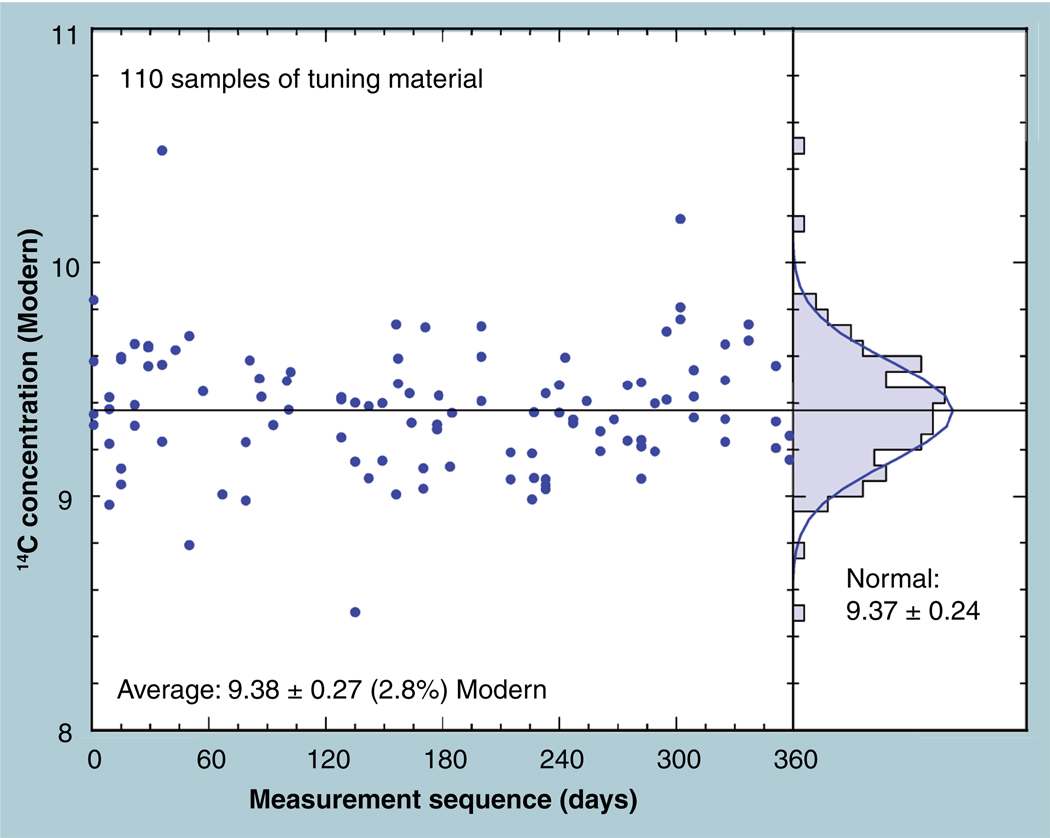
A 9-Modern material was used for assuring that the spectrometer is adjusted for optimal 14C transmission. A year’s worth of measurements is shown in Figure 7 for this homogenized leaf litter from a ‘14C-enhanced’ forest that has been counted by several decay counters in environmental research laboratories and by Lawrence Livermore National Laboratory (LLNL) AMS [30]. The consensus value was found to be 9.01 Modern, but AMS routinely gives a 3% higher value. More than 100 measurements over a period of 1 year show a near normal distribution with a CV of 2.6%. There is no significant time trend in the data (r2 = 0.0005).
Figure 7. The main plot shows the measured 14C concentrations versus time of measurements over a year’s period for a ‘hot’ international comparison material.
The measurements have a standard deviation of 2.8% and are well represented by a Gaussian distribution function with a 2.6% width.
Routine AMS measurements for biochemical analyses thus have an overall process precision of 2–5%, including sample aliquoting to isotope-ratio determination, as presently quantified.
Accuracy
The precision, linearity, stability and specificity shown above for AMS already imply a degree of accuracy within the 3% limits of measurement precisions. Determination of AMS accuracy is not needed across the entire range, although multiple trusted calibration materials are being developed. We discuss accuracy in terms of common materials of known isotope concentration and of direct AMS comparisons with accepted LSC-measured samples. Accuracy of AMS quantitation to much better than 1% is well documented in the range of carbon dating by quantifying countable tree rings or annual sediment layers used in calibrated radiocarbon dating [22].
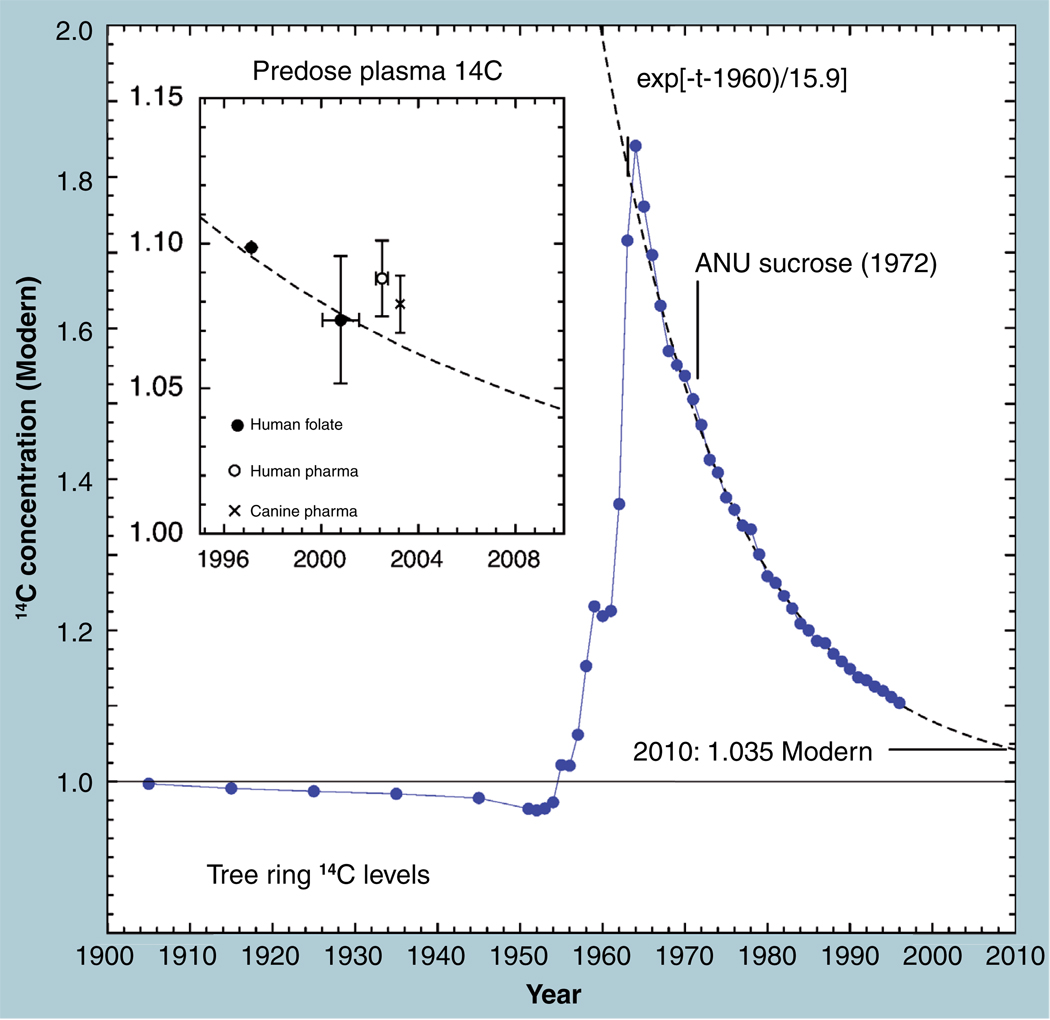
A NIST-sourced standard of known 14C concentration is used as the primary standard in 14C dating and for normalizing most AMS isotope ratios (Standard Reference Material: 4990 BC). The average atmospheric 14C concentration is present in recently grown plant materials and reflected in the predose 14C concentrations of rapidly replaced constituents of living animal hosts and human subjects, such as blood plasma. This concentration is known and determined with high confidence. 14C concentrations in living subjects closely follow the atmospheric concentrations, as recorded in tree rings or annual growth products (seeds or leaves). 14C is so rapidly equilibrated throughout the atmosphere (a few weeks) that the differences in 14C concentration among peoples throughout the world are minimal. The 14C concentration of the atmosphere and living biosphere in 1900 was correct at the NIST-traceable concentration known as ‘Modern’ (Figure 8). The increased industrial use of fossil fuels in the 20th century contributed to a decrease in the atmospheric 14C isotopic concentration, which was greatest during the intense industrial activity of World War II, as plotted in Figure 8. At that point, the testing of nuclear explosions above ground produced large amounts of 14C through the interactions of released neutrons with ubiquitous nitrogen. This trend reached a maximum in 1962, when multiple weapons tested in the upper atmosphere almost doubled the amount of 14C throughout the world’s air. A treaty banned such tests and allowed the natural exchange of CO2 between the atmosphere and the oceans to lower the 14C concentration with an apparent mean life of 16 years over the past four decades. A contemporary human should have 1.04 Modern (in 2009) blood, urine and sloughed epithelial cells, but if test animals (or subjects) are eating ‘old’ feed, they may have more 14C than is expected. Certain tissues or isolates from the body are highly retained through slow or incomplete replacement and their lifetimes are estimated from the high levels of 14C concentration, reflecting production and retention from a period of higher atmospheric 14C over the past 40 years [31–34].
Figure 8. Atmospheric 14C concentration as reflected in tree rings and other plant material.
The ‘bomb spike’ of 1963 has become an essential tracing tool for carbon movement throughout oceans, soils, and humans. Predose samples of subject plasma will closely correlate with the atmospheric concentration.
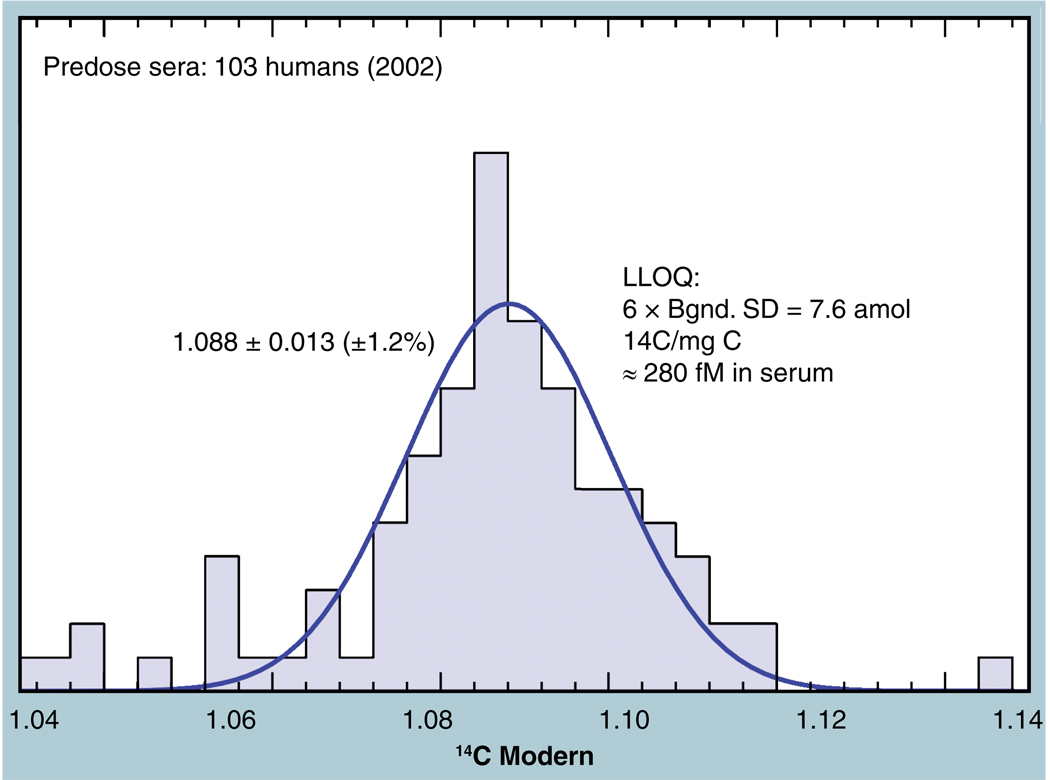
Figure 9 shows the frequency distribution of 14C concentrations in 103 predose human sera taken in 2002 from three different clinical sites. A slight natural variation in human 14C levels is expected and the collection and processing of samples from multiple clinical sites may introduce further variability. The distribution tail toward lower values may well represent chemical or physical incorporation of plastic from the collection tubes. However, the main body of these measurements clusters around 1.08 Modern (open circle, Figure 8) and has a near-normal distribution with a 1.2% CV. The CV of the average of all 103 measurements is 2.4%, although the entire data set is not normally distributed. The high peak at the mean value indicates an even tighter underlying population among the data. Other predose plasma data (solid circle, Figure 8) are taken from a study of folate pharmacokinetics in 13 subjects (both genders, mean age = 24) carried out in 1999–2001, for which the average value was 1.074 ± 0.022 Modern [35]. One subject was studied in a feasibility experiment for the folate study in 1997 and shows the expected higher starting concentration. Finally, six dogs were used in a microdose feasibility study of a candidate compound in early 2003, in which an average predose plasma concentration of 1.0792 ± 0.0098 Modern was measured [36]. These samples are all within the expected 2.5% AMS precision of the atmospheric 14C at the time of collection, indicating that accuracy of AMS quantitation is within the already established precision for moderate amounts of tracer label.
Figure 9. Frequency distribution plot of 14C concentration in blood serum for 103 humans during late 2002 shows a peak at the expected 1.08 Modern with a 1.2% standard deviation in the Gaussian fit.
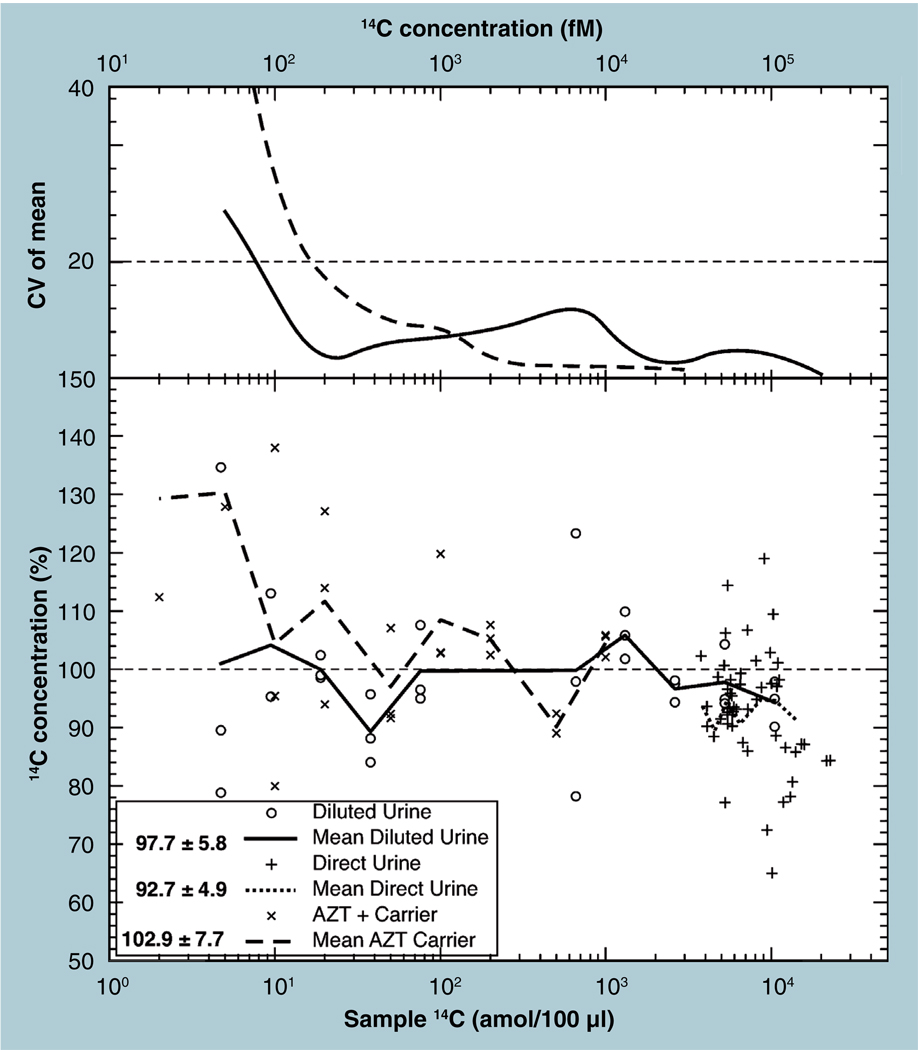
A direct comparison of LSC and AMS counting of high 14C urine samples (90–200 Modern) without using any dilution techniques is shown in Figure 2 and plotted as isotope-label recovery in Figure 10. Accuracy to 93 ± 5% is shown between AMS and the typically accepted LSC data for 100-µl urine samples containing 2–20 fmol of the isotopic label. We already showed AMS repeatability in this range of approximately 1% and expect a total precision of 3–5% for the AMS quantitations, but there are multiple sources for differences between the methods. A volume of urine is combined with scintillant for an LSC measurement and the product is allowed to sit in darkness for several hours to reduce chemical luminescence before counting is carried out. These samples were carefully counted over a long time period using quench and deadtime corrections. AMS samples began with smaller volumes of urine, which were vacuum centrifuged to dryness before combustion to CO2 and reduction to fullerene powder for AMS measurement. The comparison of LSC to AMS requires knowledge of the highly variable carbon concentration of urine, since AMS provides a 14C isotope ratio and LSC measures a 14C content in a volume. Obtaining accurate carbon contents in yet a third aliquot of the urine collection was the most demanding procedure of the comparison. Carbon contents of human urine were found to have a mean at 4 mg/ml, with a 50% spread. The 95% confidence interval spanned from 1.5 to 10.5 mg/ml. Thus, AMS accurately reflected the same level of 14C as LSC in these samples, but the multiple sources of uncertainty leave a large scatter in the data.
Figure 10. Accelerator mass spectrometry (AMS) recovery fractions of labeled compounds in both a biological fluid (urine) and a carrier compound are shown in the lower frame which includes direct comparison of liquid scintillation counting data with the AMS recovery (diamonds) and the dilution of a ‘hot’ urine into further urine (closed circles).
AMS recovery of 14C-atrazine in carrier compound is shown in open circles. The upper frame shows the standard deviation of these data sets as a function as assayed 14C.
The dilution series in urine displayed a 98 ± 6% accuracy for AMS-recovered quantitation in Figure 10, while spiked amounts of 14C-atrazine in tributyrin and tricine carrier aliquots showed a 103 ± 8% accuracy, both from 5 amol to 20 fmol of tracer label. These data are consistent with a 100% accuracy reflected in recovered signal within the measurement errors across a range of 104 in tracer signal.
Overall, the agreement of predose samples with atmospheric concentrations to within a few percent, the 3% agreement of the 9 Modern material, the 2–3% difference between diluted spike, AMS determinations on samples up to 200 Modern and the published accuracy of AMS for carbon dating to better than 1%, demonstrate an accuracy that is better than stated AMS precisions across more than four orders of magnitude for biochemical AMS measurements.
Sensitivity (LOD & LLOQ)
Data are confidently accepted for the intended purpose if they fall above the LOD and if they are quantified above the LLOQ. Two methods can define these limits, one statistical and the other empirical. Multiple measures of the same sample in an AMS provide a Gaussian distribution to a high degree of precision [28] and this paper shows that multiple measures of materials over long periods of time produce Gaussian distributions (Figures 4, 6, 7 & 9) over a variety of 14C concentrations. Statistical methods that assume normal distributions are therefore applicable to the AMS measurement process. AMS, unlike most bioanalytical methods, fufills the homoscedastic assumption that precision of measurement is independent of the analyte concentration. Homoscedasticity arises from the Poissonian statistics of the analysis and from the nature of the background, which is true 14C found in background samples due to natural abundance or to accidental contaminations. These backgrounds are measured to the same desired precision as a low-signal sample, supporting definitions of LOD and LLOQ as 3.3- and ten-times the SD, found from a group of proper background samples [3]. Biochemical AMS measurements generally have one of two possible backgrounds: the natural 14C present in all living materials or the 14C in a diluent or other compound introduced in sample definition and processing.
Figure 3 shows that a preferred carrier compound is 9% Modern carbon and has a standard deviation in routine analyses (~1000 counts 14C) of 0.005 Modern from the 1-µl aliquot, equivalent to 300 zeptomoles 14C. The statistical LLOQ for small amounts of biochemical isolates that are combined with this carrier is 3 amol or approximately 7.5 fg of a 250-g compound that has a 10% isomolar fraction (specific activity = 6.42 Ci/mol). The LOD is 1 amol. Figure 9 shows that people from multiple clinical sites over a multimonth period have a natural 14C concentration quantified to 1.2% (CV). This natural level is approximately 100 amol of 14C per milligram of carbon and an LLOQ of ten-times the 1.2% CV of this background is approximately 12%, or approximately 12 amol in 1 mg of carbon (available from ~20 µl of plasma or 200 µl of urine). The 250-g compound with 10% 14C labeling is thus quantified to a statistical LLOQ of 30 fg in the sample.
Accelerator MS measurements involve more than just isotope quantification: sample collection, storage, transport, separation, dilution and conversion, for example. Figures 4 & 5 show the distributions of multiple measures of 14C in a high- and low-level material. These distributions (as with the human sera in Figure 9) show some non-Gaussian behavior, particularly in the distributions’ tails. Empirically derived LLOQs are compared with statistically derived LLOQ concentrations to investigate the magnitude of contributions from this variety of procedures and matrices. Figure 10 shows the AMS signal-recovery plot for isotopic labels in both urine and carrier compounds, along with the standard deviations of repeated samples at specific dilution or spike levels of grouped measurements in the direct LSC–AMS comparison measurements. These ‘recovery’ percentages are plotted versus the assumed correct level in the top graph of the figure, providing an empirical way to define the LLOQ. If an error of 20% is acceptable in the biochemical measurement, these precisions of repeated measurements yield an LLOQ of 7 amol 14C in the 100-µl urine samples. The unspiked urine dilutant was measured five times, with an average of 1.057 ± 0.019 (1.8%) Modern, suggesting a statistical LLOQ of 15 amol (10 × 0.019 Modern × 97.8 amol/mgC × 4 mg/ml × 0.2 ml). The experimental LLOQ is equivalent to approximately five-times the error in the background in this case, less than the statistical prediction but of the expected order of magnitude.
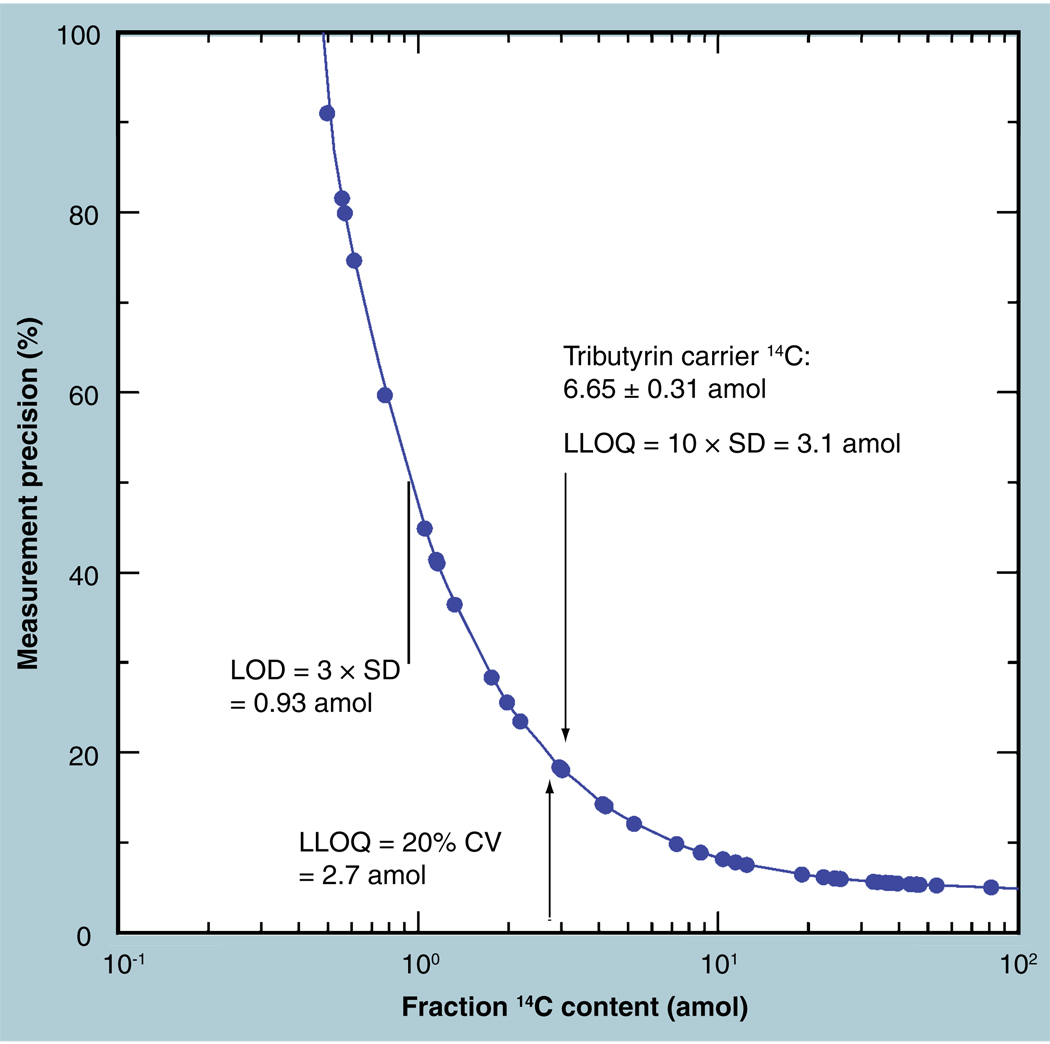
Figure 11 shows the measurement precision versus 14C content of a series of LC fractions collected in a study of a drug’s metabolite profile. Four samples of the carrier averaged 0.111 ± 0.005 (± 3.4% CV) Modern. Ten times the SD of this measurement suggests an LLOQ of 3.1 amol 14C (10 × 0.011 Modern × 97.8 amol/mgC × 0.615 mgC). The error assigned to each fraction measurement is the uncertainty in this carrier background and an assumed uncertainty in the fraction measured (based on the 5.4% reproducibility shown in Figure 4) added in quadrature. We see that the measurement precision reaches 20% at 2.7 amol per fraction, again lower than the statistically predicted LLOQ.
Figure 11. Assigned precision in the quantitation of LC eluent fractions is plotted against the amount of 14C in the fraction.
The carrier carbon had an average value of 0.111 ± 0.005 Modern (3.4%). An uncertainty in the single fraction measure was also assumed at 3.4%.
The LLOQ of the entire AMS measurement process is apparently overestimated by the statistical definition of LLOQ at ten times the background uncertainty, especially when that background is known to be stable and constant across all subjects or separation methods. Extraction of tracer compounds from biological fluids (e.g., SPE and LC) offers better LLOQ (5 vs 8 amol 14C) over direct measurements of the fluid, but only if the background in carrier compounds is routinely measured to high precision. Multiple measurements are also required in separation procedures to show that the isolation technique is quantitative within the desired error, whereas neat biological fluids provide clean, robust measurements from simple combustion, reduction and measurement of the sample. LLOQs are best stated for the quantified tracer isotope, 14C, while individual analyses can convert these to grams of compound by knowing molecular weight and the isomolar fraction of the dosed component.
Contamination
Accelerator mass spectrometry LLOQs extend to attomoles and micro-Bequerels, levels at which many biochemical tracing laboratories would appear havens of potential contamination for samples with 14C. There are procedures that reduce this to a manageable problem in all but the most extreme cases. Such contamination is easily recognized by unexpected outliers that are confirmed with Grubb’s Test (extreme studentized deviate), as shown in Table 1. The confirmed outlier represents a 14C contamination of approximately 250 amol or 0.04 Bq per ml urine in a series of predose collections, a level possibly added by fingerprints or aerosol contact with collection vessels in a clinic, facility or laboratory that handles mega-Bq of labeled compounds.
Table 1.
Measures of predose urines‡
| Value | Z | Significant outlier? |
|---|---|---|
| 1.084 | 0.364 | |
| 1.096 | 0.307 | |
| 1.097 | 0.306 | |
| 1.086 | 0.352 | |
| 1.095 | 0.313 | |
| 1.749 | 2.666 | Significant outlier p < 0.01 |
| 1.083 | 0.370 | |
| 1.085 | 0.357 | |
| 1.099 | 0.297 |
Grubb’s Test showed one significant outlier.
The primary concept in preventing such problems is to establish practices in the laboratory that protect the sample to the best of one’s knowledge (‘Paranoid Lab Practice’ [PLP]) – one changes gloves often, not to protect oneself or to avoid transport of biochemicals, but to avoid contamination to the sample and use only new packs of plasticware from a known source because the clean, empty vessel on the shelf may well have adsorbed volatile 14C over the past week or two, for example. The guiding principle of PLP is that every sample handler must positively know that the container, instrument, solvent and buffer, for example, that is about to come in contact with the present sample is appropriately free of excess 14C. Surfaces (benchtops, sinks and freezer handles) that have excess 14C confirmed by AMS swipe measurements are usable through the epithelial principle, in which surfaces routinely shed a previous layer (e.g., aluminum foil and plastic wrap) only to be covered by a fresh surface that the present handler knows to be clean. The single most contaminating operation in the biochemical laboratory has been the drying of a sample prior to combustion by lyophilization (not reccomended) or vacuum centrifugation. Samples should not be left in these systems any longer than necessary and certain systems are known to perform much better than others (Jouan steel and glass centrifuge chamber coupled to a Unijet drying pump). The PLP practice is not overly onerous and has been repeatedly shown to be the best way to obtain meaningful AMS measurements [24].
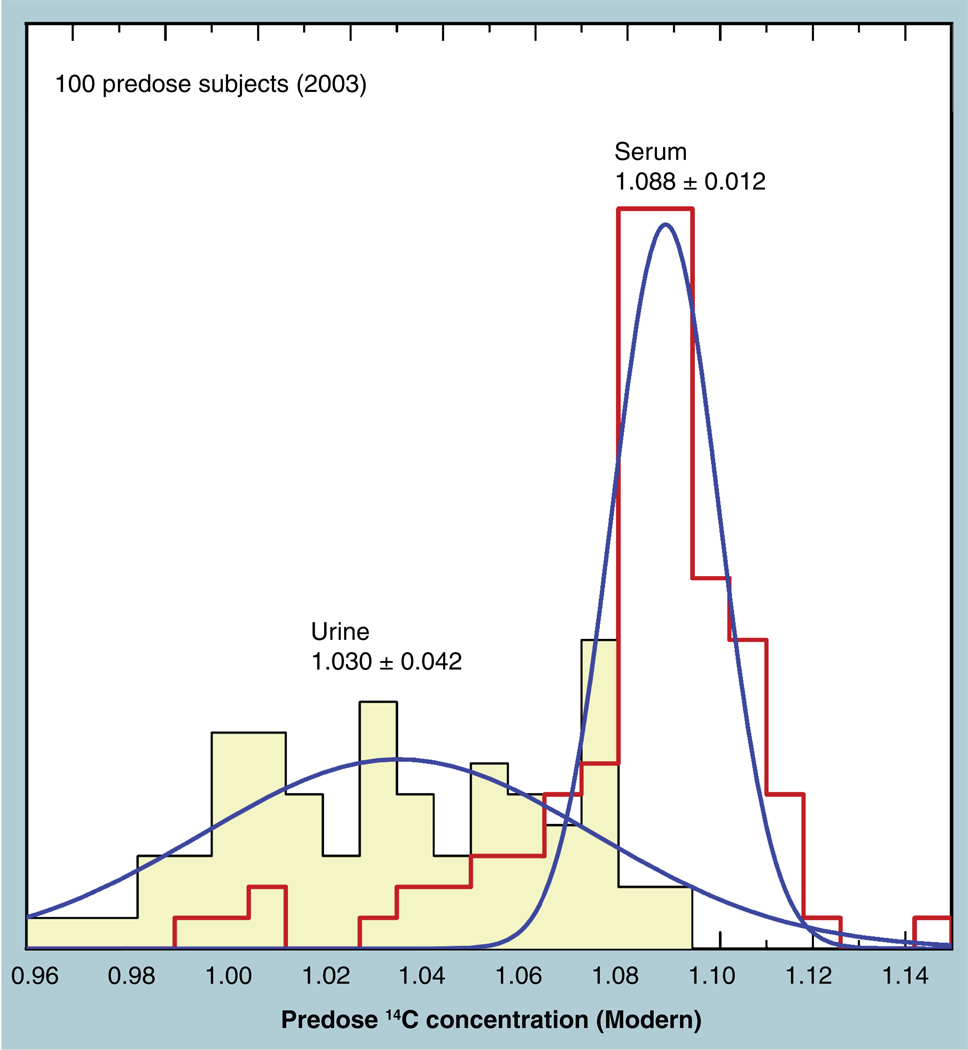
The rare tracer isotope is not the only possible contaminant. Any unplanned addition of carbon to a sample also affects quantitation. One example showed how a nonvolatile buffer was overlooked during LC quantitation [37]. Figure 12 shows the predose 14C content in human plasmas and urine samples collected from several clinical sites. The plasma samples have the expected natural level of 14C to approximately a 1% agreement among subjects, but the urine shows wide 14C levels centered at a lower mean and not normally distributed. The low 14C ratios were traced to the plastic urine collection bottles. A switch to alternate bottles produced urine concentrations that properly matched the plasma levels. Leached plasticizers were not expected in collection products that had been in common use, nor would a benign fluid such as urine be expected to have special capability in leaching plastic. Traces of plastic powder from the injection-molding production process may have been at fault. It is imperative to collect multiple predose samples to test the entire clinic, laboratory and measurement system. The uniformity of 14C within the population is, in fact, a strong diagnostic for errors in proposed clinical procedures or for discovering subjects who may have volunteered in previous tracer studies.
Figure 12. Frequency distributions of 14C concentrations in serum and urine samples of predose human subjects at multiple clinic sites show the expected tight distribution around the atmospheric level for the serum; but urine concentrations are lower with large variability.
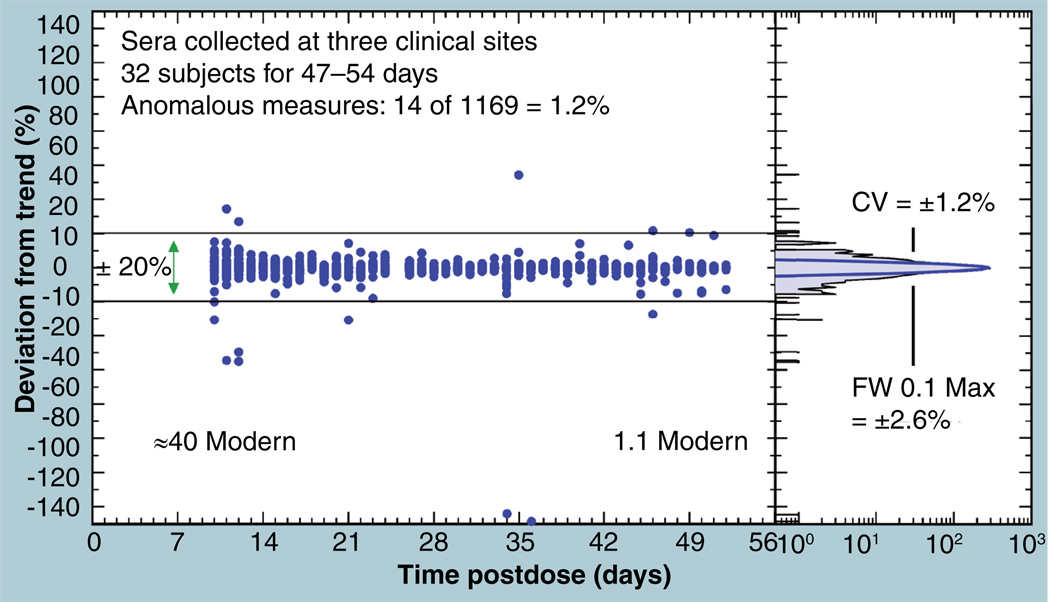
A measure of the likelihood of sample contamination in a routine study was made by comparing individual data points with the interpolated value of neighboring points in the serum kinetic curves of a labeled compound in 32 human volunteers. The sera varied from 40 Modern at 10 days postdose, down to near natural 14C levels (1.1 Modern) at 50 days postdose. Figure 13 shows the percentage deviation of each datum from the value interpolated from the four adjoining data. The overall distribution has a normal core (right panel) with a CV of 1.2% and a full width at 10% maximum of 2.6%, but the tails of the distribution are not normally distributed. Only 14 of the 1169 measures (1.2%) lie more than 20% from the established trend of each person’s data. We note that a majority of the deviant values have lower 14C contents than expected, indicating again that the more likely contamination of a sample has been additional ‘dead’ carbon from fossil sources (presumably from ubiquitous plastic labware). Only one measure had as much as 50% more 14C than expected, showing that procedures are available to keep ‘hot’ samples from contaminating the procedures and instrument.
Figure 13. Devation of data points from the interpolated value of neighboring data from the serum kinetic curves of 32 humans is shown as a function of the time post dose, in which the sera varied from 40 Modern to natural 14C levels.
The right frame shows that the frequency distribution of the deviations has a normal core and enhanced tails. CV: Coefficient of variation.
Quantitative summation
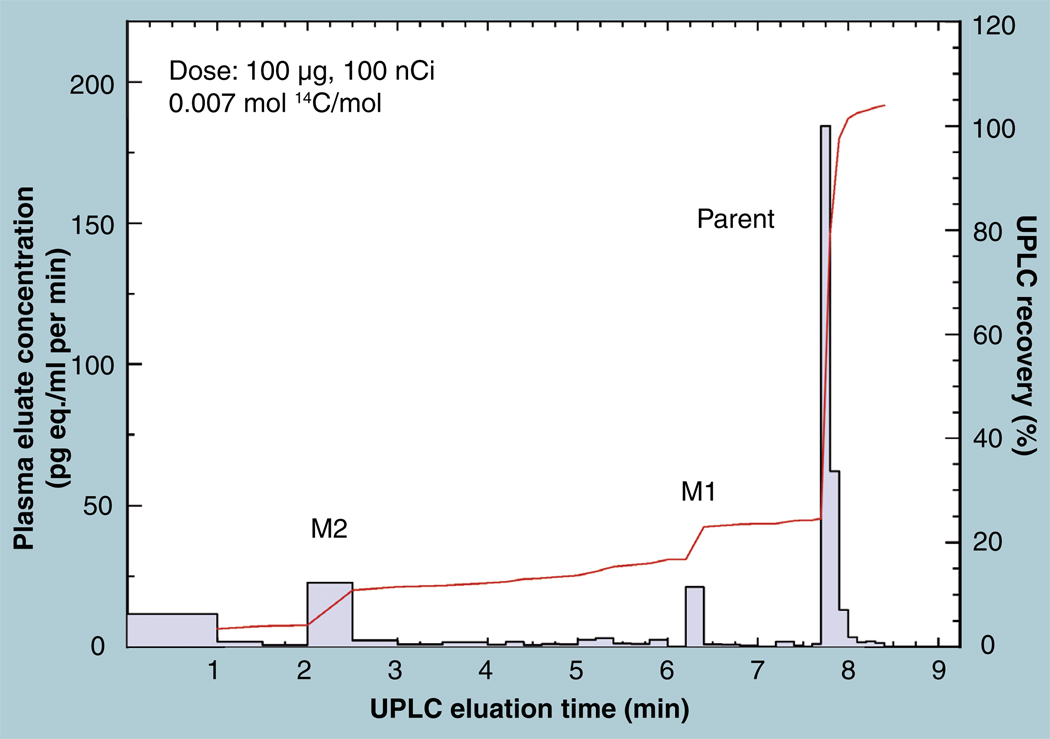
The demonstrated linearity, reproducibility, precision and accuracy of AMS quantitation support the concept of quantitative summation of fractionated samples, allowing for the quantitative comparison of different definition methods [38] and pointing toward any nonquantitative clinical or analytical procedures. A chemical or physical fractionation of a biological material should quantitatively reproduce the tracer concentration in the initial sample. One example is the comparison of the 14C content of a biological fluid and the sum of the fraction 14C contents from a chromatographic separation of the fluid. An example is shown in Figure 14, where the 14C content of a 20-µl sample of the injectate is compared with the separated fractions and the sum of the fractions of a UPLC elution. Quantitative summation such as this assures the analyst that no losses or contaminations occurred during chemical-species definition. A similar robustness in AMS quantitation of gel-separated peptides led to a surprise conclusion that an ester was binding to an enzyme’s active site through covalent attachment to tyrosine instead of the expected lysine [39].
Figure 14. Quantitation of UPLC eluent fractions of a parent compound and its metabolites are shown by the solid line.
The cumulative sum of the quantified fractions (dashed line) is compared with the direct measure of the labeled compound in the injectate. The LLOQ was found as ten-times the uncertainty in the 14C concentration of the added carrier compound.
Discussion
AMS as a complement to other drug-development technologies
Accelerator mass spectrometry provides a highly sensitive, accurate and precise means of determining the 14C/C isotope ratio. Together with the careful measurement or control of the carbon inventory associated with a sample, this provides a highly sensitive means of measuring compound equivalents in a wide variety of matrices – both fluids and tissues, with great reliability and accuracy. This enhanced sensitivity (compared with radiometric means) can extend the range of observation and greatly decrease the radiological exposure, while improving quantitation for nonspecific assays. When coupled to chemical separation, however, AMS becomes a very powerful tool for pharmacokinetic and metabolism analysis for specific compounds.
Pharmacokinetic assays, especially from ‘microdoses’ of specific compounds, are achieved by co-chromatography with an isonormal compound as a molecular carrier introduced in the extraction and/or chromatographic procedures. This allows monitoring of the chromatographic separation by ultraviolet detection (for compounds with chromaphores), while the quantitation relies upon the 14C isotope recovered postcolumn. This approach takes the best of all possible circumstances: high chemical concentration of the analyte is achieved by addition of the isonormal carrier, while sensitivity is achieved by the 14C-labeled analyte, now specific to the compound of interest, but isotopically distinct from the carrier addition.
For analysis of unknowns, most importantly metabolites, a quantitative summation approach should be used. This allows complete characterization and accounting of the 14C, so that the total recovery is known precisely and quantitatively through extraction, reconstitution and chromatography. In this way, the quality and certainty of result (the primary purpose of including 14C as a metabolism tool) is well satisfied. Recoveries greater than 90% of the equivalents of 14C in the matrix are accounted for in the chromatograms, averaging 97 ± 10% (n = 11) in recent separations of both hydrophilic and hydrophobic parent compounds.
Of course, AMS is inherently nonspecific and any molecular identification must be carried out with a companion technology, often by collecting multiple fractions of a given chromatographic peak and determining molecular weights using molecular MS, which is specific to the mass-to-charge ratio. A strong advantage of AMS is that quantification, even independent of chemical identity, is quite reliable and can be used to determine which metabolites should be pursued and which are not of interest.
Conclusion
The measurements presented here were primarily obtained from the Biochemical AMS spectrometer at the Center for AMS at LLNL. This spectrometer was carefully designed for maximal loss-free transmission [40] of ions produced by the uniquely intense LLNL ion source [41] from samples reduced to carbon with a high-throughput process [29]. However, most analytical properties described here arise from the fundamental isotope ratio nature of an AMS measurement on a homogeneous sample and will be applicable to most well-designed and operated AMS spectrometers. In particular, the levels of specificity, stability, linearity, reproducibility and accuracy are shared among spectrometers. The range and LLOQ sensitivity may vary among instruments that have different levels of high-energy mass and charge filtering and different capabilities for quantifying high count rates. The fundamental AMS precision depends on count totals, due to Poisson statistics and, hence, on ion source output, but this is surmountable by longer measurement periods and is not a limiting factor as long as throughput is adequate.
The high C− ion output of the LLNL ion source cannot be analyzed through the entire spectrometer because the intense ion current (100–500 µA) draws down the charging system for the high voltage. Instead, the isotope ratio of 14C/13C is quantified for the accelerated ions and is normalized back to the desired 14C/C ratio. This method has been shown to be precise and accurate to well under 1% [42]. Other AMS spectrometers do quantify accelerated 14C/12C and 13C/12C ratios, which provide further diagnostic capabilities at lower ion intensities, but do not add to any of the validated properties discussed here.
Accelerator mass spectrometry is a uniquely quantitative tool with high specificity, stability, linearity, range, reproducibility, precision, accuracy and sensitivity. It is capable of repeated precise absolute quantitations of the 14C content in a sample containing any 14C-labeled species, without the need for internal standards or calibration curves. Robust AMS quantitation allows direct comparison of labeled compound quantities, independent of processes used in definition and isolation. It frees the analytical chemist from frequent calibration and validation procedures that can be analyte-dependent. AMS sensitivity enables quantitative study of the ADME characteristics of drug candidate compounds directly in humans of all populations, including children, providing the analytical robustness to minimize subject numbers while increasing confidence in clinical ADME/PKPD data. AMS is a superior quantitative tool but must be integrated with other analytical procedures (e.g., LC, LC–MS and NMR) to provide the full picture of human response to chemical entities under study.
Analysis
Linear regressions were performed with GraphPad Instat Software for Macintosh. Grubb tests for outliers were performed with Graphpad web QuickCalcs [101]. Plots and functional fits were done with QuanSoft Pro Fit software for Macintosh [102].
Future perspective
Accelerator mass spectrometry is an isotope-based measurement technology that utilizes 14C-labeled compounds in the pharmaceutical development process to measure compounds at very low concentrations, empowers microdosing as an investigational tool and extends the utility of 14C-labeled compounds to dramatically lower levels. It is a form of isotope-ratio MS that can provide either measurements of total compound equivalents or, when coupled to separation technology such as chromatography, quantitation of specific compounds. The properties of AMS as a measurement technique are investigated here and the parameters of method validation are shown. AMS, independent of any separation technique to which it may be coupled, is shown to be accurate, linear, precise and robust. As the sensitivity and universality of AMS is constantly being explored and expanded, this work underpins many areas of pharmaceutical development, including drug metabolism as well as absorption, distribution and excretion of pharmaceutical compounds, as a fundamental step in drug development.
Executive summary.
-
■
Accelerator mass spectrometry (AMS) provides accurate (93–103% accuracy observed over many sample types, range in isotope ratio, individual experiments and several years of observation), precise (observed imprecisions are 2–5%) and reliable measurements of 14C/C atom ratio that are an essential part of making AMS-based measurements of labeled compounds concentrations in biological matrices as equivalents or as isolated compounds.
-
■
Accelerator mass spectrometry correlates extremely well with conventional measurement of 14C, provided both the comparative technique of liquid scintillation counting is accurately done and the AMS instrument is robustly designed across a wide analytical range, allowing direct comparison of results.
-
■
Accelerator mass spectrometry is very stable over time and the background radiocarbon levels in coincident samples are highly uniform (<3% variation in coincident sample groups).
-
■
When used with appropriate, controlled chemical separations such as UPLC or HPLC, AMS provides the basis for very sensitive (fq-eq/ml), precise quantitations of individual compounds, whether as an identified analyte or as unknown, but quantifiable, metabolites.
Acknowledgments
Some of this work was performed under the auspices of the US Department of Energy by University of California, Lawrence Livermore National Laboratory (LLNL) under Contract W-7405-Eng-48. Colleagues at LLNL who performed work leading to the data shown here include Kurt Haack, Bruce Buchholz, and Darren Hillegonds. Portions of this work were supported by the NIH National Center for Research Resources at the Research Resource for Biomedical AMS (P41-RR013641). Many samples, data, and carbon analyses were done by, or under contract with, Procter & Gamble Pharmaceuticals. Samples, data, and support in composing the manuscript were provided by Vitalea Science (Dr Steve Dueker)
Bradly D Keck is an employee of Vitalea Science (VS), which funds his authorship. Bradly D Keck was an employee of Procter & Gamble Pharmaceuticals during much of this work, who sponsored many of the sample analyses referenced. Ted Ognibene is an employee of Lawrence Livermore National Laboratory and holds a patent licensed by VS but no other financial interests. John S Vogel was an employee of LLNL during much of this work but is now an unpaid advisor to VS and possesses equity in the Company, which licenses several of his patents.
Glossary
- Accelerator mass spectrometry
Isotope ratio MS that measures the atom ratio of a rare isotope (14C in biomedical applications) as compared with the entire element present (14C/C, here)
- Equivalents
Mass of labeled parent compound that is represented by the measured quantity of 14C label, such as ‘nanogram equivalents’
- Isomolar fraction
Quantitative molar relationship between a compound and the 14C it contains
- LC–MS
When a labeled compound is isolated, and only the 14C from that molecule is measured with accelerator mass spectrometry, then the concentration of that molecule can be determined with sensitivity and precision
Footnotes
Financial & competing interests disclosure
The authors have no other relevant affiliations or financial involvement with any organization or entity with a financial interest in or financial conflict with the subject matter or materials discussed in the manuscript. This includes employment, consultancies, honoraria, stock ownership or options, expert testimony, grants or patents received or pending, or royalties.
No writing assistance was utilized in the production of this manuscript.
Bibliography
Papers of special note have been highlighted as:
▪ of interest
▪▪ of considerable interest
- 1.Viswanathan CT, Bansai S, Booth B, et al. Quantitative bioanalytical methods validation and implementation: best practices for chromatographic and ligand binding assays. Pharm. Res. 2007;10:1962–1973. doi: 10.1007/s11095-007-9291-7. [DOI] [PubMed] [Google Scholar]
- 2.US Pharmacopeia. United States Pharmacopeial Convention, Inc. 1994;23:1982–1984. [Google Scholar]
- 3.ICH International Conference on Harmonisation. Draft guideline on validation of analytical procedures: definitions and terminology. Federal Register. 1995;60:11260. [Google Scholar]
- 4.US FDA. Guideline for submitting samples and analytical data for methods validation. 1987 [Google Scholar]
- 5.US FDA. Guidance for industry: Q2B validation of analytical procedures: methodology CDER/CBER. 1996 [Google Scholar]
- 6.Green JM. A practical guide to analytical method validation. Anal. Chem. 1996;68:305–309. [Google Scholar]
- 7.Kutschera W. Progress in isotope analysis at ultra-trace level by AMS. Int. J. Mass Spec. 2005 [Google Scholar]
- 8.Scott EM. The fourth international radiocarbon intercomparison (FIRI) Radiocarbon. 2003;45:135–150. [Google Scholar]
- 9.Damon PE, Donahue DJ, Gore BH, et al. Radiocarbon dating of the Shroud of Turin. Nature. 1989;337:611–615. [Google Scholar]
- 10. Turtletaub KW, Felton JS, Gledhill BL, et al. Accelerator mass spectrometry in biomedical dosimetry: relationship between low-level exposure and covalent binding of heterocyclic amine carcinogens to DNA. Proc. Natl Acac. Sci. 1990;87(14):5288–5292. doi: 10.1073/pnas.87.14.5288.. ▪▪ Shows the ability of accelerator mass spectrometry (AMS) to reveal very low level adducts and to use AMS with elaborate separation techniques to measure covalent adducts resulting from xenobiotic exposure.
- 11.Nelson DE, Mortan RE, Vogel JS, Southon JR, Harrington CR. New dates on northern Yukon artifacts: holocene, not pleistocene. Science. 1986;232(4751):749–751. doi: 10.1126/science.232.4751.749. [DOI] [PubMed] [Google Scholar]
- 12.Vogel JS. Accelerator mass spectrometry for quantitative in vivo tracing. Biotechniques. 2005;38:25–29. doi: 10.2144/05386su04. [DOI] [PubMed] [Google Scholar]
- 13. Vogel JS, Love A. Quantitating isotopic molecular labels with AMS. Methods Enzymol. 2005;402:402–422. doi: 10.1016/S0076-6879(05)02013-6.. ▪▪ Key reference to AMS quantitation and calculations.
- 14.Turteltaub KW, Vogel JS. Bioanalytical applications of accelerator mass spectrometry for pharmaceutical research. Curr. Pharm. Des. 2000;6(10):991–1007. doi: 10.2174/1381612003400047. [DOI] [PubMed] [Google Scholar]
- 15.Lappin G, Garner RC. Big physics, small doses: the use of AMS and PET in human microdosing of development drugs. Nat. Rev. Drug Discov. 2003;2:233–240. doi: 10.1038/nrd1037. [DOI] [PubMed] [Google Scholar]
- 16.Wilding IR, Bell RA. Improved early clinical development through human microdosing studies. Drug Discov. Today. 2005;10:890. doi: 10.1016/S1359-6446(05)03509-9. [DOI] [PubMed] [Google Scholar]
- 17.Stuiver M, Polach H. Discussion: reporting of 14C Data. Radiocarbon. 1977;19:355–363. [Google Scholar]
- 18.Vogel JS. Rapid production of graphite without contamination for biomedical AMS. Radiocarbon. 1992;34:344–350. [Google Scholar]
- 19.Freeman SPHT, Vogel JS. Biomedical accelerator mass spectrometry. Int. J. Mass Spec. Ion Process. 1995;143:247–256. [Google Scholar]
- 20.Liberman RG, Tannenbaum SR, Hughey BJ, et al. An interface for direct analysis of 14C in nonvolatile samples by accelerator mass spectrometry. Anal. Chem. 2004;76(2):328–334. doi: 10.1021/ac030181y. [DOI] [PubMed] [Google Scholar]
- 21.Choi MH, Skier PL, Wishnok JS, Tannenbaum SR. Characterization of testosterone 11β-hydroxylation catalyzed by human liver microsomal cytochromes P450. Drug Metab. Dispos. 2005;33:714–718. doi: 10.1124/dmd.104.003327. [DOI] [PubMed] [Google Scholar]
- 22.Guilderson TP, Reimer PJ, Brown TA. Geoscience: boon and bane of radiocarbon dating. Science. 2005;307(5108):362–364. doi: 10.1126/science.1104164. [DOI] [PubMed] [Google Scholar]
- 23.Vogel JS, Southon JR, Nelaon DE, Brown TA. Performance of catalytically condensed carbon for use in accelerator mass spectrometry. Nucl. Inst. Meth. 1984;B5:289–293. [Google Scholar]
- 24.Buchholz BA, Freeman SPHT, Haack KW, Vogel JS. Tips and traps in the 14C bio-AMS preparation laboratory. Nucl. Instrum. Methods Phys. Res. B. 2000;172:404–408. [Google Scholar]
- 25.Garner RC, Barker J, Flavell C, et al. A validation study comparing accelerator MS and liquid scintillation counting for analysis of 14C-labelled drugs in plasma, urine and fecal extracts. J. Pharm. Biomed. Anal. 2000;24:197–209. doi: 10.1016/s0731-7085(00)00397-6. [DOI] [PubMed] [Google Scholar]
- 26.Polach HA. A sucrose standard for 14C dating. In: Berger R, Suess H, editors. Proceedings of the 9th International Conference on Radiocarbon; Berkeley/Los Angeles, CA, USA. UC Press; 1979. pp. 115–124. [Google Scholar]
- 27. US FDA. Guidance for industry: safety testing of drug metabolites. CDER. 2006. ▪ Central regulatory guidance in the USA for identifying and quantifying metabolites.
- 28.Vogel JS, Ognibene TJ, Palmblad M, Reimer P. Counting statistics and ion interval density in AMS. Radiocarbon. 2004;46(3):1103–1109. [Google Scholar]
- 29. Ognibene TJ, Bench G, Vogel JS, Peaslee GF, Murov S. A high-throughput method for the conversion of CO2 obtained from biochemical samples to graphite in septa-sealed vials for quantification of 14C via accelerator mass spectrometry. Anal. Chem. 2003;75(9):2192–2196. doi: 10.1021/ac026334j.. ▪ Reference procedure for conversion of carbon dioxide to graphite suitable for AMS measurement and efficient production.
- 30.Milton GM, Kramer SJ, Milton JCD. Interlaboratory comparisons of C-14 measurements in milk and vegetation. Radiocarbon. 1998;40:299–311. [Google Scholar]
- 31.Shapiro SD, Endicott SK, Province MA, Pierce JA, Campbell EJ. Marked longevity of human lung parenchymal elastic fibers deduced from prevalence of d-aspartate and nuclear weapons-related radiocarbon. J. Clin. Invest. 1991;87(5):1828–1834. doi: 10.1172/JCI115204. [DOI] [PMC free article] [PubMed] [Google Scholar]
- 32.Spalding K, Bhardwaj RD, Buchholz B, Druid H, Frisén J. Cell. 2005;122:133–143. doi: 10.1016/j.cell.2005.04.028. [DOI] [PubMed] [Google Scholar]
- 33.Bhardwaj RD, Curtis MA, Spalding KL, et al. Neocortical neurogenesis in humans is restricted to development. Proc. Natl Acad. Sci. USA. 2007;103(33):12564–125648. doi: 10.1073/pnas.0605177103. [DOI] [PMC free article] [PubMed] [Google Scholar]
- 34.Spalding K, Arner E, Westermark PO, et al. Dynamics of fat cell turnover in humans. Nature. 2008;453(7192):169. doi: 10.1038/nature06902. [DOI] [PubMed] [Google Scholar]
- 35.Lin Y, Dueker SR, Follett JR, et al. Quantitation of in vivo human folate metabolism. Am. J. Clin. Nutr. 2004;80(3):680–691. doi: 10.1093/ajcn/80.3.680. [DOI] [PubMed] [Google Scholar]
- 36.Sandhu P, Vogel JS, Rose MJ, et al. Evaluation of microdosing strategies for studies in preclinical drug development: demonstration of linear pharmacokinetics in dogs of a nucleoside analog over a 50-fold dose range. Drug Metab. Dispos. 2004;32(11):1254–1259. doi: 10.1124/dmd.104.000422. [DOI] [PubMed] [Google Scholar]
- 37.Miyashita M, Priestley JM, Buchholz BA, et al. Attomole level protein sequencing by Edman degradation coupled with accelerator mass spectrometry. Proc. Natl Acad. Sci. USA. 2001;98:4403–4408. doi: 10.1073/pnas.071047998. [DOI] [PMC free article] [PubMed] [Google Scholar]
- 38.Palmblad M, Vogel JS. Quantitation of binding, recovery and desalting efficiency of peptides and proteins in solid phase extraction micropipette tips. J. Chromatogr. B. 2005;814:309–313. doi: 10.1016/j.jchromb.2004.10.052. [DOI] [PubMed] [Google Scholar]
- 39.Bennett JS, Hillegonds DW, Buchholz BA, Kwok ESC, Vogel JS, Morton TH. Accelerator mass spectrometry for assaying irreversible covalent modification of an enzyme by acetoacetic ester. Int. J. Mass Spec. 2000;179–180:185–193. [Google Scholar]
- 40.Ognibene TJ, Brown TA, Knezovich JP, Roberts ML, Southon JR, Vogel JS. Ion-optics calculations of the LLNL AMS system for biochemical 14C measurements. Nucl. Instrum. Methods Phys. Res. B. 2000;172(1–4):47–51. [Google Scholar]
- 41.Brown TA, Roberts ML, Southon JR. Ion-source modeling and improved performance of the CAMS high-intensity Cs-sputter ion source. Nucl. Instrum. Methods Phys. Res. B. 2000:172. [Google Scholar]
- 42.Gorbarenko SA, Khusid TA, Basov IA, Oba T, Southon JR, Koizumi I. Glacial Holocene environment of the southeastern Okhotsk Sea: evidence from geochemical and palaeontological data. Palaeogeogr. Palaeoclimatol. Palaeoecol. 2002;177(3):237–263. (27) [Google Scholar]
Websites
- 101.GraphPad Software. www.GraphPad.com.
- 102.QuantumSoft. www.quansoft.com.


