

Abstract
In optimal foraging theory, search time is a key variable defining the value of a prey type. But the sensory-perceptual processes that constrain the search for food have rarely been considered. Here we evaluate the flight behavior of bumblebees (Bombus terrestris) searching for artificial flowers of various sizes and colors. When flowers were large, search times correlated well with the color contrast of the targets with their green foliage-type background, as predicted by a model of color opponent coding using inputs from the bees' UV, blue, and green receptors. Targets that made poor color contrast with their backdrop, such as white, UV-reflecting ones, or red flowers, took longest to detect, even though brightness contrast with the background was pronounced. When searching for small targets, bees changed their strategy in several ways. They flew significantly slower and closer to the ground, so increasing the minimum detectable area subtended by an object on the ground. In addition, they used a different neuronal channel for flower detection. Instead of color contrast, they used only the green receptor signal for detection. We relate these findings to temporal and spatial limitations of different neuronal channels involved in stimulus detection and recognition. Thus, foraging speed may not be limited only by factors such as prey density, flight energetics, and scramble competition. Our results show that understanding the behavioral ecology of foraging can substantially gain from knowledge about mechanisms of visual information processing.
Keywords: vision, detection, Bombus terrestris, ultraviolet, neuronal channel
Choosing flower types that involve minimal search times is critical in flower visitors for several reasons. Flight is energetically the most costly activity in insects (1), and even though pollinating insects often operate at the limit of sustaining their flight activity, their fitness depends on the surplus forage brought home to provision their young (2, 3). Most flowers offer only small quantities of nectar reward, to keep pollinators moving between plants and so maximize pollen transfer. Activities of many competing flower visitors further reduce those rewards. Bees have been widely used to study foraging decisions, and behavioral ecologists have made intriguing predictions on how pollinators should behave in complex situations where flowers of different species differ in detectability (4). But the perceptual dimensions that underlie search times, and the floral parameters involved, have been little addressed. Possibly for this reason, predictions of optimal foraging theory are often inconsistent with observations of natural foraging behavior (5–8). In our experiments, we attempted to identify the neuronal channels used in the natural approach of bees toward a flower. We also evaluated the bees' flight behavior to see whether the temporal limitations imposed by the underlying neural processes could account for the bees' observed searching strategy.
To estimate the color contrast a flower makes with its background, which is critical for its detectability, we need to know the color receptor types of the animal in question, and we need a model to predict how color difference is computed on a neuronal level. Most species of bees have three color receptor types, most sensitive in the UV, blue, and green parts of the spectrum (9, 10). The responses from these are evaluated by two color opponent processes, and bees appear to ignore brightness cues when identifying flowers (11, 12).
The spatial resolution of bee vision is not only limited by the interommatidial angle [which should allow for a resolution of about 2.8° in the vertical and 5.4° in the horizontal direction in honeybees (13, 14) and of about 5° in bumblebees (15)], but also by subsequent processing. When a target subtends at least 5° (and no more than 15°), honeybees use green contrast, i.e., the difference in signal provided by the green receptor between background and target, for detection. The receptive fields of color coding neurons are comparatively large, so that an area of 15° (equivalent to 59 ommatidia of its compound eye; ref. 16) must be subtended for a honeybee to identify a flower by its color. Thus from a distance of 1 m, a flower must be 26 cm in diameter so that a bee can recognize its color or to detect a flower by using color contrast! In this view, flowers would inevitably be first detected by using the green signal as the bee approaches a flower, unless it moves toward very near flowers whose visual angle exceeds 15° at the start of the flight (16, 17).
These results, however, were obtained with bees making choices at a constrained distance from the target (the fork of a Y-maze), and under the assumption that both the bee and the target were stationary. Times to make a choice, which are crucial in foraging, were not recorded. When the bee is in motion, as during natural foraging, temporal constraints of the respective neuronal channels might become relevant for the detection process. As a bee moves across a meadow with flowers, the contrast each flower makes with its background is reduced, and spatial resolution also decreases (18). With increasing flight speed, the amount of time a flower passes through the receptive field of a visuo-neuronal channel is reduced. Beyond a critical speed, this time window may be too short for the flower to be resolved by the temporal sensitivity of a receptor or neuronal channel, and the bee may fail to detect the object. In experiments with flickering stimuli, Srinivasan and Lehrer (18) concluded that a bee needs 10 ms to compute the color of an object. The green receptor channel, which also drives the bees' movement avoidance response, has been reported to have about half that integration time, which appears to be close to the photoreceptors' temporal resolution (19). Whether these limitations apply when a single target suddenly appears in the visual field of a bee, and moves across the retina, is unknown.
Materials and Methods
Flight Arena and Flowers.
All experiments were performed with individually marked bumblebee workers from four different Bombus terrestris colonies. The colonies were housed in wooden nest boxes, connected to a flight arena with a plastic tube. The flight arena measured 120 × 100 × 35 cm. It was covered with a UV-transparent Plexiglas cover. The floor consisted of two layers of plastic boards. The upper board was colored green (for spectral reflection see Fig. 1), was 1 mm thick, and was punctured with 575 holes in 25 rows and 23 columns, 2 mm in diameter, and 4 cm apart. The lower board contained an equal number of holes, 4 mm in diameter at the same positions as in the upper board. Small plastic caps for sugar solution with a maximum volume of 50 μl could be placed into the wells in the lower board. Artificial flowers were made of round pieces of Plexiglas 1 mm thick with a central hole (∅ = 1 mm), painted with pigment colors. We used seven flower colors (see below) and five flower sizes with diameters of 5, 8, 15, 22, and 28 mm. The two smallest sizes did not have holes, but were placed so that the holes with rewards were placed directly adjacent to the stimuli.
Figure 1.

Color stimuli used in our study. (a) Spectral reflection curves of the artificial flowers and background. (b) Color loci of the stimuli in the color hexagon. The color space inside the central circle (< 0.1 hexagon units) appears achromatic for the bees. Colors for humans: 1, yellow; 2, UV-absorbing white; 3, blue; 4, turquoise; 5, red; 6, UV-reflecting white; 7, lemon.
Color Analysis.
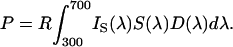
Spectral reflectance functions of the stimuli and the background was measured by using a spectrometer (Ocean Optics, Dunedin, FL, S2000 with a deuterium/halogen light source). The color parameters (relative excitation values in the bees' UV, blue, and green receptors, color contrast, green contrast, and brightness; Table 1) were calculated according to Backhaus (11) using the color hexagon (Fig. 1; ref. 20); for alternative models, see Vorobyev and Brandt (12). The relative amount of light absorbed by each photoreceptor color type is:
 |
1 |
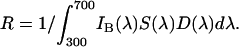
IS(λ) is the spectral reflectance function of the stimulus; S(λ) is the spectral sensitivity function of the receptor [we used the functions of Peitsch et al. (21) for the B. terrestris UV, blue, and green receptors]. D(λ) is the illuminant (in our case, a standard neon light filtered through the Plexiglas cover combined with natural daylight). The sensitivity factor R in Eq. 1 is determined by:
 |
2 |
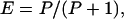
IB(λ) is the spectral reflection function of the background to which the receptors are adapted (Fig. 1). With this model, it is assumed that the photoreceptors display half their maximal response when stimulated by the light reflected from the adaptation background. When the maximum excitation Emax of the photoreceptors is normalized to 1, the photoreceptor excitation can be described by
 |
3 |
where P is the stimulus strength (Eq. 1), in units such that for P = 1, E = 0.5 [i.e., half the maximum potential; for details see Backhaus (11) and Vorobyev and Brandt (12)]. Thus, for the adaptation background, E equals 0.5 in each photoreceptor. Green contrast, then, is the degree to which any given stimulus generates an excitation value different from 0.5 in the green receptor. Because excitation can range from 0 to 1, the maximum green contrast is 0.5. Stimulus brightness is defined as the sum of all three photoreceptor excitations, so it can have any value from 0 to 3. Because the background, by our definition, has a brightness of 1.5, brightness contrast can have any value up to 1.5.
Table 1.
Color properties of the artificial flowers
| Color | Distance to background, hexagon units | Brightness contrast | Green contrast |
|---|---|---|---|
| UV-absorbing white | 0.16 | 0.87 | 0.33 |
| Blue | 0.23 | −0.22 | −0.16 |
| Yellow | 0.35 | −0.07 | 0.21 |
| Lemon | 0.31 | 0.31 | 0.30 |
| Turquoise | 0.10 | 0.32 | 0.08 |
| Red | 0.06 | −0.94 | −0.29 |
| UV-reflecting white | 0.07 | 0.77 | 0.26 |
Color distance is measured in hexagon units, brightness as the sum of the excitations of all three receptor types after adaptation to background, and green contrast as the specific excitation of the green receptor. In the analysis the absolute values of green contrast and brightness contrast were used.
For calculation of hexagon color loci from receptor excitation values, see ref. 20. Color distance in the color hexagon is correlated with the degree to which two stimuli are perceived as differently colored. The background color locus lies in the center of the color hexagon. Distance from the center to any of the hexagon's corners is unity. Therefore, color contrast of a given stimulus with its backdrop can range from 0 to 1.
Experimental Procedures.
Before the experiments, bees were allowed to familiarize themselves freely with the arena and to feed from transparent plastic dishes containing 1 M sucrose solution. Before experiments, bees were not exposed to colored targets. During an experiment, only one bumblebee at a time was allowed to enter the arena. During a search bout (a round trip from the nest to the flowers and back), we offered three flowers in the flight arena. The flowers were arranged in an equilateral triangle with a side length of 30 cm. Each flower disk was positioned exactly above a hole in the floor, filled with 30 μl of 1.5 M sucrose solution. In each bout the triangle was randomly arranged on the floor, and the flowers were cleaned with 30% alcohol after each visit to eliminate scent marks by bees. The floor was cleaned in the same way after every third bout (22).
An experiment started by training a single bee to search for the flowers and feed on the sugar solution provided by the cap under each flower. Each bee was tested on one color only, but on different flower sizes. During the training phase, we presented the largest size (28 mm in diameter) for 15 bouts. The subsequent test phase for the 28-mm flowers comprised five foraging bouts. After that we reduced the size for the next six bouts, and then reduced it further. We did not evaluate the first bout of each new size to exclude phases when bees first familiarized themselves with a new foraging situation. In each bout we measured the search time from entering the flight arena until landing on the third flower excluding the feeding times. To reduce high variation in search time due to different distances between the arena entrance and the first flower, we used only search times between flowers. We also excluded the time between the second and the third flower, because bees sometimes returned to the first flower. We tracked the bees' behavior by using the computer program observer, which allowed us to record behavioral observation data with defined push-button combinations on a laptop.
In the first experiment, we determined how flower size affected search time. Each of six bees was tested on blue flowers of five sizes (28, 22, 15, 8, and 5 mm in diameter) in descending order. For all sizes and for each bee, we calculated the mean search time between the first and the second flower of all five bouts.
In our second experiment, we tested the influences of color properties on search time. We trained bees of seven groups to forage on one color of flower each. The flowers had the colors blue (bee-blue), yellow (bee-green), red (bee-uncolored), turquoise (bee-blue), UV-reflecting white (bee-uncolored), lemon (bee-green), and UV-absorbing white (bee-blue-green). The bees were tested on three flower sizes (28, 15, and 8 mm) in a descending order. For the UV-absorbing white flowers, we also tested the effect of flower size on flight speed and height for three flower sizes (28, 15, and 8 mm). The final foraging bout on each floral size was videotaped. The flight path was recorded by a digital camera (Sony DCR-VX 1000E, 25 frames/s) from the side of the arena through a transparent Plexiglas sheet. Because one camera was used it was only possible to measure velocity in the vertical x-y plane. Using this method, the recorded velocity and flight height of a bumblebee on a videotape depends on the distance between the bee and the camera lens. Therefore, we evaluated only videotape sequences during which the bee flew in a defined distance to the camera. We mounted a light-emitting diode in front of the camera. The experimenter observed the flying bee from above and switched the diode on when the bee was flying above a defined area that had been marked on the arena floor. This area had the shape of a narrow strip of the arena floor (10 cm width, but covering the entire width of the arena). The strip was arranged perpendicular to the direction in which the camera was pointing; its distance to the camera was 60 cm. We excluded all recordings 1 s before and after landing on a flower to avoid confounding search behavior and landing maneuvers. For each bee and floral size we obtained a mean number of 195 frames (32 to 384) of the flight paths within the marked area. This method enabled us to assess the real mean velocity (assuming that the velocity in the x-y plane is equal to the velocity in the x-z plane) and to determine differences between foraging flights for various flower sizes. For digitizing and analyzing video recordings, we used a computer-based video analysis system (winanalyze).
Results
A decrease in flower size prompted a drastic increase in search time, from 10.4 s ± 8.5 s at a size of 28 mm to 124.3 s ± 86.0 s at 5-mm size (Fig. 2). Overall, search time is highly negatively correlated with size (Spearman rank test: rs = −1.0, P < 0.0001, n = 5). For the bees, it is substantially harder to detect the smaller flowers. Such flowers involve longer search times and thus lower foraging efficiency.
Figure 2.

Search time for detecting blue flowers of various sizes. Same letters indicate no significant differences (Wilcoxon-matched-pairs test); mean ± SE; n = 7; P < 0.05.
For the tested flower sizes of 28, 15, and 8 mm diameter, mean search time differs significantly among flower colors (Kruskal–Wallis H test: 28 mm, H = 16.3, P < 0.01; 15 mm, H = 23.6, P < 0.001; 8 mm, H = 12.8, P < 0.05). For large flowers, search time ranges from 2.0 s (lemon flowers) to 14.2 s (red flowers) or even 21.7 s (UV-reflecting white flowers; Table 2). For small flowers search times are more than doubled, ranging from 15.4 s (lemon flowers) to 46.1 s (turquoise flowers). The mean search times for each color and size are plotted in Fig. 3 as a function of color contrast and green contrast provided by the flowers. For large flowers, Spearman's rank test reveals a significant negative correlation between search time and color contrast (rs = −0.93, P < 0.01, n = 7). No correlation with the achromatic properties brightness (rs = −0.71, P = 0.08) or green contrast (rs = −0.11, P = 0.82) was found. The same picture is obtained for the medium flower size (color contrast: rs = −0.86, P < 0.05; brightness contrast: rs = 0.64, P = 0.12; green contrast: rs = −0.32, P = 0.48). This means that with an increase in color contrast, search time decreases.
Table 2.
Mean search times for flowers of different colors and sizes
| Color | N of bees | 28-mm diameter
|
15-mm
diameter
|
8-mm diameter
|
|||
|---|---|---|---|---|---|---|---|
| Search time, s | SE | Search time, s | SE | Search time, s | SE | ||
| UV-absorbing white | 9 | 11.8 | 1.4 | 17.4 | 2.5 | 26.2 | 4.9 |
| Blue | 6 | 10.4 | 3.9 | 15.1 | 3.5 | 44.4 | 9.3 |
| Yellow | 5 | 9.7 | 3.3 | 9.5 | 2.0 | 45.0 | 11.9 |
| Lemon | 5 | 2.0 | 0.9 | 6.3 | 1.5 | 15.4 | 5.0 |
| Turquoise | 7 | 13.3 | 3.7 | 31.1 | 5.5 | 46.1 | 11.4 |
| Red | 9 | 14.2 | 2.3 | 29.2 | 4.4 | 42.3 | 8.1 |
| UV-reflecting white | 5 | 21.7 | 4.3 | 28.7 | 9.3 | 41.8 | 7.0 |
Time was measured from leaving the first flower to landing on the second flower.
Figure 3.

Relation between search time and color distance (a) and green contrast (b) for the three different flower sizes. Circles indicate 28-mm flower diameter, triangles indicate 15-mm flower diameter, and diamonds indicate 8-mm flower diameter. Significant correlation is indicated by filled symbols and regression lines (for details see text).
An entirely different picture is obtained for small flowers (8 mm). Here, a significantly negative correlation is found between mean search time and green contrast (rs = −0.89, P < 0.01), but no correlation with color contrast (rs = 0.00, P = 1.0) or brightness contrast (rs = −0.36, P = 0.43). For this size, a larger green contrast leads to a shorter search time.
The switch from one neuronal channel to the other is particularly striking when comparing search times in the yellow and UV-absorbing white flowers: yellow flowers exhibit a higher color contrast to the background, but only approximately two-thirds of the amount of green contrast. Bees take longer to search for the large UV-absorbing white flowers (22% longer compared to yellow flowers), suggesting that color contrast is the relevant parameter. But search times are reversed in the small flowers: here they are longer for the yellow flowers (72% longer compared to the white flowers), presumably because bees use green contrast instead of color contrast.
We find a significant decrease in flight height and velocity with decreasing flower size (Fig. 4). The mean flight height drops from 52.0 mm (±15.2) for 28 mm flowers to 26.1 mm (±5.2) for 8-mm flowers. The velocity declines from 208.6 mm/s (±38.8) to 165.1 mm/s (±23.2).
Figure 4.

Flight height (a) and flight velocity in the vertical x-y plane (b) while searching for flowers of different flower sizes (Wilcoxon-matched-pairs test; numbers indicate P level). Mean ± SD; n = 7. ns, not significant.
Discussion
We tested whether the optical properties of a flower, measured as color contrast, green contrast, and size, affect search time and flight behavior of foraging bumblebees. Our results reveal a strong influence of these properties on search time and thus foraging costs. We discuss these findings in the light of optimal foraging behavior.
Floral Color Properties and Detectability.
Both chromatic and achromatic color properties of a flower affect search time, depending on flower size (Fig. 3 and Table 2). In large flowers search time is a function of color contrast, whereas in small flowers it is correlated with green contrast. Consequently, the bees seem to be limited alternatively by chromatic or achromatic features, depending on the visual angle subtended by the flower.
At first glance, these findings are nicely consistent with the results obtained in dual-choice experiments for honeybees (16, 23). In those experiments, bees were trained to discriminate between two objects, providing various visual angles and either chromatic or achromatic contrast or both. When provided with an angle between 5° and 15°, the bees' choice behavior was governed by green contrast. When the angle was >15°, the bees used solely chromatic cues. At close inspection, however, our results are not so easily explained by these earlier findings. As a bee approaches a flower, that flower will inevitably exceed the 5° threshold before the 15° threshold. Therefore, detectability should always be correlated with green contrast, unless such contrast is not available, or unless flowers are extremely close to one another. Identification by color would always happen subsequent to detection by green contrast. Our results indicate that bumblebees use color contrast to detect large flowers. This result is not explicable by the possibility that each flower already subtends more than 15° when seen from the other flowers: from 30 cm away, the largest flower type covers only 5°, even if presented vertically. We suggest that bees may be selectively using color contrast when they expect large flowers and ignore the signal from the green receptor channel. This may enable bees to identify flowers with more certainty, simply because color contrast uses three input variables, whereas green contrast is only defined by one. Thus, bees face a tradeoff between reliable identification and rapid detection, and the relative benefits of both might change depending on floral size. To estimate the theoretical increase in search costs if bees would use the color channel for small flowers, it is useful to consider the size of the area inside, which the bee is able to detect from a given flight height.
Detection Area and Color Recognition Area.
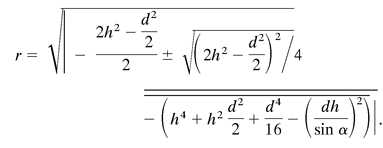
As a bee searches the arena for flowers, the probability of its success does not depend directly on stimulus size. Rather, at any given flight altitude, this probability depends on the likelihood that it enters the area inside which the flower subtends either a visual angle of ≥15° for using the color channel or ≥5° for using the green contrast channel. We will henceforth designate the circular area (with radius = r, see Fig. 5) directly above the flower, inside which detection is possible, as the detection area, and that inside where an assessment of color contrast is feasible, the color recognition area (Fig. 5). Considering the mean flight height (h), the corresponding flower diameter (d), and the minimum visual angle (α) of 5° or 15° respectively, we calculated these areas as follows:
 |
4 |
where
 |
(for explanation see Appendix and Fig. 6, which are published as supplemental material on the PNAS web site, www.pnas.org).
Figure 5.

This sketch illustrates the geometry necessary to calculate the radius of the detection area, r, within which a bee flying at a given height, h, will be able to detect a flower with diameter d, given a resolution of α ≥ 5° (α ≥ 15° for the color recognition area; r = radius of the circular detection area, sin α = visual angle subtended by the flower when the bee is situated at point e).
It follows that the color recognition area (visual angle ≥15° at the bee's eyes) is 91.9 cm2 for 28-mm flowers and 3.6 cm2 for 8-mm flowers. The detection area (a minimum visual angle of 5° is subtended by the flowers) is 352.2 and 50.5 cm2 for 28-mm and 8-mm flowers, respectively. This means that, using color contrast, bees would have to face a roughly 25-fold increase in search times (because the probability of a searching bee to enter the detection area is proportional to its surface) when searching for 8-mm instead of 28-mm flowers. If bees switch from color contrast to green contrast (and thus from a 15° to a 5° receptive field) when searching for smaller flowers, we would expect an increase in search time by only a factor of 1.8, which is almost within the range of factors (1.9 to 4.6) that we empirically determined (Table 2). Note that, while the detection area is always larger than the color recognition area, its relative advantage decreases with floral size. In 28-mm flowers, the color recognition area measures 26% of the detection area, whereas in 8-mm flowers, color contrast can be used only in 7% of the total detection area. We conclude that, with increasing floral size, the increase in search time by using color contrast is compensated by acquiring higher precision of floral recognition.
Flower Size and Flight Behavior.
We showed that the size of an artificial flower strongly affects the time a bee needs to detect this flower (Fig. 2). Two scenarios might explain this increase in search time: (i) The bee's flight height and velocity stay constant while searching for flowers of different sizes. This leads to a reduced detection area. In this case, the probability of a randomly searching bee to enter this area decreases, and thus the time until she detects the object increases. (ii) The bee adapts her flight height to the sought objects in such a way that detection area is maintained constant. Here the detection area becomes larger compared to the first scenario, but the total area scanned by the bee per time decreases. Our results indicate that bees use a strategy that is closer to the second possibility: the bees sacrifice total area scanned per unit time to increase detection area. When the bees search for small flowers, they decrease their flight height from 52 to 26 mm, close to the theoretical height of 15 mm when they would keep the detection area exactly constant.
With a decrease in flower size, flight velocity also decreases. This means that bees forgo even more of area scanned per time, suggesting that temporal constraints play a role in floral detection as well. The results of Srinivasan and Lehrer (18) suggest that bees take about 10 ms to compute the color of an object seen in flight. They concluded that bees flying at a speed of 7 m/s at a height of 2 m can still resolve two objects spaced 12.5 cm apart on the ground.
Can the 10-ms limit explain the strategy used by bees searching for small flowers? Yes. Consider a bee flying at a speed of 30 cm/s at a height of 5.2 cm—these are the values obtained for our bees searching for flowers with ∅ = 28 mm. For a neuron with a receptive field of 5°, this flower would “appear” for 48 ms (and 78 ms for a receptive field of 15°), a value large enough for processing color information. But bees even further reduce their speed when flowers are smaller (23 cm/s for flowers of ∅ = 8 mm). In this case, a flower would appear for 24 ms for a receptive field of 15°, but only for 5 ms for a receptive field of 5°, too short for processing color information!
Hence the bee can rely only on the green contrast for detecting small flowers at a speed of 23 cm/s, or it would have to fly even slower and thus further increase search times. Note that energetic constraints appear to play a marginal role in adjusting foraging velocity: Ellington et al. (24) found that, in bumblebees, energetic expenses are constant over a very large range of flight speeds. Together with our findings, these results suggest that temporal limitations of visual processing are critical to determine the optimal flight speed.
Implications for Studying Foraging Behavior.
Studies of foraging behavior in bees have treated visual cues, such as color and shape, as stimuli with which the bees can associate and discriminate between different rewarding units (6, 25–29). Most of those authors paid attention to the effects of the amount of nectar provided and the density of nectar dispensers, but not the possible effects caused by the cues themselves. We emphasize that, for assessments of the energetic value of a prey type, it is essential to include the costs of detecting this type. In the optimal foraging literature, there is a wide range of papers that deal with optimal foraging speed. As possible factors contributing to adjustments of speed, those papers discuss energetic considerations (30, 31), motivation (32), and scramble competition (33). Our study shows that understanding the mechanisms of visual information processing is also crucial to interpreting optimal search behavior. For example, optimal foraging theory predicts that two flower types with equal nectar rewards, and with equal density, should be chosen equally frequently. Our results do not only show that the net caloric value of a flower type will be fundamentally determined by its color, which has strong effects on search time. More intriguingly, our findings lead to the prediction that the bees' relative preference for flowers of two colors may switch depending on floral size; one floral color may be easier to detect at large size, but the same color may be harder to detect than the other color when flowers are small. This is because different neuronal channels with different spatio-temporal properties are used for detection of large and small flowers. Floral advertising strategies may respond to these perceptual constraints: a strong color contrast with the background (independently of direction) may be favored in large flowers, whereas small flowers should strive to optimize green contrast only.
Supplementary Material
Acknowledgments
For support and critical comments, we thank H. Demmel, M. Lindauer, D. Stübner, A. Weidenmüller, and three anonymous referees. This study was supported by the Deutsche Forschungsgemeinschaft (Grants Ch 147/2–1, Ta 82/8–1, and GRK 200).
References
- 1.Wolf T J, Ellington C P, Begley I S. Insectes Soc. 1999;46:291–295. [Google Scholar]
- 2.Heinrich B. Bumblebee Economics. Cambridge: Harvard Univ. Press; 1979. [Google Scholar]
- 3.Schaffer W S, Jensen D B, Hobbs D E, Gurevitch J, Todd J R, Schaffer V. Ecology. 1979;60:976–987. [Google Scholar]
- 4.Dukas R, Clark C W. Ecology. 1995;76:1320–1326. [Google Scholar]
- 5.Heinrich B. Am Zool. 1983;23:273–281. [Google Scholar]
- 6.Wells H, Wells P, Contreras D. J Apic Res. 1986;25:139–145. [Google Scholar]
- 7.Varjú D, Núñez J. J Comp Physiol A. 1991;169:729–736. [Google Scholar]
- 8.Schmid-Hempel P. J Comp Physiol A. 1993;172:251–256. [Google Scholar]
- 9.Menzel R, Backhaus W. In: Vision and Visual Dysfunction. Gouras P, editor. London: Macmillan; 1991. pp. 123–145. [Google Scholar]
- 10.Chittka L. J Theor Biol. 1996;181:179–196. [Google Scholar]
- 11.Backhaus W. Vision Res. 1991;31:1381–1397. doi: 10.1016/0042-6989(91)90059-e. [DOI] [PubMed] [Google Scholar]
- 12.Vorobyev M, Brandt R. Isr J Plant Sci. 1997;45:103–113. [Google Scholar]
- 13.Autrum H, Wiedemann I. Z Natforsch. 1962;17:480–482. [Google Scholar]
- 14.Eheim W P, Wehner R. Kyberneticke. 1972;10:168–179. doi: 10.1007/BF00290516. [DOI] [PubMed] [Google Scholar]
- 15.Meyer-Rochow V B. J R Soc N Z. 1981;11:123–153. [Google Scholar]
- 16.Giurfa M, Vorobyev M, Kevan P, Menzel R. J Comp Physiol A. 1996;178:699–709. [Google Scholar]
- 17.Lehrer M, Bischof S. Naturwissenschaften. 1995;82:145–147. [Google Scholar]
- 18.Srinivasan M, Lehrer M. J Comp Physiol A. 1985;157:579–586. doi: 10.1007/BF01351352. [DOI] [PubMed] [Google Scholar]
- 19.Srinivasan M, Lehrer M. J Comp Physiol A. 1984;155:297–312. [Google Scholar]
- 20.Chittka L. J Comp Physiol A. 1992;170:533–543. doi: 10.1007/BF00199332. [DOI] [PubMed] [Google Scholar]
- 21.Peitsch D, Fietz A, Hertel H, de Souza J, Ventura D F, Menzel R. J Comp Physiol A. 1992;170:23–40. doi: 10.1007/BF00190398. [DOI] [PubMed] [Google Scholar]
- 22.Chittka L, Williams N M, Rasmussen H, Thomson J D. Proc R Soc London Ser B. 1999;266:45–50. [Google Scholar]
- 23.Giurfa M, Vorobyev M, Brandt R, Posner B, Menzel R. J Comp Physiol A. 1997;180:235–243. [Google Scholar]
- 24.Ellington C P, Machin K E, Casey T M. Nature (London) 1990;347:472–473. [Google Scholar]
- 25.Heinrich B, Mudge P R, Deringis P G. Behav Ecol Sociobiol. 1977;2:247–265. [Google Scholar]
- 26.Real L, Ott J, Silverfine E. Ecology. 1982;63:1617–1623. [Google Scholar]
- 27.Wells H, Wells P H. J Anim Ecol. 1983;52:829–836. [Google Scholar]
- 28.Smithson A, Macnair M R. J Evol Biol. 1996;9:571–588. [Google Scholar]
- 29.Hill P S M, Wells P H, Wells H. Anim Behav. 1997;54:615–627. doi: 10.1006/anbe.1996.0467. [DOI] [PubMed] [Google Scholar]
- 30.Hedenström A, Alerstam T. Proc R Soc London Ser B. 1995;348:471–487. [Google Scholar]
- 31.Kunze J, Chittka L. In: Göttingen Neurobiology Report 1996. Elsner N, Schnitzler H, editors. Stuttgart: Thieme Verlag; 1996. p. 109. [Google Scholar]
- 32.Roces F. Behav Ecol Sociobiol. 1993;33:183–189. [Google Scholar]
- 33.Shaw J J, Tregenza T, Parker G A, Harvey I F. Proc R Soc London Ser B. 1995;260:273–277. [Google Scholar]
Associated Data
This section collects any data citations, data availability statements, or supplementary materials included in this article.