Abstract
Objectives
After an outbreak of severe lung disease among workers exposed to butter-flavoring chemicals at a microwave popcorn plant, we determined whether or not lung disease risk declined after implementation of exposure controls.
Methods
National Institute for Occupational Safety and Health staff performed eight serial cross-sectional medical and industrial hygiene surveys at the plant from November 2000 through August 2003. Medical surveys included standardized questionnaires and spirometry testing. Industrial hygiene surveys measured levels of production-related air contaminants, including butter-flavoring chemicals such as diacetyl. All diacetyl concentrations above detectable limits were corrected for the effects of absolute humidity and days to sample extraction.
Results
Ventilation and isolation of the production process resulted in one to three orders of magnitude reductions in diacetyl air concentrations in different areas of the plant. Workers with past high exposures had stable chest symptoms over time; nasal, eye, and skin irritation symptoms declined. New workers had lower symptom prevalences and higher lung function than workers with past high exposures, and they did not worsen over time. In workers who had at least three spirometry tests, those with past high exposures were more likely to experience rapid declines in lung function than new workers.
Conclusions
Implemented controls lowered exposures to butter-flavoring chemicals and decreased lung disease risk for much of the plant workforce. Some workers with continuing potential for intermittent, short-term peak and measurable time-weighted exposures remain at risk and should use respiratory protection and have regularly scheduled spirometry to detect rapid lung function declines that may be work-related. Close follow-up of such workers is likely to yield additional information on risks due to peak and time-weighted exposure levels.
In May 2000, public health authorities were informed of a cluster of severe cases of bronchiolitis obliterans among former mixers and packaging line workers of a microwave popcorn plant (index plant).1 A cross-sectional medical and environmental survey performed at the index plant by the National Institute for Occupational Safety and Health (NIOSH) in November 2000 linked this outbreak to inhalation exposure to butter flavorings used in the production process.2 The finding of excess airways obstruction among current workers included a striking excess among quality control (QC) workers who performed microwave popping of approximately 100 bags of product per worker per work shift. (Five of six workers had airways obstruction.) Animal exposure studies demonstrated the severe respiratory epithelial toxicity of diacetyl, the chemical in butter flavorings that is primarily responsible for imparting butter flavor.3–5
Given the severe nature of the disease and its potential rapid onset and progression,6,7 it was important to quickly implement exposure controls, assess their effectiveness at lowering exposures, and determine whether workers were protected at the lower exposure levels achieved. After plant management began implementing recommended controls, NIOSH investigators conducted seven follow-up cross-sectional medical and environmental surveys and provided additional recommendations based on analyses of the survey data and what the investigators were learning from evaluations at other microwave popcorn plants.8
In this article, we present the results and limitations of our studies of intervention effectiveness at the index plant based on the surveys performed every four to six months from November 2000 through August 2003.
METHODS
Environmental surveys
We measured full-shift time-weighted average (TWA) diacetyl air concentrations obtained with area and personal sampling using NIOSH Method 2557.9 Relative humidity and temperature were recorded daily in different areas of the plant using an electronic psychrometer. In 2006, NIOSH investigators suspected that Method 2557 underestimated diacetyl concentration in proportion to increasing absolute humidity and days to sample extraction. From 2007 to 2009, NIOSH and Occupational Safety and Health Administration investigators conducted a series of laboratory chamber exposure studies, the results of which were used to derive a procedure to correct diacetyl air concentrations measured with Method 2557.10 This procedure was used to correct all diacetyl concentrations above detectable limits, including the laboratory values between the limit of detection (LOD) and the limit of quantification. For statistical analyses, diacetyl concentrations that were below detectable limits were assigned a value of one-half of the uncorrected LOD in air. A detailed summary of all of the substances measured in the air of the plant during the environmental surveys, the sampling methods used, the uncorrected diacetyl concentrations, and environmental results can be found in the NIOSH Health Hazard Evaluation final report.7
Medical surveys
After obtaining written informed consent approved by NIOSH's Human Subjects Review Board, NIOSH interviewers administered a standardized questionnaire to collect information on symptoms, medical diagnoses, smoking history, work history, and work-related exposures. NIOSH technicians administered spirometry tests to participating workers using a dry rolling-seal spirometer interfaced to a personal computer and following American Thoracic Society guidelines.11 Spirometry results were compared with standard reference values.12 After each survey, we mailed participants letters providing individual test results and interpretations. We recommended medical follow-up, flavoring exposure limitation, and smoking cessation (if appropriate) to individuals with abnormal results and/or evidence of rapid declines in lung function. Additional details on the methods for the medical surveys can be found in the NIOSH Health Hazard Evaluation final report.7
Statistical analyses
We analyzed participants' data according to whether or not they started work at the plant prior to the first NIOSH cross-sectional survey in November 2000 (i.e., before implementation of exposure controls). Group 1 participants included those who started work prior to November 4, 2000 (the last day of the first NIOSH survey). Group 2 participants were those who started work on or after November 4, 2000. Within each of these groups, we further analyzed health status according to history of work in mixing, QC, or maintenance because workers in these jobs, unlike those in packaging line jobs, had potential for intermittent peak exposures.
We compared health outcomes over time within each group and between groups. We used McNemar's test to identify statistically significant differences between prevalences from the first and last surveys. We used Chi-square and Student's t-tests to compare health outcomes data from initial surveys in the two groups. Probability values of p≤0.05 were considered unlikely to be due to chance. To assess the occurrence of abnormally rapid declines in lung function by work area in each group, we identified survey participants who experienced a decline in a forced expiratory volume in one second (FEV1) value of >300 milliliters (ml) and/or 10% from the first (baseline) spirometry test to last spirometry test.13 For this analysis, we excluded participants with fewer than three interpretable spirometry tests, as interpretation of change over time based on only two tests is less reliable. All analyses were generated using SAS® version 9.1.14
RESULTS
Interventions
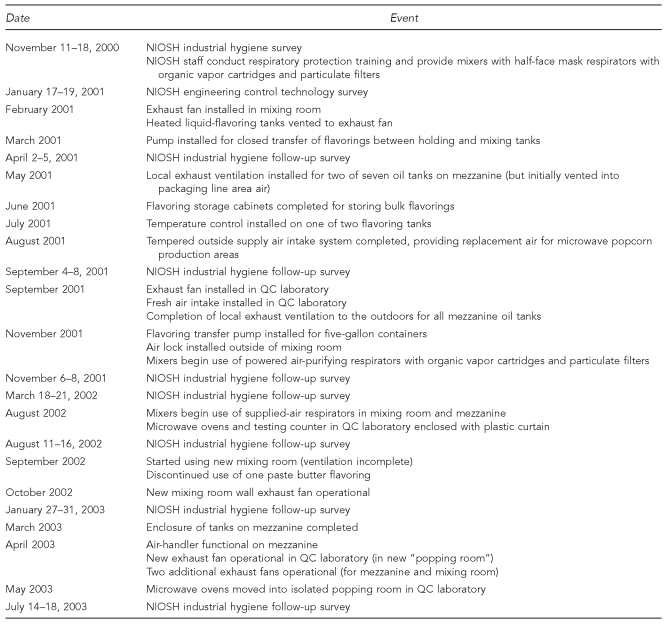
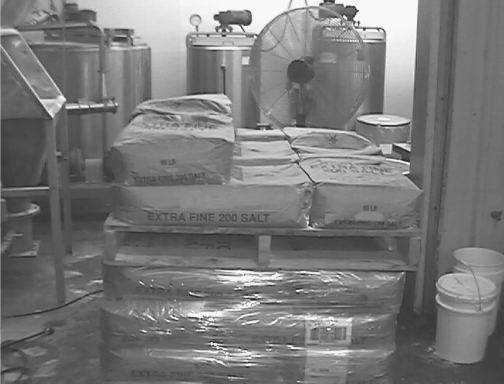
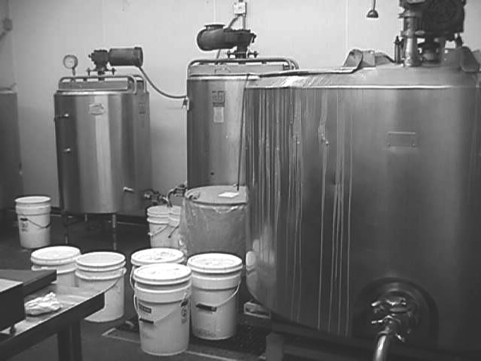
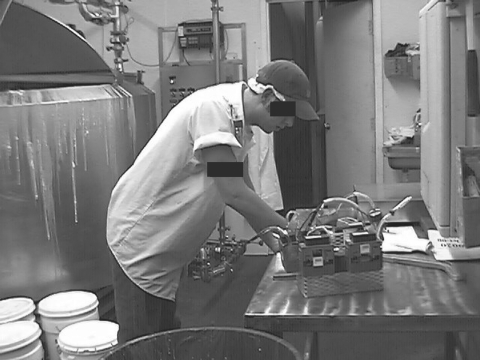
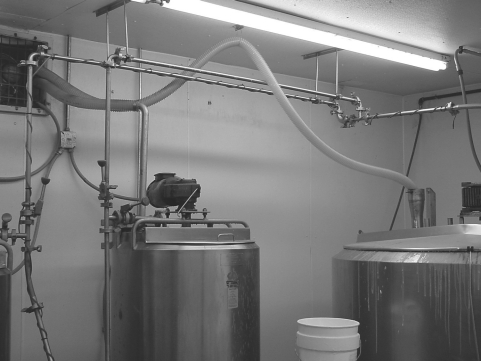
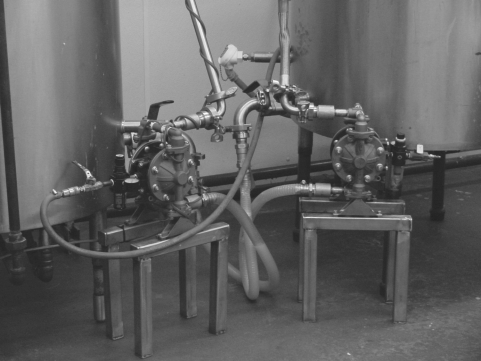
Several controls were implemented to decrease air concentrations of flavoring chemicals in the mixing room, the main source of air contaminants in the plant. The Figure lists the industrial hygiene exposure control interventions by date of implementation. A respiratory protection program for mixing room workers was initiated at the time of the November 2000 NIOSH survey to minimize their exposures while engineering controls were being implemented. An exhaust fan was installed in an outer wall of the mixing room to move contaminated air from this room to the outdoors and maintain this room under negative air pressure relative to the rest of the plant. An air lock was installed at the entrance to the mixing room to further isolate the room from the rest of the plant. Local exhaust ventilation of the air space (headspace) above the contents of the heated flavoring tanks and the mixing tank (where flavorings are mixed into heated soybean oil) was accomplished via ducts connecting the tank lids to the wall exhaust fan. A pump was installed to facilitate closed transfer of heated butter flavorings from the flavor-holding tanks into the mixing tank (Photos 1 through 7). (Prior to this intervention, workers used open five-gallon buckets to manually transfer the heated butter flavorings.) The temperatures of the heated tanks were lowered to decrease evaporation of butter-flavoring chemicals into plant air.
Figure.
Dates of NIOSH industrial hygiene surveys and exposure control interventions in a microwave popcorn plant in Missouri, 2000–2003
NIOSH = National Institute for Occupational Safety and Health
QC = quality control
Photo 1:
The original entrance to the mixing room was open to the packaging line area. Courtesy of the National Institute for Occupational Safety and Health.
Photo 7:
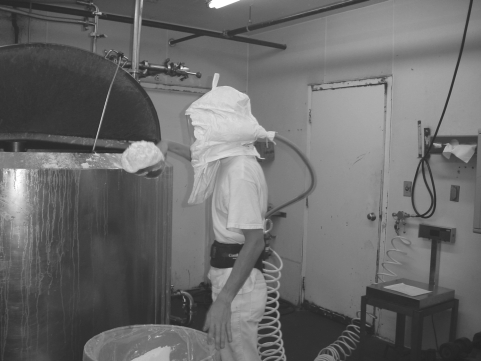
Mixer using supplied-air respirator while manually adding powdered butter flavoring to heated soybean oil in the open mixing tank. Courtesy of the National Institute for Occupational Safety and Health.
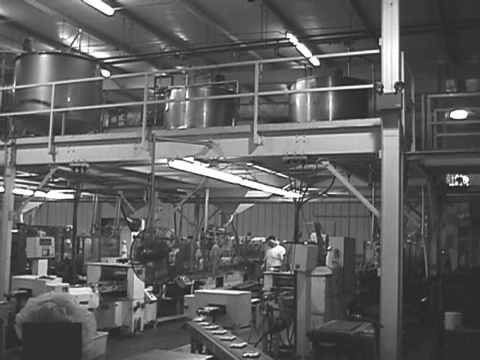
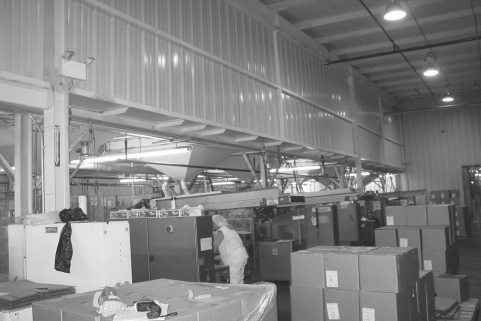
Additional general dilution ventilation was implemented in the microwave popcorn packaging line area. Local exhaust ventilation was implemented for seven heated holding tanks (located on a mezzanine above the packaging lines) that contained soybean oil and butter-flavoring mixtures (transferred via pipes from the mixing room). Eventually, the entire mezzanine was walled off from the packaging line area (Photos 8 and 9).
Photo 8:
Microwave popcorn packaging line area before implementation of exposure controls. Note heated holding tanks for the oil and flavoring mixture located on a mezzanine above the packaging lines. Courtesy of the National Institute for Occupational Safety and Health.
Photo 9:
Mezzanine tank area walled off from the rest of the packaging line area. Courtesy of the National Institute for Occupational Safety and Health.
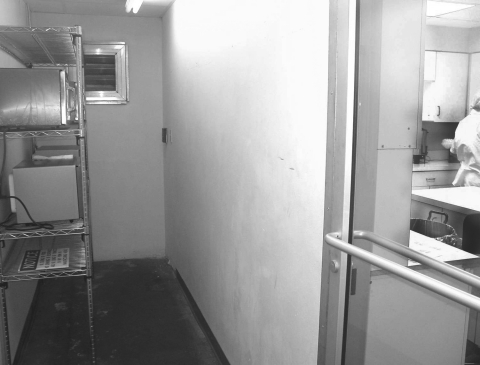
Additional general dilution ventilation was also implemented in the QC laboratory, where workers repeatedly popped product in five microwave ovens. Eventually, all microwave ovens were moved into a separate “popping room” adjacent to the QC laboratory with additional exhaust ventilation (Photos 10 and 11).
Photo 10:
Workers in quality control laboratory before implementation of exposure controls. Courtesy of the National Institute for Occupational Safety and Health.
Photo 11:
Microwave ovens in new “popping room” with additional exhaust ventilation. Courtesy of the National Institute for Occupational Safety and Health.
Effects of engineering controls on diacetyl air concentrations
As exposure controls were implemented, mean TWA diacetyl air concentrations for mixers, machine operators on the microwave popcorn packaging lines, and the QC laboratory workers decreased over time (Table 1). After implementation of exposure controls in the mixing room in 2001, the mean TWA diacetyl air concentration decreased from 57.2 parts per million (ppm) in November 2000 to 2.24 ppm in November 2001. After the company began using a new mixing room in September 2002, the mean TWA diacetyl air concentration in the mixing room was 0.310 ppm in January 2003 and 2.88 ppm in July 2003.
Table 1.
Diacetyl air concentrations in ppm corrected for absolute humidity and days to extraction (area and personal measurements combined) by job category and survey date, in a microwave popcorn plant in Missouri, 2000–2003
aDesignates those diacetyl ranges or means with concentrations below quantifiable limits and provides the estimated, corrected diacetyl concentration for each mean or range.
bLOD designates diacetyl ranges or arithmetic means with concentrations below detectable limits. LOD concentrations could not be corrected for the effects of absolute humidity and days to extraction using the National Institute for Occupational Safety and Health correction equation and, for statistical purposes, a value of one-half of the uncorrected LOD in air was assigned.
ppm = parts per million
LOD = limit of detection
With the additional ventilation in the packaging line area and the isolation of the mixing room, the mean TWA diacetyl air concentration for machine operators on the microwave popcorn packaging lines declined from 2.76 ppm in November 2000 to 0.426 ppm in November 2001. After implementation of the new mixing room in September and October 2002, the mean TWA diacetyl air concentration for machine operators was below quantifiable or detectable levels in July 2003. Similar diacetyl exposure reductions were seen for microwave popcorn packaging line workers in other job categories (e.g., packers and stackers).
After implementation of additional general dilution ventilation in the QC laboratory in September 2001, the mean TWA diacetyl air concentration declined from 0.823 ppm in November 2000 to 0.401 ppm in November 2001. With the additional ventilation and enclosure controls added by July 2003, all diacetyl concentrations in the QC laboratory were below detectable limits.
Follow-up medical surveys
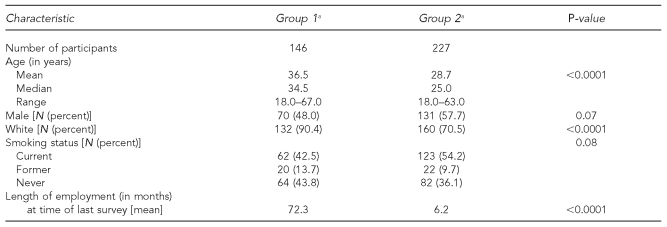
Out of a total of 373 current workers who participated in one or more NIOSH surveys, 146 started work at the plant prior to November 4, 2000 (Group 1), and 227 started work on or after this date (Group 2). Group 2 was younger on average, had higher proportions of male and nonwhite workers, and had shorter employment durations (Table 2). The total workforce at the plant varied from survey to survey, ranging from 135 to 165 workers. Participation at each survey ranged from 71% to 91%. Participation in more than one survey was much greater for Group 1 (101 of 146 participants, 69%) than for Group 2 (86 of 227 participants, 38%), as turnover among new workers was high (data not shown).
Table 2.
Characteristics of NIOSH medical survey participants hired before or after November 4, 2000 (the last day of the first NIOSH medical survey), at a microwave popcorn plant in Missouri, 2000–2003
aGroup 1 = workers hired before November 4, 2000; Group 2 = workers hired on or after November 4, 2000
NIOSH = National Institute for Occupational Safety and Health
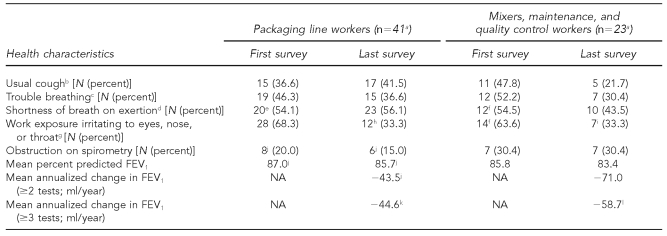
Among Group 1 workers who participated in one of the last two surveys as well as in one or more previous surveys, those who worked in the QC laboratory or in maintenance, or had ever worked as mixers of oil and flavorings, had initial prevalences of trouble breathing and shortness of breath on exertion that were similar to those of microwave popcorn packaging line workers (range for both: 46.3%–54.5%). Prevalences of reported eye, nose, or throat irritation were similar (68.3% vs. 63.6%), but the prevalence of usual cough was higher among the ever mixer, maintenance, and QC worker subgroup than among packaging line workers (47.8% vs. 36.6%). Both subgroups had a high prevalence of airways obstruction on spirometry (30.4% in the mixer, maintenance, and QC worker subgroup and 20.0% among packaging line workers) and a low mean percent predicted FEV1 (87.0% in packaging line workers vs. 85.8% in the mixer, maintenance, and QC worker subgroup). The only statistically significant change in symptom prevalence in either subgroup over time, from first to last survey, was a decline in reported eye, nose, or throat irritation. There were no statistically significant changes in the prevalence of airways obstruction or in mean percent predicted FEV1 over time in either subgroup, nor in the difference in mean annualized change in FEV1 between the subgroups (Table 3).
Table 3.
Health characteristics over time for Group 1 microwave popcorn production workers at a microwave popcorn plant in Missouri, 2000–2003
aTotal number of survey participants in subgroup
bThe questionnaire asked, “Do you usually have a cough?” (first survey and follow-up surveys).
cThe questionnaire asked, “During the last 12 months, have you had any trouble with your breathing?” (first survey) and “Since the last time we saw you, have you had any trouble with your breathing?” (follow-up surveys).
dThe questionnaire asked, “Are you troubled by shortness of breath when hurrying on level ground or walking up a slight hill?” (first survey and follow-up surveys).
eFour of 41 survey participants in the subgroup did not answer the question.
fOne of 23 survey participants in the subgroup did not answer the question.
gThe questionnaire asked, “Is there an exposure in your work environment that you find irritating to your eyes, nose, or throat?” (first survey and follow-up surveys).
hFive of 41 survey participants in the subgroup did not answer the question.
iTwo of 23 survey participants in the subgroup did not answer the question.
jOne of 41 survey participants in the subgroup did not have at least two interpretable spirometry tests.
kTwo of 41 survey participants in the subgroup did not have at least three interpretable spirometry tests.
lOne of 23 survey participants in the subgroup did not have at least three interpretable spirometry tests.
FEV1 = forced expiratory volume in one second
ml = milliliter
NA = not applicable
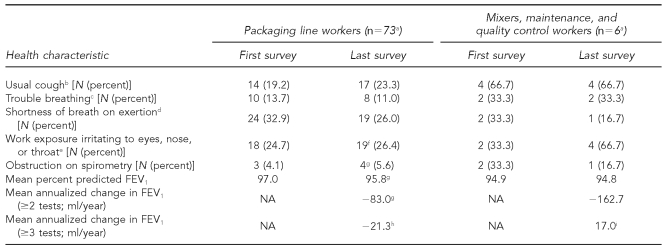
Most Group 2 participants who took part in more than one NIOSH survey worked in microwave popcorn packaging line jobs; only six worked in the QC laboratory, in maintenance, or as ever mixers. For packaging line workers, symptom prevalence based on data from each participant's first survey ranged from 13.7% for trouble breathing to 32.9% for shortness of breath on exertion; the prevalence of airways obstruction was low (4.1%) (Table 4). Compared with packaging line workers in Group 1 (Table 3), these prevalences were significantly lower, and mean percent predicted FEV1 was significantly higher. Among the Group 2 mixer, maintenance, and QC workers, 66.7% (four of six participants) reported usual cough on their first survey (Table 4). The prevalence of other chest symptoms; eye, nose, or throat irritation; and airways obstruction was 33.3% in this group. Based on last survey data, the prevalence of eye, nose, or throat irritation increased to 66.7% and the prevalence of airways obstruction decreased to 16.7% (one of six participants). There were no statistically significant changes in the prevalence of symptoms and airways obstruction or in mean percent predicted FEV1 from first to last survey in either of the Group 2 subgroups.
Table 4.
Health characteristics over time for Group 2 microwave popcorn production workers at a microwave popcorn plant in Missouri, 2000–2003
aTotal number of survey participants in subgroup
bThe questionnaire asked, “Do you usually have a cough?” (first survey and follow-up surveys).
cThe questionnaire asked, “During the last 12 months, have you had any trouble with your breathing?” (first survey) and “Since the last time we saw you, have you had any trouble with your breathing?” (follow-up surveys).
dThe questionnaire asked, “Are you troubled by shortness of breath when hurrying on level ground or walking up a slight hill?” (first survey and follow-up surveys).
eThe questionnaire asked, “Is there an exposure in your work environment that you find irritating to your eyes, nose, or throat?” (first survey and follow-up surveys).
fOne of 73 survey participants in the subgroup did not answer the question.
gOne of 73 survey participants in the subgroup did not have at least two interpretable spirometry tests.
hOnly 31 of 73 survey participants in the subgroup had at least three interpretable spirometry tests.
iTwo of six survey participants in the subgroup did not have at least three interpretable spirometry tests.
FEV1 = forced expiratory volume in one second
ml = milliliter
NA = not applicable
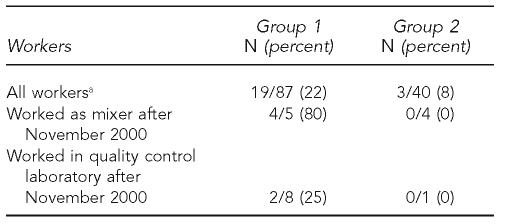
Of the 87 Group 1 participants who participated in at least three of the medical surveys, 19 (22%) had FEV1 declines >300 ml and/or 10% from their first to last spirometry test. Of the 40 Group 2 participants who participated in at least three surveys, three (8%) had FEV1 declines >300 ml and/or 10% from their first to last spirometry test (Table 5).
Table 5.
Prevalences of FEV1 declines of 300 ml and/or 10% from first to last test in workers who had three or more spirometry tests at a microwave popcorn plant in Missouri, 2000–2003
ap=0.07
FEV1 = forced expiratory volume in one second
ml = milliliter
Nine workers who worked as mixers for at least one month after the November 2000 survey participated in at least three of the medical surveys. Four of these nine workers, all from Group 1, had excessive FEV1 declines. One mixer experienced an extreme decline in lung function during the eight NIOSH surveys. (That mixer's FEV1 declined 1,300 ml during nine months; after stopping work as a mixer, it continued to fall, resulting in a total decline of 2,800 ml in 2.75 years, representing a decline from 96% predicted to 39% predicted.) The four workers with excessive FEV1 declines averaged 34 months of work as mixers (range: 7–67 months) compared with 10 months (range: 5–13 months) in the five mixers without excessive FEV1 declines.
Of the nine workers who worked in the QC laboratory at some point after the November 2000 survey and who participated in three or more surveys, seven had stable lung function over time. Two workers, both from Group 1, had excessive FEV1 declines.
DISCUSSION
The implementation of exposure controls at the index plant had a substantial effect on air concentrations of flavoring chemicals. Compared with November 2000, mean TWA diacetyl air concentrations measured in November 2001 were approximately 96% lower in the mixing room, 85% lower in the microwave popcorn packaging line area, and 51% lower in the QC laboratory. After the implementation of a new, more isolated mixing room in the fall of 2002 and enclosure of the mezzanine area in March 2003, mean TWA diacetyl air concentrations in the microwave popcorn packaging line area further declined below detectable limits in July 2003. With the microwave oven relocation and ventilation changes implemented in the QC laboratory by May 2003, diacetyl concentrations were also reduced below detectable levels in this area.
In addition to the engineering controls described previously, mixers began using respiratory protection in November 2000, including supplied-air respirators in August 2002, further reducing their diacetyl exposures. Analyses of data from follow-up medical surveys revealed evidence that the workforce was at lower risk for lung disease after exposures were controlled. Prevalences of chest symptoms and abnormal lung function in workers with past high exposures (Group 1) remained mostly unchanged over time. This is to be expected with an irreversible lung disease process. In contrast, the prevalence of mucous membrane irritant symptoms declined following exposure control. The limited follow-up data on new workers (Group 2) showed that packaging line workers had lower symptom prevalences and better lung function than their Group 1 counterparts on their initial medical surveys and did not appear to worsen over time. Additionally, among 27 Group 1 participants who participated in all eight medical surveys, annualized declines in FEV1 improved from 144 ml per year to 40 ml per year to 22 ml per year, the last being consistent with normal aging-related lung function decline.15
The TWA air concentration of diacetyl is not the only exposure metric that may be pertinent to lung disease risk in workers exposed to butter-flavoring chemicals. The former and current workers at highest risk in this plant worked in the mixing room and in the QC laboratory. While mixers had the highest mean TWA diacetyl exposures (57.2 ppm), QC laboratory workers' exposures were approximately two orders of magnitude lower (0.823 ppm) in November 2000. At three other microwave popcorn plants where mixers had developed bronchiolitis obliterans, mean humidity-corrected TWA diacetyl air concentrations from NIOSH air sampling in the mixing area were much lower, ranging from 0.759 ppm to 1.54 ppm. What these high-risk areas have in common is the potential for repeated, short-term, intense peak exposures to butter-flavoring chemicals (up to 13 ppm diacetyl when a QC laboratory worker opens a just-popped bag; as high as 1,200 ppm if a worker lifts the lid to look into a tank of heated butter flavoring;7 and up to 80 ppm when a mixer pours liquid butter flavorings into a mixing tank).8
Because only one Group 2 participant had worked in the QC laboratory, data were insufficient to assess ongoing risk to workers in this area. QC laboratory workers with lower mean exposures at other microwave popcorn plants appeared to be at much lower risk for lung disease.8 While none of the four Group 2 workers who had worked in the mixing room and participated in at least three medical surveys had excessive FEV1 declines, three of them had worked fewer than 12 months in mixing and the fourth had worked only 13 months in mixing. In analyses of medical survey data from NIOSH surveys at six microwave popcorn plants (including the index plant), we found that mixers with >12 months work experience had significantly lower lung function than mixers with ≤12 months work experience.8
Although mandatory respiratory protection can help limit ongoing risk to workers in the mixing room, workers may still experience hazardous exposures due to improper respirator use or fit, respirator malfunction, or failure to wear the respirator at all times when they are exposed. We recommend that the mixing operation be engineered to a closed process. Baseline spirometry and regularly scheduled follow-up tests for mixing room, QC laboratory, and maintenance workers are necessary to detect abnormalities or rapid declines in lung function that might be due to work-related exposures. Additional interventions to limit exposures in these areas may be necessary if excessive lung function declines are identified.
Limitations
We were limited in assessing ongoing lung disease risk as interventions lowered exposures because the company did not implement spirometry testing for new workers until June 2003. Thus, new workers had often been in the plant for weeks or months prior to their first NIOSH survey. If they had abnormal lung function on their first NIOSH test, there was no way to know whether or not the abnormality predated their start of work in the plant. Even with normal lung function on their first NIOSH test, there was no way to know if a worker, who may have had above-normal lung function before working at the plant, had experienced a rapid decline in lung function due to hazardous exposure at the plant. Another limitation was the short duration of follow-up for most new workers due to rapid turnover of the workforce.
Intervention by substitution of safer butter flavorings has been a difficult issue. Flavorings are complex mixtures of many volatile organic compounds (VOCs) that are formulated as liquids, pastes, and powders. Flavoring chemicals are usually assessed for safety to consume in small quantities in food, but few have been evaluated for safety to inhale at the concentrations to which some workers are exposed. Diacetyl is one butter-flavoring chemical with known potential to cause airway injury,4,5 but other highly irritating butter-flavoring chemicals may contribute to the overall toxic effects of butter flavorings. A flavoring that contains less diacetyl may or may not be safer depending on the composition of the rest of the mixture. Another diacetyl flavor substitute, 2,3-pentanedione, can cause respiratory epithelial necrosis similar to diacetyl, and other alpha-diketones may have similar toxicity.16 Additionally, some powdered flavorings are encapsulated to minimize release of VOCs during incorporation into food in the production process. While these powders may pose less risk to workers from VOC emissions, airborne respirable particulate can be generated when workers handle them during production.17 The potential risk to workers from inhalation of such powders is currently unknown, but the encapsulated flavorings are released upon contact with moisture, which may happen on mucosal surfaces of the respiratory tract.
CONCLUSIONS
In a plant where workers with uncontrolled exposures to butter-flavoring chemicals in microwave popcorn production had rapidly developed severe, irreversible lung disease, increased ventilation and isolation of flavor sources in mixing, holding tanks, and microwave popping decreased the risk for most workers. However, some workers with continuing potential for intermittent peak exposures and measurable TWA exposures remain at risk; these worker subgroups should have respiratory protection and medical surveillance with regularly scheduled spirometry to detect rapid declines in lung function that may be work-related, possibly due to failure or inadequacy of implemented control strategies. The success of this approach for protecting workers depends on a good understanding of the nature of the risk by management, workers, health and safety professionals, physicians, and public health authorities, as well as a firm commitment by management to regularly evaluate and maintain the effectiveness of exposure controls and the quality of serial spirometry in medical surveillance.
Photo 2:
Mixing and flavor-holding tanks before implementation of controls. Note the five-gallon buckets used for open transfer of flavorings, and evidence of spills on outside of the mixing tank. Courtesy of the National Institute for Occupational Safety and Health.
Photo 3:
Mixer near open mixing tank prior to implementation of respiratory protection program. Courtesy of the National Institute for Occupational Safety and Health.
Photo 4:
Mixing room after implementation of exposure controls shows exhaust fan on wall and local exhaust ventilation hoses on tanks. Courtesy of the National Institute for Occupational Safety and Health.
Photo 5:
Device for closed transfer of heated butter flavorings. Courtesy of the National Institute for Occupational Safety and Health.
Photo 6:
Closed door to mixing room for exposure control. Courtesy of the National Institute for Occupational Safety and Health.
Acknowledgments
The authors appreciate the participation of hundreds of workers in multiple medical and industrial hygiene surveys.
Footnotes
Funding for this work was provided by the National Institute for Occupational Safety and Health (NIOSH). The findings and conclusions in this article are those of the authors and do not necessarily represent the views of NIOSH.
REFERENCES
- 1.Fixed obstructive lung disease in workers at a microwave popcorn factory—Missouri, 2000–2002. MMWR Morb Mortal Wkly Rep. 2002;51(16):345–7. [PubMed] [Google Scholar]
- 2.Kreiss K, Gomaa A, Kullman G, Fedan K, Simoes EJ, Enright PL. Clinical bronchiolitis obliterans in workers at a microwave-popcorn plant. N Engl J Med. 2002;347:330–8. doi: 10.1056/NEJMoa020300. [DOI] [PubMed] [Google Scholar]
- 3.Hubbs AF, Batelli LA, Goldsmith WT, Porter DW, Frazer D, Friend S, et al. Necrosis of nasal and airway epithelium in rats inhaling vapors of artificial butter flavoring. Toxicol Appl Pharmacol. 2002;185:128–35. doi: 10.1006/taap.2002.9525. [DOI] [PubMed] [Google Scholar]
- 4.Hubbs AF, Goldsmith WT, Kashon ML, Frazer D, Mercer RR, Battelli LA, et al. Respiratory toxicologic pathology of inhaled diacetyl in Sprague-Dawley rats. Toxicol Pathol. 2008;36:330–44. doi: 10.1177/0192623307312694. [DOI] [PubMed] [Google Scholar]
- 5.Morgan DL, Flake GP, Kirby PJ, Palmer SM. Respiratory toxicity of diacetyl in C57BL/6 mice. Toxicol Sci. 2008;103:169–80. doi: 10.1093/toxsci/kfn016. [DOI] [PMC free article] [PubMed] [Google Scholar]
- 6.Akpinar-Elci M, Travis WD, Lynch DA, Kreiss K. Bronchiolitis obliterans syndrome in popcorn plant workers. Eur Respir J. 2004;24:298–302. doi: 10.1183/09031936.04.00013903. [DOI] [PubMed] [Google Scholar]
- Kanwal R, Kullman G, Fedan K, Kreiss K. Health hazard evaluation report: Gilster-Mary Lee Corporation, Jasper, Missouri. Morgantown (WV): Department of Health and Human Services, Public Health Service, Centers for Disease Control and Prevention, National Institute for Occupational Safety and Health (US); 2006. Jan, [cited 2011 Jan 18]. Publication No. 2000-0401-2991. Also available from: URL: http://www.cdc.gov/niosh/hhe/reports/pdfs/2000-0401-2991.pdf. [Google Scholar]
- 8.Kanwal R, Kullman G, Piacitelli C, Boylstein R, Sahakian N, Martin S, et al. Evaluation of flavorings-related lung disease risk at six microwave popcorn plants. J Occup Environ Med. 2006;48:149–57. doi: 10.1097/01.jom.0000194152.48728.fb. [DOI] [PubMed] [Google Scholar]
- 9.Schlecht PC, O'Connor PF. 4th ed. 3rd supplement. Cincinnati: Department of Health and Human Services, Public Health Service, Centers for Disease Control and Prevention, National Institute for Occupational Safety and Health (US); 2003. NIOSH manual of analytical methods. Publication No. 2003-154. [Google Scholar]
- 10.Cox-Ganser J, Ganser G, Saito R, Hobbs G, Boylstein R, Hendricks W, et al. Correcting diacetyl concentrations from air samples collected with NIOSH Method 2557. J Occup Environ Hyg. 2011;8:59–70. doi: 10.1080/15459624.2011.540168. [DOI] [PubMed] [Google Scholar]
- 11.American Thoracic Society. Standardization of spirometry: 1994 update. Am J Respir Crit Care Med. 1995;152:1107–36. doi: 10.1164/ajrccm.152.3.7663792. [DOI] [PubMed] [Google Scholar]
- 12.Hankinson JL, Odencrantz JR, Fedan KB. Spirometric reference values from a sample of the general U.S. population. Am J Respir Crit Care Med. 1999;159:179–87. doi: 10.1164/ajrccm.159.1.9712108. [DOI] [PubMed] [Google Scholar]
- 13.Wang ML, Petsonk EL. Repeated measures of FEV1 over six to twelve months: what change is abnormal? J Occup Environ Med. 2004;46:591–5. doi: 10.1097/01.jom.0000128159.09520.2a. [DOI] [PubMed] [Google Scholar]
- 14.SAS Institute Inc. SAS®. Version 9.1 for Windows. Cary (NC): SAS Institute, Inc.; 2004. [Google Scholar]
- 15.Kreiss K. Flavoring-related bronchiolitis obliterans. Curr Opin Allergy Clin Immunol. 2007;7:162–7. doi: 10.1097/ACI.0b013e3280298235. [DOI] [PubMed] [Google Scholar]
- 16.Hubbs AF, Moseley AE, Goldsmith WT, Jackson MC, Kashon ML, Battelli LA, et al. Airway epithelial toxicity of the flavoring agent, 2,3-pentanedione. Toxicol Sci. 2010;114(Suppl 1):319. [Google Scholar]
- 17.Boylstein R, Piacitelli C, Grote A, Kanwal R, Kullman G, Kreiss K. Diacetyl emissions and airborne dust from butter flavorings used in microwave popcorn production. J Occup Environ Hyg. 2006;3:530–5. doi: 10.1080/15459620600909708. [DOI] [PubMed] [Google Scholar]


