Abstract
Objectives
We described disparities in infectious disease (ID) hospitalizations for American Indian/Alaska Native (AI/AN) people.
Methods
We analyzed hospitalizations with an ID listed as the first discharge diagnosis in 1998–2006 for AI/AN people from the Indian Health Service National Patient Information Reporting System and compared them with records for the general U.S. population from the Nationwide Inpatient Survey.
Results
The ID hospitalization rate for AI/AN people declined during the study period. The 2004–2006 mean annual age-adjusted ID hospitalization rate for AI/AN people (1,708 per 100,000 populiation) was slightly higher than that for the U.S. population (1,610 per 100,000 population). The rate for AI/AN people was highest in the Southwest (2,314 per 100,000 population), Alaska (2,063 per 100,000 population), and Northern Plains West (1,957 per 100,000 population) regions, and among infants (9,315 per 100,000 population). ID hospitalizations accounted for approximately 22% of all AI/AN hospitalizations. Lower-respiratory--tract infections accounted for the largest proportion of ID hospitalizations among AI/AN people (35%) followed by skin and soft tissue infections (19%), and infections of the kidney, urinary tract, and bladder (11%).
Conclusions
Although the ID hospitalization rate for AI/AN people has declined, it remains higher than that for the U.S. general population, and is highest in the Southwest, Northern Plains West, and Alaska regions. Lower-respiratory-tract infections; skin and soft tissue infections; and kidney, urinary tract, and bladder infections contributed most to these health disparities. Future prevention strategies should focus on high-risk regions and age groups, along with illnesses contributing to health disparities.
Infectious diseases (IDs) have historically caused widespread morbidity and mortality both worldwide and in the United States.1–3 IDs remain a public health issue and are of particular concern for the American Indian/Alaska Native (AI/AN) population, which has had excessive ID morbidity and mortality for several decades.4–9 Both hospitalizations and outpatient visits due to IDs have been disproportionately higher in the AI/AN population compared with the U.S. population.7,10–13 These disparities affect all ages, especially infants and older adults.6,8,13 Studies of specific IDs, including lower-respiratory-tract infections (LRTIs), diarrhea-related infections, and skin and ear infections, have also shown a disparity between AI/AN people and the general U.S. population.10,11,14–16 However, the trends and disparities of ID hospitalizations for AI/AN people have not been analyzed since an evaluation of 1994 ID hospitalizations.7
We determined the epidemiology and trends of ID hospitalizations for AI/AN people in 1998–2006 using Indian Health Service (IHS) inpatient data to assess any changes in their ID burden, and to determine high-risk regions and age groups that should be targeted for further intervention. We also compared the trends and rates for AI/AN people with those for the general U.S. population to determine whether health disparities in ID hospitalizations remain for AI/AN people.
METHODS
We analyzed 1998–2006 hospital discharge data for AI/AN people (within the IHS health-care system) and for the general U.S. population.17,18 The unit of analysis for the study was a hospitalization.
We obtained hospitalizations for AI/AN people from the IHS Direct and Contract Health Service Inpatient Dataset, IHS National Patient Information Reporting System.17 The IHS data consisted of all hospital discharge records reported directly from IHS- or tribally operated hospitals and community hospitals that are contracted with IHS or tribes to provide health-care services to eligible AI/AN people.4 We excluded the IHS California and Portland (Oregon) Administrative Areas because neither had any IHS- or tribally operated hospitals. In addition, the California Area does not report contract health services inpatient data by diagnosis, and the Portland Area has limited contract health service funds for inpatient care.19,20
We obtained and analyzed hospital discharge records for the general U.S. population from the Nationwide Inpatient Sample for comparison.2,18 The IHS AI/AN population in this study represents AI/AN people who received IHS/tribal direct or contract health care (>1.4 million people);19,21 approximately 57% of the AI/AN population is eligible for IHS health care.4 The Nationwide Inpatient Sample is a nationally representative survey of hospitalizations conducted by the Healthcare Cost and Utilization Project in collaboration with participating states and is the largest all-payer inpatient dataset in the U.S.;18 the data and the weighting methodology for the Nationwide Inpatient Sample have been described elsewhere.2,18
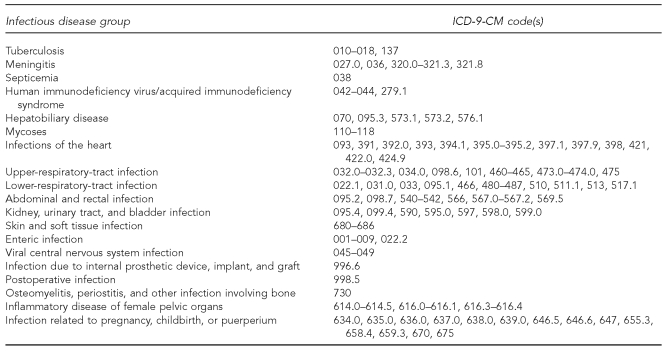
All hospital discharge records with an ID listed as any one of up to 15 diagnoses on the IHS Direct and Contract Health Service Inpatient Dataset record for AI/AN people were selected, as well as those diagnoses for the general U.S. population from the Nationwide Inpatient Sample. Analysis was restricted to records in which the diagnosis listed first on the discharge record (first-listed) was an ID diagnosis, unless otherwise specified. Hospital stays for newborns (births) were excluded. Overall, first-listed ID and ID groups were categorized by using a previously described ID classification method2,7,22 based on the International Classification of Diseases, Ninth Revision, Clinical Modification (ICD-9-CM) codes23 (Figure 1).
Figure 1.
Infectious disease group definitions with corresponding ICD-9-CM codes
ICD-9-CM = International Classification of Diseases, Ninth Revision, Clinical Modification
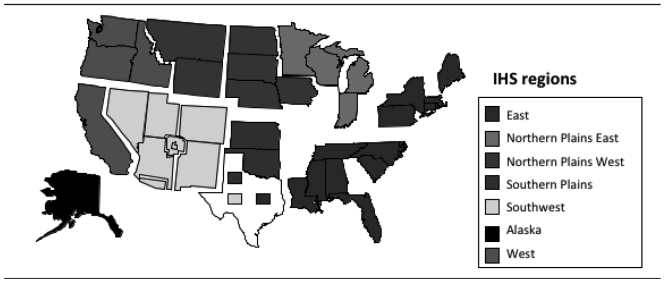
We examined first-listed ID hospital discharge records by age group, gender, geographic region, and ID group. As shown in Figure 2, regions (from IHS Administrative Areas) were defined as follows: East (Nashville Area), Northern Plains East (Bemidji Area), Northern Plains West (Aberdeen and Billings Areas), Alaska (Alaska Area), Southern Plains (Oklahoma City Area), and Southwest (Albuquerque, Navajo, Phoenix, and Tucson Areas).19 We described seasonality of hospitalizations by month of discharge overall and by region. We selected the specific ID groups based on their first-listed diagnoses. Accompanying diagnoses listed anywhere on the first-listed ID hospitalization records were also examined. We performed tests for trend for 1998–2006 for the IHS ID age-adjusted hospitalization rates using linear regression.19,24 The median age of hospitalization was compared among IHS regions using the Wilcoxon rank-sum test. We conducted statistical tests using p=0.05 as the significance level.
Figure 2.
Map of the Indian Health Service regionsa in the United States
Note: Texas is administered by the Nashville, Oklahoma City, and Albuquerque areas.
aThe West region was excluded from the analysis.
IHS = Indian Health Service
We calculated annual and mean annual (2004–2006) hospitalization rates as the number of hospitalizations per 100,000 corresponding population. We calculated rates for all (all-cause) hospitalizations, and for first-listed ID, any-listed ID, and ID group hospitalizations. We calculated the age-adjusted hospitalization rates for both the IHS AI/AN population and the general U.S. population using the direct method, with the 2000 projected U.S. population as the standard.25
The annual IHS AI/AN population denominator estimates were the IHS annual user population for fiscal years 2001–2006 and for the years 1998–2000 adjusted by the change in their service population from the fiscal year 2001 user population, excluding the IHS California and Portland Areas.4,21 The user population included all AI/AN people who received IHS-funded health-care service at least once during the previous three years.4 For the general U.S. population, we calculated hospitalization rates with 95% confidence intervals (CIs) as the weighted number of hospitalizations with denominators determined from the National Center for Health Statistics bridged-race population estimates.18,26,27 To account for the sampling design of the Nationwide Inpatient Sample, we calculated standard errors (SEs) of the hospitalization estimates using SUDAAN®.28
RESULTS
Hospitalization rates: overall rates and trends
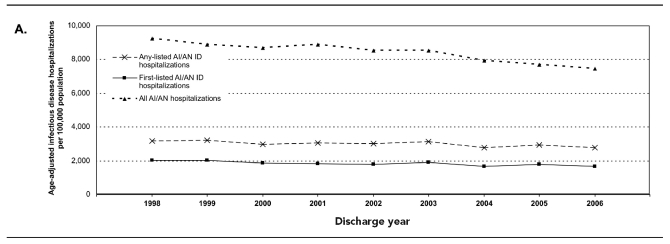
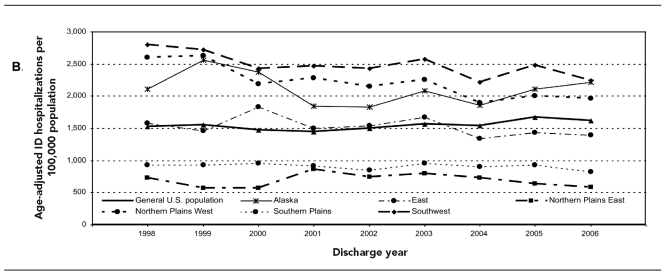
During 1998–2006, the annual ID age-adjusted hospitalization rate for AI/AN people whose first-listed diagnosis was an ID diagnosis showed a decline (Figure 3a), an 18% decrease from a rate of 2,027.5 per 100,000 population in 1998 to 1,673.4 per 100,000 population in 2006 (p<0.01). The any-listed ID age-adjusted hospitalization rate declined from 3,189.0 to 2,770.2 per 100,000 population per year, a 13% decrease (p=0.01) (Figure 3a). The overall first-listed age-adjusted ID hospitalization rate decline was seen for both males (2,048.5 to 1,690.8 per 100,000 population, p<0.05) and females (2,015.4 to 1,660.4 per 100,000 population, p<0.05). A significant decrease was seen in all age groups, except for those aged 40–49 and 70–79 years (data not shown). The largest decrease (49%) among age groups was seen in infants younger than one year of age (14,588.7 to 8,616.0 per 100,000 population, p<0.001). Regionally, however, a significant age-adjusted ID hospitalization rate decline was only seen in the Southwest (19.6%, p<0.05) and Northern Plains West (24.4%, p=0.001) regions (Figure 3b); a significant decline was seen in all age groups in the Northern Plains West region and in those aged <5, 20–39, and 60–69 years in the Southwest region (data not shown).
Figure 3a.
Age-adjusted hospitalization rates per 100,000 population among AI/AN people for first-listed and any-listed ID hospitalizations and all-cause hospitalizations (IHS/tribal), 1998–2006
AI/AN = American Indian/Alaska Native
ID = infectious disease
IHS = Indian Health Service
Figure 3b.
Regional age-adjusted first-listed ID hospitalization rates per 100,000 population for AI/AN people (IHS/tribal) and overall age-adjusted first-listed ID hospitalization rates for the general U.S. population (Nationwide Inpatient Sample), 1998–2006
ID = infectious disease
AI/AN = American Indian/Alaska Native
IHS = Indian Health Service
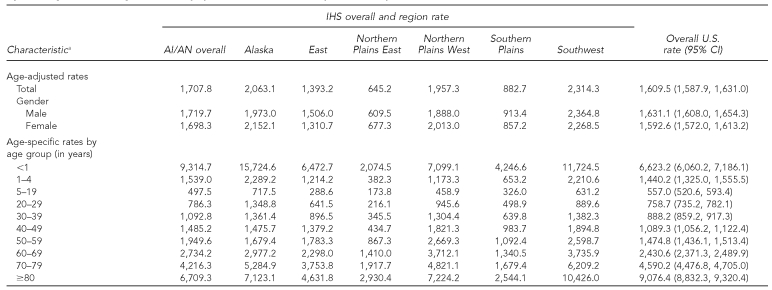
During 2004–2006, the mean annual age-adjusted ID hospitalization rate for AI/AN people (1,707.8 per 100,000 population) remained slightly higher than that for the general U.S. population (1,609.5 per 100,000 population, 95% CI 1,587.9, 1,631.0); however, the rates in the Alaska, Southwest, and Northern Plains West regions were higher than those for the general U.S. population (Table 1). In contrast, the rates in the Northern Plains East and Southern Plains regions were lower than that for the general U.S. population. IDs accounted for approximately 22.3% of all hospitalizations among AI/AN people compared with 13.9% (SE=0.1) for the U.S. population during this period. Regionally, the proportion of all hospitalizations due to IDs during 2004–2006 for the Southwest, Alaska, Northern Plains West, Southern Plains, East, and Northern Plains East regions were 26.2%, 20.3%, 20.1%, 18.1%, 18.0%, and 17.0%, respectively (data not shown).
Table 1.
Age-adjusted ID hospitalization rates per 100,000 population among AI/AN people (IHS/tribal) by IHS region and the general U.S. population (Nationwide Inpatient Sample), 2004-–2006
aIHS 2004–2006 user population denominators for IHS region rates were as follows: Alaska (382,980), East (120,467), Northern Plains East (279,997), Northern Plains West (561,947), Southern Plains (906,465), and Southwest (1,457,123). Gender was missing for one AI/AN person. The age-adjusted hospitalization rate is expressed as number of first-listed ID hospitalizations per 100,000 population. Rates are age-adjusted by the direct method using the projected 2000 population for the U.S. Rates with 95% CIs for the general U.S. population are calculated using weighted estimates from the Nationwide Inpatient Sample.
ID = infectious disease
AI/AN = American Indian/Alaska Native
IHS = Indian Health Service
CI = confidence interval
Hospitalization rates: demographic characteristics
For 2004–2006, the mean annual age-specific ID hospitalization rate was highest for AI/AN infants (9,314.7 per 100,000 population), followed by adults ≥60 years of age (range: 2,734.2–6,709.3 per 100,000 population) (Table 1). The rate for infants was highest in the Alaska (15,724.6 per 100,000 population) and Southwest (11,724.5 per 100,000 population) regions; these rates were about two times higher than for the general U.S. infant population (6,623.2 per 100,000 population, 95% CI 6,060.2, 7,186.1). The rates for all age groups in the Southwest and Alaska regions (except for those aged ≥80 years in Alaska) and the rates for infants and mid-age groups (20–79 years) in the Northern Plains West region were higher than those for the general U.S. population; the rates in the Northern Plains East and Southern Plains regions were lower than those for the general U.S. population in all age groups.
As shown in Table 1, both AI/AN males and females had higher ID hospitalization rates than the general U.S. population. Overall, the rates for AI/AN males and females were similar; however, the rates for males among those aged <5, 30–49, and ≥80 years were higher than those for females, while the rates for females were higher among those aged 5–29 and 50–79 years (data not shown). The median age for ID hospitalizations for the Alaska region was lower than those for each of the other regions (p<0.001) and for the general U.S. population.
Hospital seasonality, length of stay, and discharge disposition
For 2004–2006, almost one-third of ID hospitalizations among AI/AN people occurred in January, February, and March (30.4%). The same seasonal pattern for ID hospitalizations was also seen in each IHS region. ID hospitalizations among AI/AN people averaged approximately 86,163 hospital days per year. The median length of stay (LOS) for an ID hospitalization among AI/AN people was three days (quartiles 2, 5; mean = 5 days), which was similar to that for the general U.S. population (median = 3 days, quartiles 2, 6; mean = 6 days). The LOS for AI/AN people was similar for all regions and for both males and females. The LOS increased by age; the median LOSs for those aged ≤29, 30–39, and ≥40 years were two, three, and four days, respectively. Among AI/AN people, 1.1% of the ID hospitalizations resulted in death and 5.5% of the ID hospitalizations indicated a patient transfer to other facilities (data not shown).
ID groups
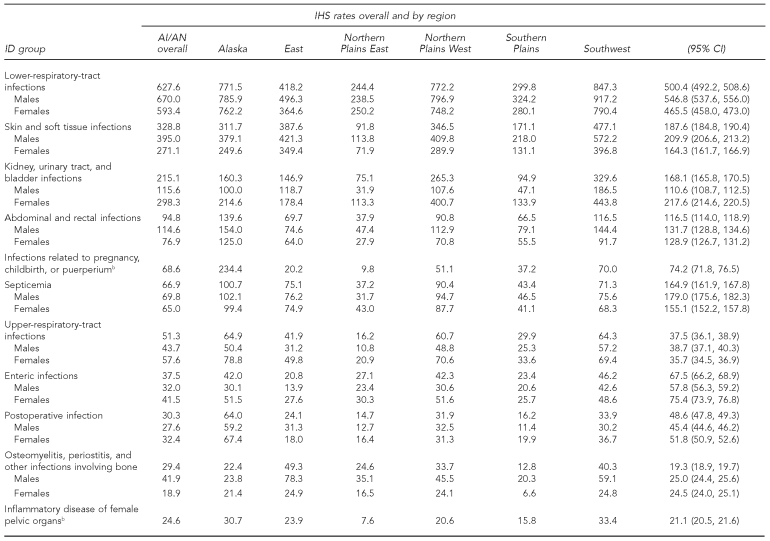
LRTIs were the most common ID group, accounting for 35.3% of first-listed ID hospitalizations in 2004–2006; the proportion was similar among regions and similar to that for the general U.S. population (31.2%, SE=0.16). First-listed diagnoses for LRTI hospitalizations included pneumonia (66.4%), bronchiolitis (16.5%), and influenza (2.1%). The mean annual age-adjusted LRTI hospitalization rate was the highest among all ID group hospitalizations in all regions and for both males and females (Table 2). The LRTI age-adjusted hospitalization rates in the Southwest (847.3 per 100,000 population), Northern Plains West (772.2 per 100,000 population), and Alaska (771.5 per 100,000 population) regions were approximately 1.5 times higher than the rate for the general U.S. population (500.4 per 100,000 population, 95% CI 492.2, 508.6). The rate of LRTI hospitalizations among AI/AN people was highest for infants (6,733.4 per 100,000 population) and was about three times higher in the Alaska (11,003.3 per 100,000 population) and Southwest (8,297.7 per 100,000 population) regions than for the general U.S. infant population (3,755.8 per 100,000 population, 95% CI 3,462.1, 4,049.4) (data not shown).
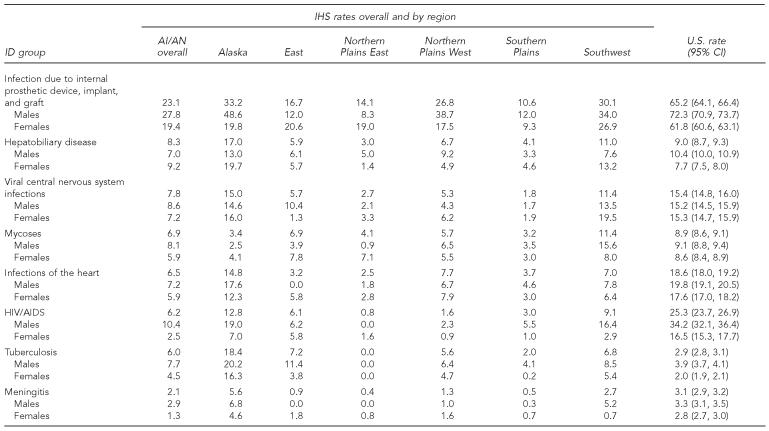
Table 2.
Age-adjusted hospitalization rates per 100,000 population by ID group among AI/AN people (IHS/tribal) by IHS region and the general U.S. population (Nationwide Inpatient Sample), 2004–2006a
aRates are expressed as the number of first-listed hospitalizations per 100,000 population. All rates are age-adjusted using the direct method, with the 2000 projected general U.S. population as the standard. Rates with 95% CIs for the general U.S. population are calculated using weighted estimates from the Nationwide Inpatient Sample.
bFemales only
ID = infectious disease
AI/AN = American Indian/Alaska Native
IHS = Indian Health Service
CI = confidence interval
HIV/AIDS = human immunodeficiency virus/acquired immunodeficiency syndrome
Skin and soft tissue infections (SSTIs) were the second most common ID among AI/AN people, with a higher proportion of first-listed ID hospitalizations (19.4%) than that for the general U.S. population (11.7%, SE=0.1); the regional proportions ranged from 14.9% to 28.1%. The SSTI age-adjusted rate for males was higher than that for females in all regions, and the SSTI regional rates for the Southwest, East, Northern Plains West, and Alaska regions were higher than the rate for the general U.S. population (Table 2). The kidney, urinary tract, and bladder infection group accounted for 11.1% of ID hospitalizations, which was similar to that for the U.S. (10.5%, SE=0.06). The age-adjusted rate for kidney, urinary tract, and bladder infections was particularly high in the Southwest and Northern Plains West regions, and the rate for females was higher than that for males in all regions.
For a number of ID groups, the IHS regional age-adjusted rates for AI/AN people were lower than those for the general U.S. population. These ID groups included septicemia; human immunodeficiency virus/acquired immunodeficiency syndrome (HIV/AIDS); enteric infections; infection due to internal prosthetic device, implant, and graft; and infections of the heart. For postoperative infection, viral central nervous system infections, and meningitis, the age-adjusted rates were lower than the rate for the general U.S. population in all IHS regions except for the Alaska region (Table 2).
Most frequently listed diagnoses
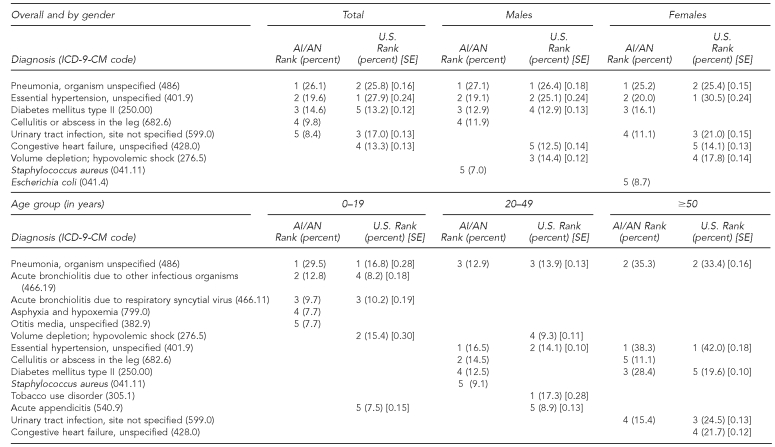
The most frequently listed diagnoses among hospitalizations for AI/AN people with a first-listed ID diagnosis were pneumonia, organism unspecified; essential hypertension, unspecified; diabetes mellitus type II; cellulitis or abscess in the leg; and urinary tract infection, site not specified (Table 3). The top three diagnoses were the same for male and female AI/AN people; however, the cellulitis and Staphylococcus aureus diagnoses were more common for male AI/ANs, while the urinary tract infection and Escherichia coli diagnoses were more common for female AI/ANs. The most common diagnosis for AI/AN people <20 years of age was pneumonia, organism unspecified, while essential hypertension, unspecified, was most often listed for AI/AN people ≥20 years of age. Pneumonia, organism unspecified, was the first or second most frequently listed diagnosis in all regions, followed by essential hypertension, unspecified, which was the next most commonly listed diagnosis in all regions except Alaska, where tobacco use disorder was the second most frequently listed diagnosis (Table 3). Diabetes mellitus type II was the third most common diagnosis in all regions except Alaska, where it was the 17th most common diagnosis. Diabetes mellitus type II was listed among only 4.4% of the ID hospitalizations in Alaska; however, among adults ≥50 years of age in Alaska, diabetes mellitus type II was the sixth most frequently listed diagnosis among ID hospitalizations (data not shown).
Table 3.
Most frequently listed diagnoses for ID-specific hospitalization by gender, age, and region for AI/AN people (IHS/tribal) and by gender and age for the general U.S. population (Nationwide Inpatient Sample), 2004–2006a
ID = infectious disease
AI/AN = American Indian/Alaska Native
IHS = Indian Health Service
ICD-9-CM = International Classification of Diseases, Ninth Revision, Clinical Modification
SE = standard error
DISCUSSION
This study describes ID hospitalizations among AI/AN people during 1998–2006. The ID hospitalization rate during 1998–2006 showed an overall decrease; however, regionally, this decline was only statistically significant in the Southwest and Northern Plains West regions. The overall mean annual age-adjusted ID hospitalization rate for 2004–2006 (1,708 per 100,000 population) showed an 8.3% decrease from a previously reported rate for 1994 (1,863 per 100,000 population) that used the same data source and methods; a decrease was seen for both genders, in all age groups, and in all regions except for the Southern Plains.7 An ID hospitalization rate decline was not seen for the general U.S. population.
While regional rates of ID hospitalizations among AI/AN people remained stable or decreased, the overall age-adjusted rate for the 2004–-2006 period remained slightly higher than that for the general U.S. population, and the proportion of ID hospitalizations among all hospitalizations for AI/AN people was higher than among the general U.S. population. Although previous reports have shown an ID health disparity,5,7,9 this study showed that the overall disparity gap appears to be narrowing. The age-adjusted ID hospitalization rate for AI/AN people was approximately 21% greater than that for the general U.S. population in 19947 and 6% greater in 2004–2006. Regionally, the disparity between the rates for AI/AN people and the general U.S. population in 2004–2006 remained for the Southwest, Alaska, and Northern Plains West regions. Rates for AI/AN people in the Northern Plains East and Southern Plains regions were lower, but this may have been due to a higher proportion of hospitalizations occurring outside of IHS/tribal and contract care facilities.19,20
The study results support a downward trend in ID hospitalization rates among AI/AN people; however, there is evidence of ongoing disparity in the Southwest, Alaska, and Northern Plains West regions, especially among infants, which can be attributed to a number of factors including poverty, household crowding, poor indoor air quality, and reduced access to indoor plumbing.14,19,29–32 Approximately 11% of AI/AN homes were still lacking a safe and reliable in-home water supply at the end of 2007.29 This lack of appropriate in-home water service and sanitation likely contributes to ID health disparities, particularly for water-washed diseases, which are caused by water scarcity, poor personal hygiene, and lack of proper human waste disposal, thus resulting in respiratory and skin infections.14 Additionally, ID disparities may be a result of limited access to IHS health-care facilities due to remote geography and funding. Many IHS facilities are located in remote areas and are designed to serve vast geographic areas.9
The largest ID hospitalization rate disparity between AI/AN people and the general U.S. population occurred in infants. In addition, the ID hospitalization rates for most age groups were higher for AI/AN people than those for the general U.S. population, except for those aged 5–19 and ≥70 years. Due to the higher rate among AI/AN children, the rate for older age groups may be lower than expected; this is consistent with a report that shows that death rates for AI/AN people converge with death rates for other racial/ethnic groups in the older age groups.9 Another explanation may be that older AI/AN adults are eligible for Medicare and, thus, are more unlikely to be patients in the IHS health-care system.
LRTIs were the most commonly listed ID group among AI/AN ID hospitalizations and contributed the most to the hospitalization disparity compared with the general U.S. population. The first-listed LRTI hospitalization rate was particularly high for infants and younger children, a finding that has been documented previously.12,16 The LRTI rate was higher than the rates for each of the other ID groups. The LRTI rates for the Alaska, Northern Plains West, and Southwest regions were higher than the rate for the general U.S. population. Factors that have been associated with LRTI among AI/AN people in these regions include household crowding, limited access to medical facilities, lack of in-home sanitation facilities in rural villages, cooking with a wood-burning stove, and tobacco use and exposure.14,29–32 Tobacco use disorder was one of the most common diagnoses in the Alaska region. Tobacco use has been reported to be highly prevalent among Alaska Native children and adults, which may contribute to high rates of LRTI hospitalizations in Alaska.33 In addition, the seasonal predominance in ID hospitalizations from January to March is principally due to the increase in LRTI hospitalizations.12
In this study, diabetes mellitus type II with a first-listed ID was a more frequently listed diagnosis in the AI/AN population than in the general U.S. population. This finding agrees with reports that the incidence of diabetes among AI/AN communities has increased in recent years.34 Diabetes may make patients more susceptible to certain types of infection; for example, diabetes has been shown to be an independent risk factor for hospitalization as a result of pneumonia, urinary tract infections, and skin infections.35 Furthermore, diabetes mellitus type II was listed as the third most common diagnosis among ID hospitalizations in all IHS regions except for Alaska, where it was not in the top five diagnoses. This lower proportion of diabetes mellitus type II in Alaska most likely reflects the younger age distribution of patients with ID hospitalizations compared with other regions.
This study documents some important public health successes and challenges for AI/AN people. First, the overall decline in the age-adjusted rate of ID hospitalizations among AI/AN people is encouraging, especially when compared with prevous reports.6,7 Although nearly all IHS regions experienced a rate decline, there were substantial differences among the regions for overall ID hospitalization rates and specific IDs. In addition, some of the ID group rates for AI/AN people were lower than those for the general U.S. population: septicemia; HIV/AIDS; enteric infections; infection due to internal prosthetic device, implant, and graft; and infections of the heart. These findings demonstrate that the AI/AN population is not uniform with regard to ID risk and indicate a need to further understand the causes of the regional differences. The previously reported rate (59 per 100,000 population) of enteric infections among first-listed ID hospitalizations in 1994 has decreased overall, and the rate in each region is lower than for the general U.S. population.7 Considering that these rates were about twice as high in 1994, this figure represents a substantial improvement.
Despite ongoing sanitation and safe water issues,14 there likely have been some considerable improvements in the availability of safe water, food safety efforts, and outbreak detection and control. The rate of hepatobiliary disease among first-listed ID hospitalizations also declined overall, likely indicating the impact of widespread use of hepatitis A and B vaccines.36 The rate for tuberculosis (TB) among first-listed ID hospitalizations declined more than twofold since 1994, yet is double the rate of the general U.S. population; in Alaska, the rate is six times higher than the U.S. rate. TB remains a health disparity of concern among AI/AN people.
Limitations
This study had several limitations. Hospital diagnoses may be incomplete or inaccurate due to the use of ICD-9-CM coding to identify ID hospitalizations; annual reporting and diagnostic coding may also vary by region and facility. Also, AI/AN patients within the IHS health-care system may receive health care outside the IHS health-care system; therefore, their hospitalizations would not be included in this study. Additionally, although the Nationwide Inpatient Sample contains information on nonfederal short-stay hospitalizations for AI/AN people that occur in non-IHS facilities, the number for these hospitalizations cannot be reliably estimated due to the small number of hospitalizations for AI/AN people in the sample and corresponding large relative SEs.2
We also used the first-listed diagnosis to identify ID hospitalizations in an attempt to limit misclassification of non-ID hospitalizations as ID hospitalizations; however, this approach means that some ID hospitalizations in which an ID diagnosis was not listed first were not included. Another limitation was that the denominator for the AI/AN population in this study was an estimate of the number of AI/AN people who used the IHS/tribal health-care system, excluding the West region, and likely did not include all AI/AN people who were eligible for health care at IHS/tribal facilities. Additionally, U.S. Census data were used as the denominator to estimate the rates for the general U.S. population, which may have affected the comparability of the rates for the two populations. Finally, the IHS inpatient data included all visit reports, while the U.S. national data in this study were based on discharges from a stratified sample of the nonfederal acute care visits within the U.S.4,18
CONCLUSIONS
We found that although the rate of ID hospitalizations has declined among AI/AN people, the age-adjusted ID hospitalization rates for the Southwest, Alaska, and Northern Plains West regions remained much higher than for the general U.S. population. The IDs contributing most to these disparities included LRTIs; SSTIs; and kidney, urinary tract, and bladder infections. The disparity in hospitalization rates was most severe for AI/AN infants and greatest for Alaska infants; the main contributor to the disparity was LRTIs. The underlying conditions that lead to these ID health disparities should be addressed with public health interventions to prevent illness and improve the health of AI/AN people. To reduce ID hospitalizations, strategies should focus on high-risk regions and age groups, along with illnesses contributing most to health disparity, by increasing prevention efforts and educating the communities most affected.
Acknowledgments
The authors thank Barbara Strzelczyk and Edna Paisano of the Indian Health Service (IHS) for technical assistance, the staff at the participating IHS/tribal and contract care hospitals, the staff at the IHS National Patient Information Reporting System, and the states that participate in the Healthcare Cost and Utilization Project.
Footnotes
The findings and conclusions in this article are those of the authors and do not necessarily represent the official position of the Centers for Disease Control and Prevention.
REFERENCES
- 1.Armstrong GL, Conn LA, Pinner RW. Trends in infectious disease mortality in the United States during the 20th century. JAMA. 1999;281:61–6. doi: 10.1001/jama.281.1.61. [DOI] [PubMed] [Google Scholar]
- 2.Christensen KL, Holman RC, Steiner CA, Sejvar JJ, Stoll BJ, Schonberger LB. Infectious disease hospitalizations in the United States. Clin Infect Dis. 2009;49:1025–35. doi: 10.1086/605562. [DOI] [PubMed] [Google Scholar]
- 3.Pinner RW, Teutsch SM, Simonsen L, Klug LA, Graber JM, Clarke MJ, et al. Trends in infectious disease mortality in the United States. JAMA. 1996;275:189–93. [PubMed] [Google Scholar]
- 4.Department of Health and Human Services; Indian Health Service (US) Trends in Indian health: 2002–2003 edition. Rockville (MD): IHS; 2009. [Google Scholar]
- 5.Andrews MM, Krouse SA. Research on excess deaths among American Indians and Alaska Natives: a critical review. J Cult Divers. 1995;2:8–15. [PubMed] [Google Scholar]
- 6.Holman RC, Curns AT, Cheek JE, Singleton RJ, Anderson LJ, Pinner RW. Infectious disease hospitalizations among American Indian and Alaska Native infants. Pediatrics. 2003;111:E176–82. doi: 10.1542/peds.111.2.e176. [DOI] [PubMed] [Google Scholar]
- 7.Holman RC, Curns AT, Kaufman SF, Cheek JE, Pinner RW, Schonberger LB. Trends in infectious disease hospitalizations among American Indians and Alaska Natives. Am J Public Health. 2001;91:425–31. doi: 10.2105/ajph.91.3.425. [DOI] [PMC free article] [PubMed] [Google Scholar]
- 8.Holman RC, Curns AT, Singleton RJ, Sejvar JJ, Butler JC, Paisano EL, et al. Infectious disease hospitalizations among older American Indian and Alaska Native adults. Public Health Rep. 2006;121:674–83. doi: 10.1177/003335490612100607. [DOI] [PMC free article] [PubMed] [Google Scholar]
- 9.LaVeist T. Minority populations and health: an introduction to health disparities in the United States. San Francisco: Jossey-Bass; 2005. [Google Scholar]
- 10.Singleton RJ, Holman RC, Yorita KL, Holve S, Paisano EL, Steiner CA, et al. Diarrhea-associated hospitalizations and outpatient visits among American Indian and Alaska Native children younger than five years of age, 2000-–2004. Pediatr Infect Dis J. 2007;26:1006–13. doi: 10.1097/INF.0b013e3181256595. [DOI] [PubMed] [Google Scholar]
- 11.Singleton RJ, Holman RC, Plant R, Yorita KL, Holve S, Paisano EL, et al. Trends in otitis media and myringtomy with tube placement among American Indian/Alaska Native children and the US general population of children. Pediatr Infect Dis J. 2009;28:102–7. doi: 10.1097/INF.0b013e318188d079. [DOI] [PubMed] [Google Scholar]
- 12.Holman RC, Curns AT, Cheek JE, Bresee JS, Singleton RJ, Carver K, et al. Respiratory syncytial virus hospitalizations among American Indian and Alaska Native infants and the general United States infant population. Pediatrics. 2004;114:e437–44. doi: 10.1542/peds.2004-0049. [DOI] [PubMed] [Google Scholar]
- 13.Murphy TV, Syed SB, Holman RC, Haberling DL, Singleton RJ, Steiner CA, et al. Pertussis-associated hospitalizations in American Indian and Alaska Native infants. J Pediatr. 2008;152:839–43. doi: 10.1016/j.jpeds.2007.11.046. [DOI] [PubMed] [Google Scholar]
- 14.Hennessy TW, Ritter T, Holman RC, Bruden DL, Yorita KL, Bulkow L, et al. The relationship between in-home water service and the risk of respiratory tract, skin, and gastrointestinal tract infections among rural Alaska Natives. Am J Public Health. 2008;98:2072–8. doi: 10.2105/AJPH.2007.115618. [DOI] [PMC free article] [PubMed] [Google Scholar]
- 15.Holman RC, Yorita KL, Singleton RJ, Cheek JE, Paisano EL, Butler JC, et al. Increasing rate of pneumonia hospitalizations among older American Indian and Alaska Native adults. J Health Disp Res Pract. 2007;2:35–48. [Google Scholar]
- 16.Peck AJ, Holman RC, Curns AT, Lingappa JR, Cheek JE, Singleton RJ, et al. Lower respiratory tract infections among American Indian and Alaska Native children and the general population of U.S. children. Pediatr Infect Dis J. 2005;24:342–51. doi: 10.1097/01.inf.0000157250.95880.91. [DOI] [PubMed] [Google Scholar]
- 17.Indian Health Service (US) Direct/CHS inpatient data: all-diseases, fiscal years 1998–2006, National Patient Information Reporting System. Albuquerque (NM): IHS; 2009. [cited 2011 Feb 1]. Also available from: URL: http://www.ihs.gov/NDW. [Google Scholar]
- 18.Healthcare Cost and Utilization Project. NIS database documentation: the Nationwide Inpatient Sample (NIS) [cited 2010 Jan 20]. Available from: URL: http://www.hcup-us.ahrq.gov/db/nation/nis/nisdbdocumentation.jsp.
- 19.Department of Health and Human Services; Indian Health Service (US) Regional differences in Indian health: 2002–2003 edition. Rockville (MD): IHS; 2008. [Google Scholar]
- 20.Kaufman SF. Utilization of IHS and tribal direct and contract general hospitals, FY 1996 and U.S. non-federal short-stay hospitals, 1996. Rockville (MD): Indian Health Service (US); 1998. [Google Scholar]
- 21.Rhoades DA, D'Angelo AJ, Rhoades ER. Data sources and subsets of the Indian population. In: Rhoades ER, editor. American Indian health: innovations in health care, promotion, and policy. Baltimore: Johns Hopkins University Press; 2000. pp. p. 93–102. [Google Scholar]
- 22.Simonsen L, Conn LA, Pinner RW, Teutsch S. Trends in infectious disease hospitalizations in the United States, 1980–1994. Arch Intern Med. 1998;158:1923–8. doi: 10.1001/archinte.158.17.1923. [DOI] [PubMed] [Google Scholar]
- 23.National Center for Health Statistics (US) International classification of diseases, 9th revision, clinical modification. 6th ed. Washington: Department of Health and Human Services, Public Health Service, Health Care Financing Administration (US); 2003. [Google Scholar]
- 24.Kleinbaum DG, Kupper LL, Muller KE, Nizam A. Applied regression analysis and multivariable methods. 3rd ed. Pacific Grove (CA): Duxbury Press; 1997. [Google Scholar]
- 25.Klein RJ, Schoenborn CA. Age adjustment using the 2000 projected U.S. population. Healthy People 2010 Stat Notes. 2001;(20):1–10. [PubMed] [Google Scholar]
- 26.National Center for Health Statistics (US) Bridged-race intercensal population estimates for July 1, 1990–July 1, 1999. 2004. [cited 2011 Feb 1]. Available from: URL: http://www.cdc.gov/nchs/nvss/bridged_race/data_documentation.htm#july1999.
- 27.National Center for Health Statistics (US) Estimates of the July 1, 2000–July 1, 2006, United States resident population from the vintage 2006 postcensal series by year, county, age, sex, race, and Hispanic origin, prepared under a collaborative agreement with the U.S. Census Bureau. 2007. [cited 2011 Feb 1]. Available from: URL: http://www.cdc.gov/nchs/nvss/bridged_race/data_documentation.htm#vintage2006.
- 28.Research Triangle Institute, SUDAAN®. Release 10.0. Research Triangle Park (NC): Research Triangle Institute; 2008. [Google Scholar]
- 29.Department of Health and Human Services; Indian Health Service; Public Health Service (US) Public Law 86-121: annual report for 2007. Rockville (MD): IHS; 2008. The Sanitation Facilities Construction Program of the Indian Health Service. [Google Scholar]
- 30.Census Bureau (US) Housing of American Indians on reservations—equipment and fuels. Washington: Census Bureau; 1995. [Google Scholar]
- 31.Bulkow LR, Singleton RJ, Karron RA, Harrison LH. Risk factors for severe respiratory syncytial virus infection among Alaska Native children. Pediatrics. 2002;109:210–6. doi: 10.1542/peds.109.2.210. [DOI] [PubMed] [Google Scholar]
- 32.Robin LF, Less PS, Winget M, Steinhoff M, Moulton LH, Santosham M, et al. Wood-burning stoves and lower respiratory illnesses in Navajo children. Pediatr Infect Dis J. 1996;15:859–65. doi: 10.1097/00006454-199610000-00006. [DOI] [PubMed] [Google Scholar]
- 33.Angstman S, Patten CA, Renner CC, Simon A, Thomas JL, Hurt RD, et al. Tobacco and other substance use among Alaska Native youth in western Alaska. Am J Health Behav. 2007;31:249–60. doi: 10.5555/ajhb.2007.31.3.249. [DOI] [PubMed] [Google Scholar]
- 34.Acton KJ, Burrows NR, Moore K, Querec L, Geiss LS, Engelgau MM. Trends in diabetes prevalence among American Indian and Alaska Native children, adolescents, and young adults [published erratum appears in Am J Public Health 2002;92:1709] Am J Public Health. 2002;92:1485–90. doi: 10.2105/ajph.92.9.1485. [DOI] [PMC free article] [PubMed] [Google Scholar]
- 35.Benfield T, Jensen JS, Nordestgaard BG. Influence of diabetes and hyperglycaemia on infectious disease hospitalization and outcome. Diabetologia. 2007;50:549–54. doi: 10.1007/s00125-006-0570-3. [DOI] [PubMed] [Google Scholar]
- 36.Singleton R, Holve S, Groom A, McMahon BJ, Santosham M, Brenneman G, et al. Impact of immunizations on the disease burden of American Indian and Alaska Native children. Arch Pediatr Adolesc Med. 2009;163:446–53. doi: 10.1001/archpediatrics.2009.44. [DOI] [PubMed] [Google Scholar]


