Abstract
Blood is a concentrated suspension of red blood cells (RBCs). Motion and deformation of RBCs can be analyzed based on knowledge of their mechanical characteristics. Axisymmetric models for single-file motion of RBCs in capillaries yield predictions of apparent viscosity in good agreement with experimental results for diameters up to about 8 micron. Two-dimensional simulations, in which each RBC is represented as a set of interconnected viscoelastic elements, predict that off-centre RBCs in an 8-micron channel take asymmetric shapes and drift toward the centre-line. Predicted trajectories agree with observations in microvessels of the rat mesentery. An isolated RBC initially positioned near the wall of a 20-micron channel is deformed into an asymmetric shape, migrates away from the wall, and then enters a complex tumbling motion with continuous shape change. Realistic simulation of multiple interacting RBCs in microvessels remains as a major challenge.
Keywords: Blood Flow, Capillary, Microcirculation, Red Blood Cell
1. Introduction
The microvessels, with diameters as small as 4 μm, are the terminal branches of the circulatory system. Blood is a concentrated suspension, containing 40–45% by volume of RBCs (erythrocytes) suspended in plasma. Because of their high concentration, the RBCs exert a strong influence on the flow properties of blood, both in bulk flow and in microvessels. In the absence of externally applied stresses, the shape of a normal human RBC is a biconcave disc with a diameter of 8 μm and a thickness of 2 μm [1]. RBCs are highly flexible and undergo large deformations during flow through microvessels, as shown in Figure 1. The mechanical properties of individual RBCs have been well described and this information provides a basis for developing quantitative theories for the flow behaviour of blood in the microcirculation. Here, a review is presented of previous work on this topic, and recent findings using a two-dimensional approach are presented.
Fig. 1.
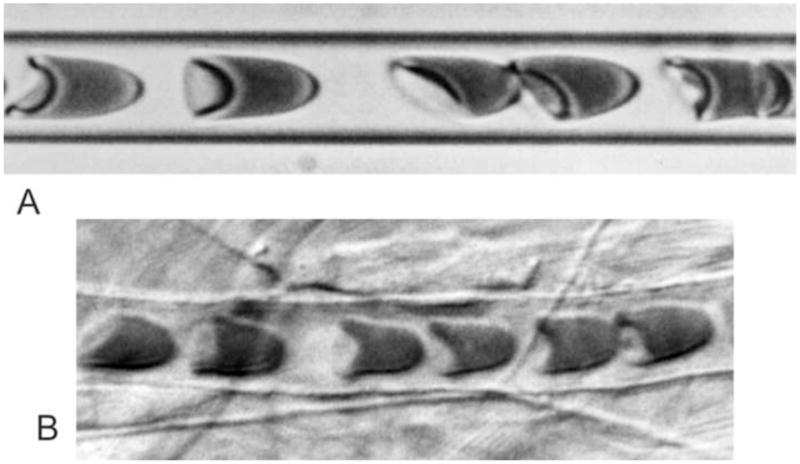
A. Human RBCs flowing in a glass tube with diameter 7 μm. B. Blood flow through a capillary in the rat mesentery with diameter approximately 7 μm. Flow is from left to right in each case.
2. Apparent blood viscosity in microvessels
For steady laminar flow of a Newtonian fluid in a cylindrical tube, the volume flow rate Q is related to the driving pressure Δp according to Poiseuille's Law:
| (1) |
where L is the tube length, D is the diameter and μ is the fluid viscosity. For blood flowing in microvessels, it is convenient to define the apparent viscosity as:
| (2) |
and the relative apparent viscosity as μrel = μapp/μp, where μp is the viscosity of the plasma or other suspending fluid.
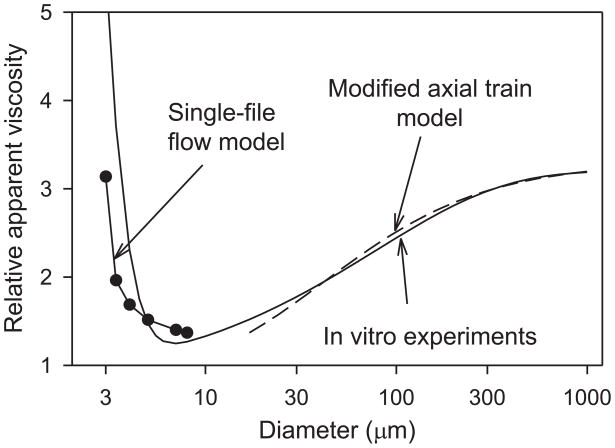
Experimental data on the apparent viscosity of blood flowing in narrow glass tubes were compiled by Pries et al. [2]. The apparent viscosity, as indicated by an empirical fit to the experimental findings, shows a striking decrease as the tube diameter is reduced from 1 mm (Figure 2), a phenomenon known as the Fåhraeus-Lindqvist effect [3].
Fig. 2.
Fåhraeus-Lindqvist effect in glass tubes. Solid curve: empirical fit to experimental data [2]. Dots: theoretical predictions [16]. Dashed curve: axial-train model (see text for explanation).
The basic cause of this phenomenon is the tendency of flowing RBCs to migrate away from the vessel wall, creating a layer of plasma surrounding a column of flowing cells [4]. A simple two-phase 'modified axial train' model of blood flow [5] can be used to illustrate the effect of such a layer on apparent viscosity. In this model, a cylindrical central ‘core’ region containing RBCs, assumed to have viscosity μc, is surrounded by a layer of plasma with viscosity μp, where μc> μp. The apparent viscosity can then be obtained as:
| (3) |
where λ is the ratio of the radius of the core region to the tube radius, i.e., λ = 1 − δ /r where δ is the width of the cell-free plasma layer and r is the tube radius. As δ increases, λ decreases from 1. Because of its fourth-power dependence, the factor 1 − λ 4 is sensitively dependent on λ and a relatively narrow plasma layer can have a substantial impact on apparent viscosity. Physically, the presence of a plasma layer decreases the local viscosity in the region near the wall where viscous energy dissipation would otherwise be concentrated. In Figure 2, a cell-free layer with a fixed width δ = 1.8 μm is assumed, resulting in good agreement between the model and the experimental curve for diameters ranging from 30 to 1000 μm.
It should be emphasized that δ is a fitted parameter and its value is not derived from a consideration of RBC dimensions and properties. A major challenge is the development of theories to predict the effective thickness of the cell-free layer as a function of hematocrit, based on a consideration of the mechanics of multiple interacting RBCs.
3. Mechanical properties of RBCs
The mechanical properties of human RBCs have been studied extensively [6, 7]. The interior of the cell is a concentrated haemoglobin solution, which behaves as a viscous incompressible fluid. The cell membrane consists of a lipid bilayer and a cytoskeleton which consists of a network of protein molecules. The membrane strongly resists area changes, and its elastic modulus of isotropic dilation is ~500 dyn/cm, whereas its modulus of shear deformation, k, is about 0.006 dyn/cm. The lipid molecules that comprise the lipid bilayer can slide past each other relatively easily, but resist being pulled apart. The cell membrane has a bending modulus, B, of about 1.8 × 10⁻¹² dyn·cm [8]. The significance of bending resistance for cell deformation may be assessed by constructing a dimensionless parameter B/(kL2) where L is a length scale. If L = 1 μm, then B/(kL2) = 0.03. This implies that effects of bending resistance are relatively small except in regions of high curvature, with radius of curvature substantially less than 1 μm. The membrane also possesses a viscous resistance to transient in-plane shear deformations. The viscoelastic behaviour of the membrane in shear can be represented by a Kelvin-Voigt solid model, in which the total shear stress is represented as the sum of viscous and elastic contributions [9]. The viscous component arises from the fluid-like behaviour of the lipid bilayer, and the elastic component arises from the stretching of the cytoskeleton.
4. RBC motion in capillaries
Two early theoretical analyses of RBC motion in capillaries appeared in the late 1960s [10, 11]. In both of these analyses, cell shapes were considered to have axial symmetry and lubrication theory was used to describe the motion of the suspending fluid (plasma) in the spaces between the RBCs and the capillary walls. Analyses based on these assumptions have successfully predicted the resistance to blood flow in glass tubes with capillary dimensions.
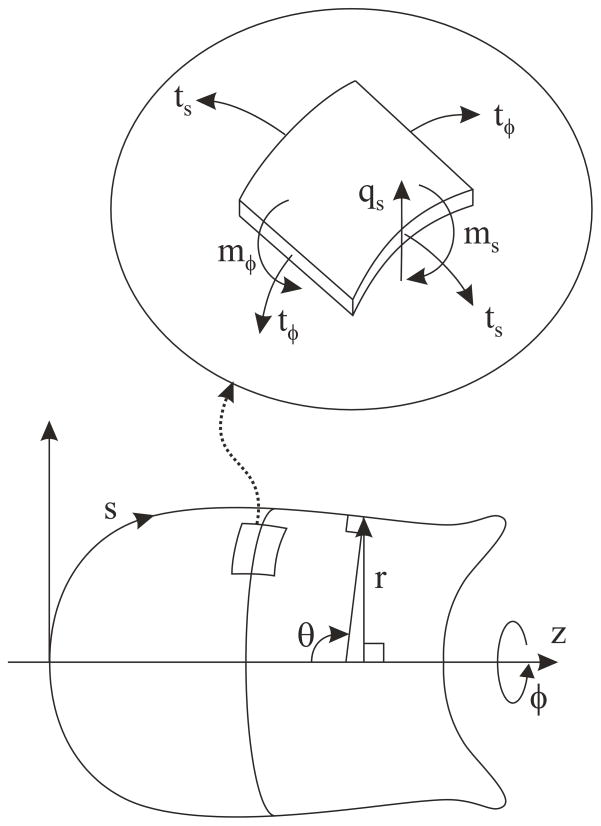
Axisymmetric cell shapes can be described in terms of r(s), distance from the axis, and θ(s), angle between the normal to the membrane and the axis, where (r, θ, ϕ) are cylindrical polar coordinates and s is arc length, measured from the nose of the cell (Figure 3). Membrane strain is conveniently expressed in terms of stretch ratios or extensions λs = ds/ds0and λϕ = r/r0 relative to the unstressed shape. Subscript sdenotes components in a plane containing the axis, and ϕ denotes azimuthal components. Subscript 0 denotes corresponding values for the same material element in the unstressed state. The components of in-plane membrane curvature are ks(s) and kϕ(s), the bending moments are ms(s) and mϕ(s), and the components of membrane tension are ts(s) and tϕ(s). The shear force per unit length is qs(s).
Fig. 3.
Variables describing geometry and stress resultants in an axisymmetric shell.
The stresses in the membrane can be evaluated using constitutive relations proposed by Evans and Skalak [12]. The bending moment is assumed to be isotropic and proportional to the increase in total curvature of the surface:
| (4) |
where B = 1.8 × 10⁻¹² dyn·cm is the bending modulus. Viscous resistance to membrane bending is assumed to be negligible. The membrane tensions can be represented in terms of mean (isotropic) and deviatoric (shear) components:
| (5) |
The membrane is nearly incompressible in a two-dimensional sense, so the deformation is locally area preserving, i.e., λs λϕ = 1. A consequence of this assumption is that the mean tension, tm, cannot be expressed in terms of membrane deformation. It depends on the forces acting on the membrane and is analogous to the hydrostatic pressure in incompressible fluid flow. The deviatoric component is
| (6) |
The first term represents the viscous component of the membrane shear stress, and μm is the membrane shear viscosity, about 0.001 dyn·cm [7]. The second term is the elastic component of membrane shear stress [12], where κ = 0.006 dyn/cm is the shear modulus of the membrane. These two terms represent the membrane's viscoelastic behaviour in transient shear deformations as a Kelvin solid model [9]. The third term was not included in the equations proposed by Evans and Skalak [12], but is implicit in the assumptions of their model [13].
The equations for equilibrium of normal stress, tangential stress and bending moments for an axisymmetric shell are [14]:
| (7) |
| (8) |
| (9) |
where p is the hydrostatic pressure difference across the membrane (external minus internal) and τ is the fluid shear stress acting on the membrane produced by the motion of the external fluid. These forces can be calculated using lubrication theory to describe the motion of the fluid around the cell. According to the assumptions of lubrication theory, the pressure is p(z) and the axial velocity u(σ, z) of fluid in the gap satisfies
| (10) |
in cylindrical coordinates (σ, ϕ, z) moving with the cell, where μp is the fluid viscosity. Also, u = 0 on the cell surface, σ= r(z), and u = u0 at the wall, σ= a where −u0 is the cell velocity and a is the vessel radius. The ‘leakback,’ i.e., the volume flow rate of fluid relative to the cell per unit circumference, is given by
| (11) |
Since the suspending fluid is incompressible, q0 is independent of z. From the above relationships, expressions can be obtained for the pressure gradient and shear stress acting on the cell surface in terms of r(z) and q0, and a system of ordinary differential equations can be derived for the variables describing cell shape and membrane stresses. These equations can be solved numerically to predict steady-state RBC shapes under a variety of conditions [15]. Good agreement is found between predicted apparent viscosity and corresponding experimental observations [15–18], as shown in Figure 2.
5. Two-dimensional RBC model
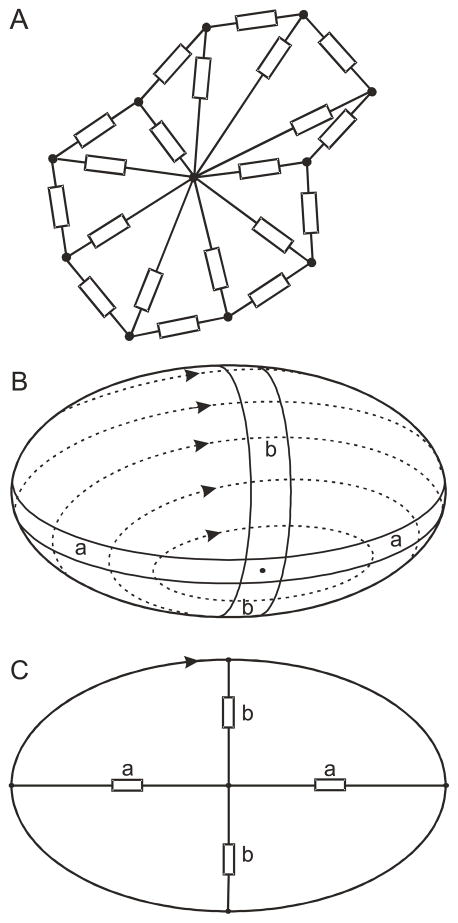
Several aspects of RBC motion in microvessels cannot be well described by axisymmetric models. For such cases, we developed a two-dimensional approach in which the cross-sectional shape of each RBC is represented by a set of viscoelastic elements on the perimeter and in the interior of the cell (Figure 4A) [19]. The internal elements represent both the internal viscosity of the cell and the cell membrane's resistance to three-dimensional out-of-plane deformations. Membrane bending elasticity is represented by an elastic resistance at the nodes.
Fig. 4.
A. Two-dimensional model for RBC. Rectangles represent viscoelastic elements. B, C. Relationship between internal viscous elements and membrane deformation in tank-treading. Bands of membrane (a,b) alternately shorten and elongate during tank-treading.
When placed in simple shear flow of high-viscosity fluid, RBCs exhibit stable orientations and cyclic ‘tank-treading’ motion of the membrane around the cell interior. In this motion, a band of membrane around the cell is alternately lengthened and shortened (Figure 4B). This continuous deformation results in viscous energy dissipation in the membrane. The internal viscous elements represent resistance to this motion. The parameters of the model were determined by matching model behaviour to observations of tank-treading. In particular, the variations with applied shear rate of both cell length and tank-tread frequency were matched with corresponding experimental observations. This approach allowed estimation of both the viscous and elastic parameters of the model.
At very low shear rates, a transition from tank-treading to tumbling behaviour is observed under the conditions described above, as a result of inhomogeneity in the elastic properties of the cell membrane [1, 20]. However, this effect is neglected in the present work, in which relatively high shear rates are considered.
The fluid flow around the model cell results in loadings on the external elements. The longitudinal (tension) force ti(s), the transverse (shear) force qi(s) and the bending moment mi(s) acting in external element i are consequently functions of distance s along the element. The equations of mechanical equilibrium for this system are given by Secomb et al. [19]. RBCs deform at effectively constant volume. This property is represented by assigning an internal pressure that depends on the cell area. The suspending medium is a viscous incompressible fluid in Stokes flow. A finite element package (FlexPDE, PDE Solutions Inc., Antioch, CA) was used to solve the resulting system of coupled equations. When a cell closely approaches the domain boundary, the mesh generator controls the aspect ratio of the elements, so that a large number of small elements are used. The initial shape was assumed to be circular, so as not to bias the subsequent evolution of cell shape.
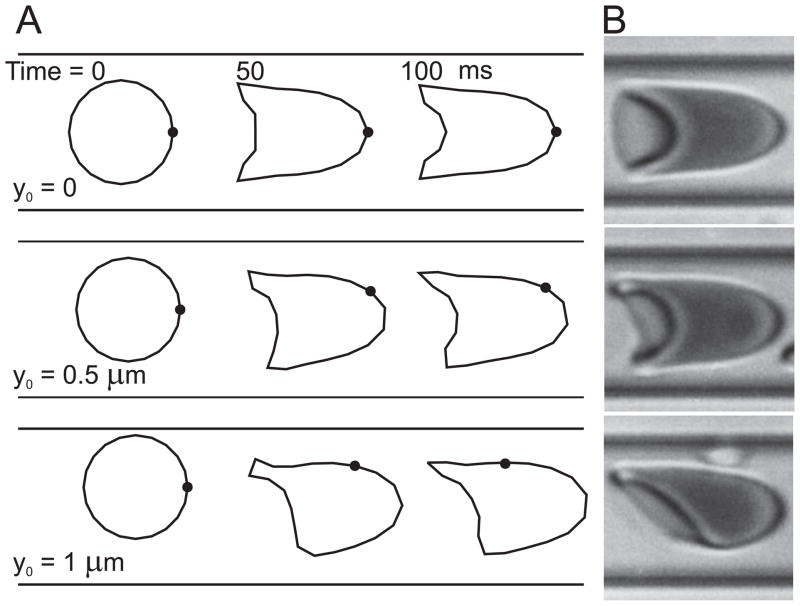
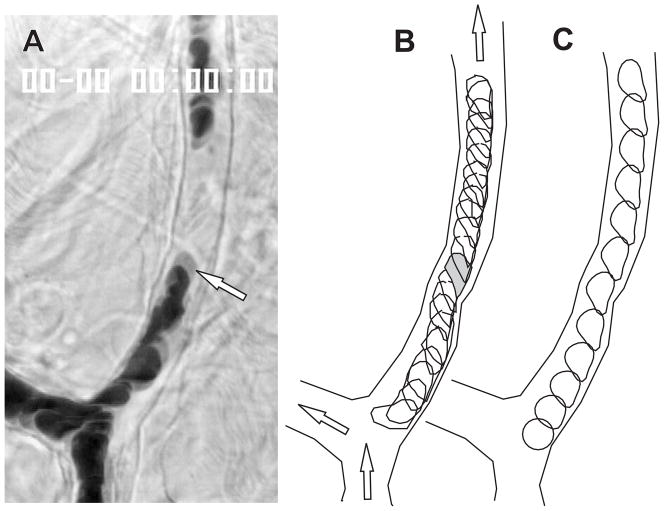
In Figure 5, predictions for a single cell flowing along an 8-μm channel (A) are compared with experimental observations in glass tubes (B). In these and the following simulations, the suspending fluid viscosity was set to 1 cP, close to plasma viscosity. Good qualitative agreement with observed shapes is seen. If the initial position of the cell is on the centre-line of the channel (y0 = 0), the cell remains on the centre-line and the cell shape evolves to a two-dimensional 'parachute'-like shape over a period of about 100 ms. If the cell is initially placed off-centre (y0= 0.5, 1 μm), it drifts towards the centre-line while developing an asymmetric 'slipper'-like shape. In all three cases, the cell maintains a stable orientation and does not show a tendency to tumble. However, the membrane executes a slow tank-treading motion around the cell, as shown by the position of the membrane-bound marker dots in Figure 5A. The eventual position of the cell centre-of-mass remains slightly displaced from the channel centre-line, as a result of the shape asymmetry [19]. Further simulations were performed using a two-dimensional geometry derived from experimental observations of the rat mesentery( Figure 6)[19] . Computed trajectories and shapes of RBCs showed good agreement with observed motions obtained by analysis of successive video frames.
Fig. 5.
Predicted motion and deformation of cells in an 8-μm channel. Flow rate is adjusted so that cell velocity is approximately 1.25 mm/s. Initial cell shape is a circle with radius 2.66 μm. Results are presented for cells with initial displacements 0, 0.5, 1 μm from the centre-line. A. Predicted cell shapes initially and after 50 and 100 ms. Dot on cell outline represents a node fixed in the cell. B. Observed human RBC shapes in a single glass capillary with diameter 7 μm. Three cells are shown with varying orientations and degrees of asymmetry.From Secomb et al. [19].
Fig. 6.
Observations and simulations of RBC motion in rat mesenteric microvessels. A. Microvessels selected for observation. Arrow: RBC whose motion was tracked. B. Superimposed digitized outlines of vessel wall and of selected isolated cells in successive video frames at 10-ms intervals. Arrows show flow directions. C. Predicted cell shapes at 20-ms intervals. From Secomb et al. [19].
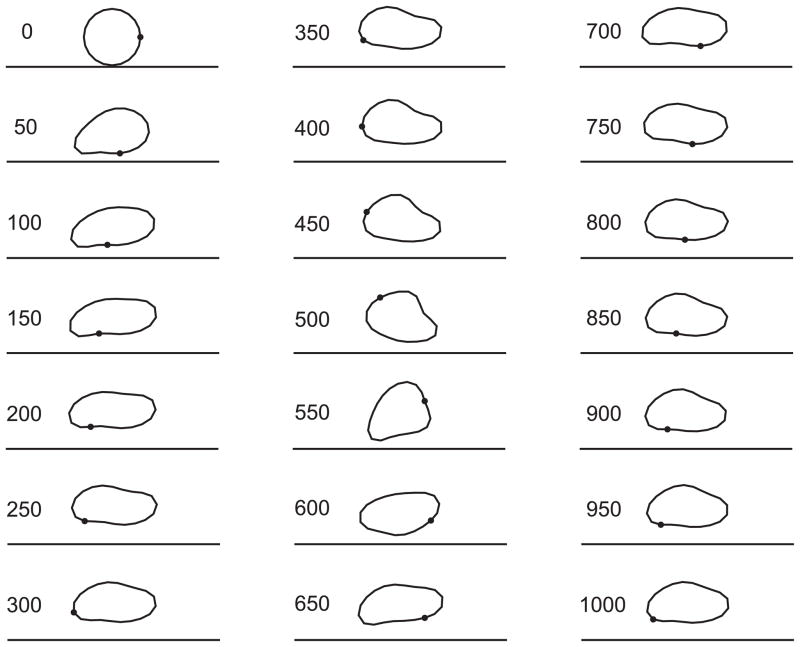
Figures 7 and 8 show results of simulations for the motion of a single RBC placed near the wall of a channel with width 20 μm, subject to a flow with a centre-line velocity of 1 mm/s. The computational domain length was 40 μm, so that the domain size was relatively large compared to the particle size, and the motion of the particle was governed primarily by interactions with the imposed flow and with the adjacent solid boundary. If the particle were constrained to remain circular, no lateral migration would occur, as can be shown from symmetry arguments based on the reversibility of Stokes flow. However, the particle is deformed during the first 100 ms by the action of the shear flow combined with the extra drag on the part of the particle close to the wall resulting from the thin lubrication layer there. The symmetry of the particle shape is broken, and it can then exhibit lateral migration [21].
Fig. 7.
Predicted RBC shapes and positions during lateral migration in a 20-μm channel, with flow driven by an imposed pressure gradient of −2000 dyn/cm3. Shear rate at the wall in the absence of particle is 200 s−1and centre -line velocity is 1 mm/s. Initial cell shape is a circle with radius 2.66 μm and centre 2.8 μm from the wall. Shapes are shown at 50 -ms intervals. Times since initiation of motion are indicated in ms.
Fig. 8.
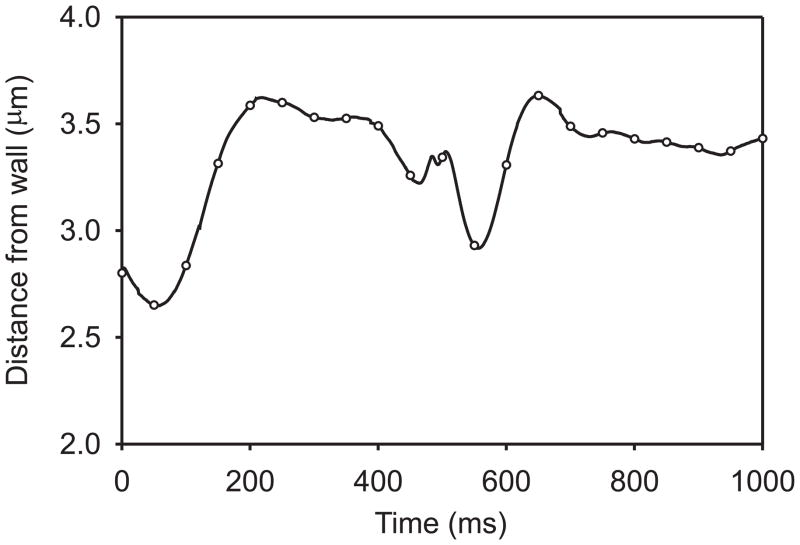
Time-dependent lateral migration of a RBC in a 20-μm channel, with flow driven by an imposed pressure gradient of −2000 dyn/cm3. Distance of membrane centre of mass from wall is plotted. Symbols on curve correspond to 50-ms intervals at which cell shape is shown in Figure 7.
During the next 100 ms of the motion, the particle maintains a stable orientation with its major axis pointing slightly away from the wall in the flow direction. It drifts away from the wall, and exhibits a slow tank-treading motion. During this phase, the orientation is stabilized by the proximity to the wall. When suspended in unbounded shear flows of low-viscosity media, however, red blood cells do not show a stable orientation [22], but enter a periodic tumbling motion. In the present example, a tumbling motion also develops, in which short periods of rapid rotation (such as occurs here in the interval between 500 ms and 600 ms) are interspersed with longer periods of slowly changing orientation and gradual shape change. The resulting trajectory of the particle is complex, as indicated in Figure 8 which shows the distance of the membrane centre of mass from the wall. The particle does not enter a periodic motion within the interval of the simulation. Further analysis of this motion is needed in order to understand its significance for blood rheology. For example, it is not known whether the particle motion eventually becomes periodic, or whether the particle continues to drift away from the wall during the tumbling motion. Considering a purely viscous vesicle with an inextensible membrane, Danker et al. [23] predicted migration toward the centre-line of Poiseuille flow, in the absence of wall effects. It remains to be explored whether such migration occurs for a viscoelastic particle, as considered in the present model.
6. Conclusions
Knowledge of the mechanical properties of RBCs provides a basis for developing quantitative theories for the flow behaviour of blood in the microcirculation. Analysis of RBC motions in blood flow is complicated by the high concentration and high deformability of the cells. In living microvessels, a layer of macromolecules adjacent to the vessel wall, known as the endothelial surface layer (ESL), has a substantial effect on flow resistance and on cell deformation and motions [24–26].
For single-file flow in capillaries, models assuming axisymmetric cell shapes yield a good approximation to observed rheological properties in glass tubes. For analyzing asymmetric cell motions, a two-dimensional approach has yielded good agreement with experimental observations. This approach can be used to analyze drift of an individual RBC away from a solid boundary in a channel flow, an effect which contributes to the formation of a cell-free layer at the wall. In a concentrated suspension, the inward migration would be opposed by particle-particle interactions, which tend to drive particles out of regions of high concentration, in a phenomenon known as shear-induced diffusion [27]. The two-dimensional model presented here allows analysis of such phenomena involving flow-induced cell-cell interactions at reasonable computational cost, and such studies are in progress. Corresponding three-dimensional analyses for model RBCs with realistic physical properties, including accurate resolution of the fluid velocity field, remain a formidable computational challenge.
Acknowledgments
This work was supported by NIH Grant HL034555.
Footnotes
Publisher's Disclaimer: This is a PDF file of an unedited manuscript that has been accepted for publication. As a service to our customers we are providing this early version of the manuscript. The manuscript will undergo copyediting, typesetting, and review of the resulting proof before it is published in its final citable form. Please note that during the production process errors may be discovered which could affect the content, and all legal disclaimers that apply to the journal pertain.
References
- 1.Fischer TM. Shape memory of human red blood cells. Biophys J. 2004;86:3304–3313. doi: 10.1016/S0006-3495(04)74378-7. [DOI] [PMC free article] [PubMed] [Google Scholar]
- 2.Pries AR, Neuhaus D, Gaehtgens P. Blood viscosity in tube flow: dependence on diameter and hematocrit. American Journal of Physiology. 1992;263:H1770–H1778. doi: 10.1152/ajpheart.1992.263.6.H1770. [DOI] [PubMed] [Google Scholar]
- 3.Fahraeus R, Lindqvist T. The viscosity of the blood in narrow capillary tubes. American Journal of Physiology. 1931;96:562–568. [Google Scholar]
- 4.Goldsmith HL, Cokelet GR, Gaehtgens P. Robin Fahraeus: evolution of his concepts in cardiovascular physiology. Am J Physiol. 1989;257:H1005–H1015. doi: 10.1152/ajpheart.1989.257.3.H1005. [DOI] [PubMed] [Google Scholar]
- 5.Secomb TW. Mechanics of blood flow in the microcirculation. Symp Soc Exp Biol. 1995;49:305–321. [PubMed] [Google Scholar]
- 6.Skalak R. Rheology of red blood cell membrane. In: Grayson J, Zingg W, editors. Microcirculation. I. New York: Plenum; 1976. pp. 53–70. [Google Scholar]
- 7.Hochmuth RM, Waugh RE. Erythrocyte membrane elasticity and viscosity. Annu Rev Physiol. 1987;49:209–219. doi: 10.1146/annurev.ph.49.030187.001233. [DOI] [PubMed] [Google Scholar]
- 8.Evans EA. Bending elastic modulus of red blood cell membrane derived from buckling instability in micropipet aspiration tests. Biophys J. 1983;43:27–30. doi: 10.1016/S0006-3495(83)84319-7. [DOI] [PMC free article] [PubMed] [Google Scholar]
- 9.Evans EA, Hochmuth RM. Membrane viscoelasticity. Biophys J. 1976;16:1–11. doi: 10.1016/S0006-3495(76)85658-5. [DOI] [PMC free article] [PubMed] [Google Scholar]
- 10.Barnard ACL, Lopez L, Hellums JD. Basic theory of blood flow in capillaries. Microvascular Research. 1968;1:23–34. doi: 10.1016/s0026-2862(73)80003-2. [DOI] [PubMed] [Google Scholar]
- 11.Lighthill MJ. Pressure-forcing of tightly fitting pellets along fluid-filled elastic tubes. Journal of Fluid Mechanics. 1968;34:113–143. [Google Scholar]
- 12.Evans EA, Skalak R. Mechanics and Thermodynamics of Biomembranes. Boca Raton, Florida: CRC Press; 1980. [Google Scholar]
- 13.Secomb TW. Interaction between bending and tension forces in bilayer membranes. Biophys J. 1988;54:743–746. doi: 10.1016/S0006-3495(88)83010-8. [DOI] [PMC free article] [PubMed] [Google Scholar]
- 14.Timoshenko S. Theory of Plates and Shells. New York: McGraw-Hill; 1940. [Google Scholar]
- 15.Secomb TW, Skalak R, Ozkaya N, Gross JF. Flow of axisymmetric red blood cells in narrow capillaries. Journal of Fluid Mechanics. 1986;163:405–423. [Google Scholar]
- 16.Secomb TW. Flow-dependent rheological properties of blood in capillaries. Microvascular Research. 1987;34:46–58. doi: 10.1016/0026-2862(87)90078-1. [DOI] [PubMed] [Google Scholar]
- 17.Secomb TW. Red blood cell mechanics and capillary blood rheology. Cell Biophys. 1991;18:231–251. doi: 10.1007/BF02989816. [DOI] [PubMed] [Google Scholar]
- 18.Secomb TW. Mechanics of red blood cells and blood flow in narrow tubes. In: Pozrikidis C, editor. Hydrodynamics of Capsules and Cells. Boca Raton, Florida: Chapman & Hall/CRC; 2003. pp. 163–196. [Google Scholar]
- 19.Secomb TW, Styp-Rekowska B, Pries AR. Two-dimensional simulation of red blood cell deformation and lateral migration in microvessels. Ann Biomed Eng. 2007;35:755–765. doi: 10.1007/s10439-007-9275-0. [DOI] [PubMed] [Google Scholar]
- 20.Skotheim JM, Secomb TW. Red blood cells and other nonspherical capsules in shear flow: oscillatory dynamics and the tank-treading-to-tumbling transition. Phys Rev Lett. 2007;98:078301. doi: 10.1103/PhysRevLett.98.078301. [DOI] [PubMed] [Google Scholar]
- 21.Cantat I, Misbah C. Lift force and dynamical unbinding of adhering vesicles under shear flow. Physical Review Letters. 1999;83:880–883. [Google Scholar]
- 22.Keller SR, Skalak R. Motion of a tank-treading ellipsoidal particle in a shear flow. Journal of Fluid Mechanics. 1982;120:27–47. [Google Scholar]
- 23.Danker G, Vlahovska PM, Misbah C. Vesicles in Poiseuille flow. Phys Rev Lett. 2009;102:148102. doi: 10.1103/PhysRevLett.102.148102. [DOI] [PubMed] [Google Scholar]
- 24.Pries AR, Secomb TW, Gessner T, Sperandio MB, Gross JF, Gaehtgens P. Resistance to blood flow in microvessels in vivo. Circulation Research. 1994;75:904–915. doi: 10.1161/01.res.75.5.904. [DOI] [PubMed] [Google Scholar]
- 25.Secomb TW, Hsu R, Pries AR. A model for red blood cell motion in glycocalyx-lined capillaries. Am J Physiol. 1998;274:H1016–H1022. doi: 10.1152/ajpheart.1998.274.3.H1016. [DOI] [PubMed] [Google Scholar]
- 26.Pries AR, Secomb TW, Gaehtgens P. The endothelial surface layer. Pflugers Arch. 2000;440:653–666. doi: 10.1007/s004240000307. [DOI] [PubMed] [Google Scholar]
- 27.Leighton D, Acrivos A. The shear-induced migration of particles in concentrated suspensions. Journal of Fluid Mechanics. 1987;181:415–439. [Google Scholar]


