Summary
Micrometer-scale three-dimensional (3D) data from fluorescence microscopes offers unique insight into cellular morphology and function by resolving subcellular locations of fluorescent dyes and proteins. To increase field-of-view size while using a high-resolution multiphoton microscope, we have created an automated system of rapidly acquiring overlapping image stacks from multiple fields-of-view along a non-planar tissue surface. Each image stack is acquired only between the surface and the maximal penetrating depth, as determined by the image signal to background ratio (SBR). This results in the acquisition of the volume containing visible tissue along the tissue surface, excluding the empty volume above the tissue and the volume beyond the maximum imaging depth within the tissue. The automated collection of overlapping volumes is followed by reconstruction that can efficiently generate a single 3D volume of the tissue surface. This approach yields data spanning multiple millimeters at micrometer resolution that is faster while requiring less work from the microscope operator. The advantages of the system are demonstrated by acquisition of data from intact, unfixed organs without a coverglass both in vivo and in situ.
Introduction
A key advantage of multiphoton microscopy is its deep penetration and high collection efficiency permitting imaging at depths of several hundred micrometers below the tissue surface (Denk et al., 1990). Imaging depth has been shown to be further improved by correcting for aberrations, caused by the tissue, in the point spread function of the excitation light (Sherman et al., 2002, Debarre et al., 2009), or by collecting all emitted fluorescence normally scattered outside the light cone of the objective (Combs et al., 2010). This ability to image at greater depths permits the acquisition of 3D data from thick samples in which morphology has not been disrupted by fixation or sectioning.
Objectives that have numerical apertures suitable for deep multiphoton imaging tend to have higher magnification, which typically limits the size of the field-of-view to less than 1 mm2. To collect information from larger volumes, a common approach is to acquire a Cartesian grid of overlapping image stacks and use software to stitch the image stacks into a single 3D dataset (Emmenlauer et al., 2009, Preibisch et al., 2009). However, the software controlling most microscopes will acquire the tiles used to assemble such a volume only in a rectangular prism of a given length, width, and height. This approach works well if the sample is planar or if it has been compressed up against a planar surface such as a coverglass. The utility of large-scale imaging using mosaic tiling has been demonstrated in fixed immunolabeled samples (Chow et al., 2006) and dyed unfixed slices (Losavio et al., 2008) mounted on glass slides.
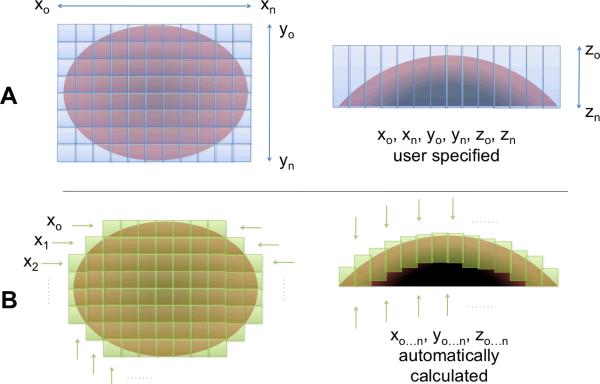
However, many biological samples have non-planar surfaces and the accuracy of morphology measurements of cellular structures may suffer if compressed by rigid restraints. If no tissue compression is used, as in an in vivo setup (Rothstein et al., 2006), then the imaging of non-planar surfaces with a conventional tiling procedure with preset distances in X, Y, and Z requires capturing data for a number of imaging planes that contain no visible tissue, either above the tissue surface or deep in tissue beyond the maximal imaging depth (Figure 1, A). This increases the time needed to acquire a dataset and the size and of that dataset. Furthermore, in cases where there are large variations in depth along the tissue surface, the working distance of the objective will limit the thickness of a volume that conventional tiling procedures could capture.
Figure 1.
A conventional tiling program requires imaging a rectangular prism-shaped volume (A) where both X, Y, and Z boundaries must be defined by the microscope user. The ROVAR program determines the number of tiles needed to acquire a volume of given depth across a surface (B), and calculates the starting and stopping depth of Z stack to coincide with visible tissue. This results in a reduction in time and disk space required to collect large field-of-view data.
To overcome the limitations of conventional tiling procedures in the acquisition of high-resolution 3D data in fresh or in vivo tissue, a system has been developed to automate the rapid acquisition of image stacks along the surface of a non-planar tissue. Briefly, a multiphoton microscope is set to acquire images in a time series. Image data is transmitted from the microscope computer to a second computer in real time using an open-source script and this second computer also controls a 3D motorized sample stage. A software application was written to analyze images, determine tissue boundaries, and move the stage to acquire overlapping tiles along the tissue surface (Figure 1, B).
The rationale for the automated approach was to reduce overall imaging time needed to acquire and reconstruct large 3D datasets along the exposed surface of fresh tissue, as well as reduce the labor required to set up an acquisition by the microscope user. Other approaches, such as novel objective designs (McMullen & Zipfel, 2010) that increase the area covered in a single FOV during multiphoton microscopy, could be used synergistically with an automation system such as the one presented to enable high-resolution 3D imaging of tissue on a still larger scale, such as whole-organ clinical pathology.
Methods and Materials
Real-time imaging hardware setup
A commercial multi-photon microscope (Leica SP5, Leica Microsystems, Bannockburn, IL) includes a Windows PC running the user interface software that is connected to a separate microscope device via fiber-optic network connection. The microscope control software on the Windows PC sends commands to the microscope device and then receives images from the microscope device without performing any additional real-time image processing. To make a copy of this image stream available for real-time analysis, a program was created to intercept communication on the fiber optic network port and send a duplicate copy of all or part of the image stream to a network port on another computer. This intercept program is written in Python programming language and runs in the background on the user interface computer. The source code of this image intercept program is available upon request.
The intercept program sent images to a computer running LabVIEW 2009 (National Instruments, Austin, TX) via standard 1 gigabit-per-second ethernet interface. This computer ran a software application for rapid overlapping volume acquisition and reconstruction (ROVAR), described below. The ROVAR computer used drivers provided by Leica to control the X and Y position of the microscope stage and objective nosepiece via a USB interface. A USB data acquisition peripheral (USB-6215, National Instruments) received TTL triggers from the microscope at the beginning of each new image. The computer running the ROVAR software had no additional hardware requirements beyond the USB ports and 1 Gbps network interface port.
Animal Preparation
BALB-C mice were anaestatized by ventilation via an anaestesia box and a nose cone with a mixture 2.5% isoflurane in room air. Di-8-ANEPPS (Invitrogen, Carlsbad, CA) was used to dye vasculature as described previously (Rothstein et al., 2006, Jobsis et al., 2007). The tail vein was cannulated with heparin saline and 0.1 mL of 10mM ANEPPS solution dissolved in a 50%-50% mixture of DMSO and EtOH was injected at 0.01 mL/min with a syringe pump (HA11+, Harvard Apparatus, Holliston, MA). For in vivo experiments, the mouse was restrained on a heated platform that could be mounted on the microscope stage, and the hind-limb was restrained by clamping near the ankle joint. The tibialis anterior muscle was exposed by resecting the skin and peeling away the top layer of the myofascial collagen sheath by gentle abrasion. Surgical site was sealed using an iso-osmotic, pH-neutral optical coupling gel made with 0.3% carbomer (940, Snowdrift Farms, Tucson, AZ) at pH 7.0 with 300 mM sorbitol, with refractive index similar to that of water. For ex vivo experiments tissues were removed from the body after dye had circulated for more than 15 minutes. Tissues were secured to the bottom of an silicone-lined dish with insect pins (F.S.T., Foster City, CA) and submerged in 0.9% saline solution.
Imaging parameters
A Ti:sapphire laser (MaiTai DS, Spectra-Physics/Newport, Mountain View, CA) was tuned to 800nm, producing ~3W. Laser power output was set to 25% which was measured after the electro-optical modulator at 400mW. The resonant scanning mirror was used to achieve a line speed of 8000 Hz, which gave 14 frames per second at 512 × 512 pixels. The non-descanned detectors were used with a 515 dichroic mirror followed by a 395–405 bandpass for second harmonic generation (collagen) and 540–615 bandpass for vascular dye (ANEPPS). A water-dipping 20×, 1.0 NA lens (Leica Microsystems) was used both in saline-submerged and gel-coupled experiments. Any of the non-descanned image channels could be used for real-time analysis, and for the experiments presented the ANEPPS-dyed vasculature channel was selected for real-time analysis.
ROVAR Software Overview
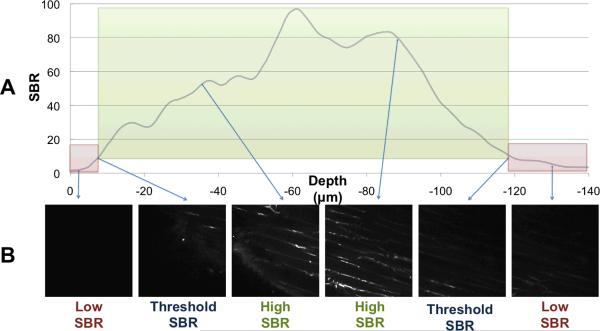
A program was written in LabVIEW and designed to simplify selection of the volume of interest by setting the parameters used for an automatic tiling algorithm. A measurement of image signal-to-background ratio (SBR) was used to determine when visible tissue was present within the focal plane. SBR thresholds were defined at the tissue's surface and at the maximum imaging depth by representative background and tissue boundary images selected by the user. For the data presented, the threshold SBR was between 3-fold and 7-fold in each case, and these thresholds were applied at each field-of-view in order to acquire images only between the tissue surface and the maximum imaging depth (Figure 2). The program repeatedly adjusted the field-of-view in the X and Y dimension to acquire overlapping volumes along the tissue surface until the total imaging volume dimensions had met user-defined limits. This avoided the time consuming and unnecessary imaging of empty space above the tissue surface or imaging beyond the maximal imaging depth in the tissue. An ImageJ (NIH, Bethesda, MD) plug-in was used to take the output of the acquisition program and reconstruct the final volume.
Figure 2.
ROVAR uses image SBR to calculate starting and ending depth of each Z stack At each location in X-Y that is part of the imaging volume, the SBR is calculated at each depth. A threshold of SBR is set at which to locate the surface and the maximum imaging depth (A). Thus the image stack that is saved is only of high-SBR images at or above the threshold SBR (B).
ROVAR Acquisition Process
In order to set the algorithm parameters prior to volume acquisition, the user is prompted to select three images at different focal depths. First, the user adjusts the focus of the microscope until the focal plane is positioned in the space above the tissue surface. The image should contain only a low-variance information without much contrast, thus a low SBR used to characterize the typical background profile corresponding to the specific imaging configuration. The pixel intensities of the background image are summed to compute a root mean squared (RMS) value. The RMS value of the background image is treated as the amplitude of the `signal when computing the SBR against any subsequent image RMS value with the following equation:
Next, the user adjusts the focus of the microscope to locate two more images used to define the threshold between images that contain visible tissue and images that are at background SBR. The first of these images is located near the surface of the tissue, and should contain the minimum amount of visible fluorescence that the user would like to capture in the overall acquisition volume. During automatic volume acquisition, the SBR between this tissue boundary image and the non-tissue image is used as the surface SBR threshold when searching for the non-planar surface of the tissue. The second of these images is typically located in a focal plane within the tissue where light scattering or deterioration in the point-spread-function of excitation light has reduced the fluorescence signal below a useable level. The SBR between this reference maximum depth image and the reference background image is used when acquiring images along the focal axis in order to halt stack acquisition at maximal imaging depth for each stack. Thus, during the overall volume acquisition, the SBR is calculated for each acquired image in a stack, and compared against a threshold value to determine if the image contains visible tissue. If the SBR between an image and the background image is less than the threshold value, the image is not acquired. If the SBR is greater than the threshold value, the image is included in volume reconstruction.
Once the two boundary thresholds are defined, the X-Y stage and the microscope focal plane are moved to a starting location at one edge of the desired tissue volume. The software begins searching for the surface of the tissue along the Z-axis at that X-Y position. When each new image is captured, the SBR is computed to determine whether it contains visible tissue. If the SBR is above the surface SBR threshold, the program repositions the focal plane to a shallower position (i.e. towards the tissue surface) stepwise by a user defined distance. Motion along the Z-axis continues until the SBR of the image falls below the surface SBR threshold, indicating that the imaging plane is above the tissue surface. A variable length Z-stack is acquired at the current X-Y position. As each new image is captured by the microscope, the focal plane of the microscope is moved to a deeper position by a set step-size, until the SBR of the image falls below the maximum imaging depth SBR threshold. In order to prevent premature termination of the Z-stack acquisition, the downward search is only terminated if it has proceeded for a predetermined minimum distance from the surface. At each step, the software records the Z slice number, starting with slice 0 at the surface of the tissue and increasing with depth, along with the X-Y tile position of the current image. The images are recorded on the microscope computer in a time series using the manufacturer supplied software.
When all of the visible tissue along the Z axis at the current X-Y position has been captured, the X-Y stage is repositioned in order to capture a new field-of-view. The stage is moved by the length of a field of view in either the X or Y dimension minus a fixed overlap. Once the X-Y stage has been repositioned, the system must detect the Z position of the surface for this new field-of-view. For any contiguous tissue surface, the surface locations in overlapping adjacent fields-of-view should be close together. Therefore, the new tissue surface search is initiated at the same focal plane of the detected tissue surface for the previous (i.e. adjacent) X-Y position. At this location, the focal plane is in one of three positions relative to the tissue-air boundary.
Case 1: Focal plane is above the surface of the tissue.
In this case the microscope is focused on the space above the sample, so the image will not contain any visible tissue and the SBR will be below the surface SBR threshold.
Case 2: Focal plane is below the surface of the tissue and tissue is currently visible.
In this case the microscope is focused on the body of the sample and the image SBR will be above both SBR thresholds.
Case 3: Focal plane is below the surface of the tissue and no tissue is currently visible.
In this case, the microscope is focused deep within the sample, below any visible tissue. Since Case 3 is indistinguishable from Case 1 using the SBR, it can be avoided by increasing the overlap between X-Y tiles such that the depth of an adjacent tissue surface is never below the maximal imaging depth of the following stack.
If the current image does not contain visible tissue, the software assumes Case 1, the focal plane above the tissue surface, and searches down along the Z axis until the image SBR crosses the surface threshold. If visible tissue is not found within a set search window, the program is possibly in Case 3. The software returns to the Z position where it started the search and searches up along the Z axis. If no tissue is found during search in either direction, it is assumed to be an X-Y tissue boundary.
If the current image does contain visible tissue, the software assumes Case 2, focal plane below the tissue surface, and searches up along the Z axis until the image SBR crosses below the threshold. The microscope is now focused back on the surface of the tissue in a new X-Y position, and the process repeats to capture the next variable length Z-stack to the maximum imaging depth. The software continues to acquire variable length Z-stacks for each X-Y position in the preset acquisition pattern.
ROVAR Reconstruction
The microscope computer captures images continuously during operation, including time spent moving the microscope stage, so not all of the recorded images belong in the final volume mosaic. While acquiring Z-stacks, the ROVAR software records the X, Y, and Z index of each frame relative to the first frame acquired. With this information, Z-stacks can be reassembled from the continuous image stream saved by the microscope computer. A plug-in was created for ImageJ that automates the reassembly process. The user inputs the data file generated by the ROVAR acquisition software and the microscope image time-series in an ImageJ dialog, along with a specified export directory. The plug-in reassembles the Z-stacks acquired in the continuous acquisition and outputs them as individual Z-stacks, along with a file containing the relative position of each stack in the X, Y, and Z dimension that can be used in a reconstruction algorithm previously reported (Preibisch et al., 2009). This algorithm uses the overlapping area of each acquired volume to create sub-pixel alignment from up to three recorded data channels and can create a single combined image volume. The resulting alignment is stitched together using the 1.5 exponent blending alpha and exported to a single tiff image stack.
Volume Visualization
Image stacks were imported to Imaris 6.5 (Bitplane Inc., St. Paul, MN) to perform volume rendering. The collagen channel (395–405 BP) was assigned a blue LUT and the ANEPPS channel (540–615 BP) was assigned a red LUT. 4×downsampled, 2×-downsampled, and 1× native-resolution images were used to render various zoom levels in each tissue.
Results and Discussion
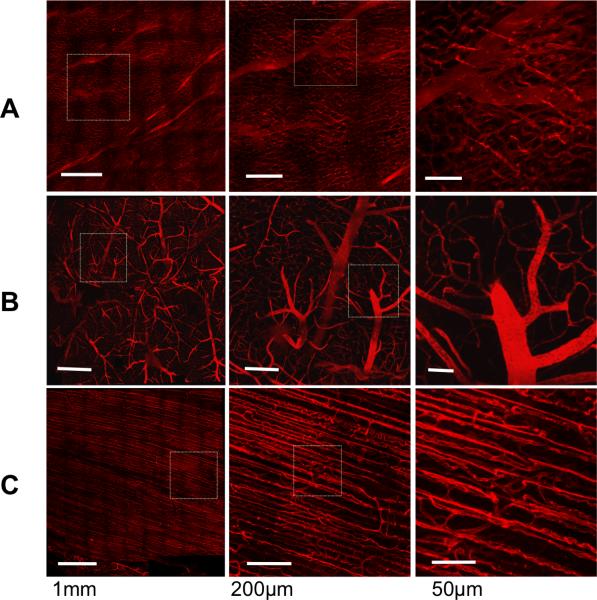
Large 3D datasets were acquired, reconstructed, and rendered from mouse heart, brain, and skeletal muscle, in situ (Figure 3). Additionally, a dataset was acquired from skeletal muscle, in vivo (Supplemental Movie 1). Each dataset was acquired at spatial resolution of 0.87 × 0.87 × 2 micrometersΛ3 along the visible surface of each tissue using the ROVAR software. Representative maximum imaging depth for each tissue was calculated as the width of the 10 shallowest tiles (i.e. on the least curved portion of the surface) acquired by the ROVAR software. Heart was 108 +/− 2 micrometers average imaging depth, brain was 146+/− 4 micrometers average imaging depth and skeletal muscle was 130 +/− 2 micrometers average imaging depth. Since depth of each ROVAR stack was determined by SBR, maximum imaging depth could have been improved by incorporating any number of methods that increase SBR, such as increasing excitation power or efficiency, improving the photon collection efficiency of the detection apparatus, increasing pixel dwell time, performing numerical averaging, or reducing light contamination of background images.
Figure 3.
ROVAR heart, brain, and skeletal muscle projection images of vascular dye channel. Each row at increasing resolution from left to right, with heart (A), brain (B), and skeletal muscle (C). Tissue taken from animals labeled with intravascular di-8-ANEPPS and imaged in a saline bath within 1h of death.
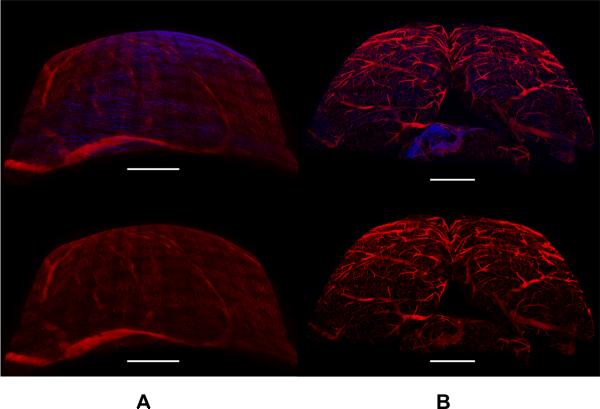
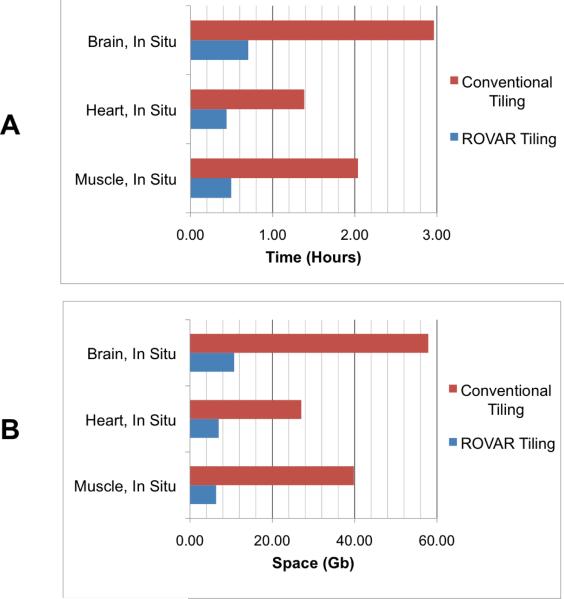
Renderings created with Imaris show the curvature of the tissues (Figure 4). The advantage of an automated system for collecting overlapping 3D tiles is illustrated by these renderings. The volume within a `bounding-box' outlining the edges of the volume would have to be acquired in a conventional scan of these tissues. Comparing this theoretical conventional tiling to the experimental data shows a substantial improvement in the time required to collect data (Table 1) and the space required to save the data (Table 2) when using ROVAR. Most of this improvement is due to rejecting the empty or low-SBR images above and below the visible tissue volume. The calculated improvement in speed and storage requirements using the ROVAR is significant (Figure 5), but another benefit to the microscope user is the automatic calculation of the boundaries of the tissue surface without the liability of hitting the tissue with the objective while acquiring the data. In conventional tiling, the net depth dimension would be limited by the working distance of the objective, while in ROVAR acquisition a thicker net depth dimension can be acquired in curved volumes along a tissue surface, imaging within the objective working distance.
Figure 4.
3D rendering of ROVAR datasets acquired from heart (A) and brain (B). Top row shows two-channel images with red channel of ANEPPS vascular label and blue channel from second harmonic generation by collagen. Bottom row shows one-channel renderings of ANEPPS channel only. Scale bars 1 mm.
Table 1.
Time improvement, ROVAR vs. conventional tiling procedure
| Tissue | Volume dimensions | Rover program time (h) | Convtnl. procedure time (h) | Rover time improvement |
|---|---|---|---|---|
| Muscle, In Situ | 3.21 × 3.11 × 1.00 mm3 | 0.50 | 2.04 | 4.12 × |
| Heart, In Situ | 3.82 × 3.80 × 1.15 mm3 | 0.44 | 1.39 | 3.15 × |
| Brain, In Situ | 5.04 × 5.12 × 1.51 mm3 | 0.70 | 2.96 | 4.22 × |
Table 2.
Storage space improvement, ROVAR vs. conventional procedure
| Tissue | Volume dimensions | Rover program space (GB) | Convtnl. procedure space (GB) | Rover space improvement |
|---|---|---|---|---|
| Muscle, In Situ | 3.21 × 3.11 × 1.00 mm3 | 6.36 | 39.83 | 6.26 × |
| Heart, In Situ | 3.82 × 3.80 × 1.15 mm3 | 6.99 | 27.06 | 3.87 × |
| Brain, In Situ | 5.04 × 5.12 × 1.51 mm3 | 10.74 | 57.90 | 5.39 × |
Figure 5.
Improvement in speed (A) and disk space (B) in each experimental ROVAR dataset compared with a theoretical dataset of the same dimensions, frame rate, overlap, and resolution acquired using conventional scanning.
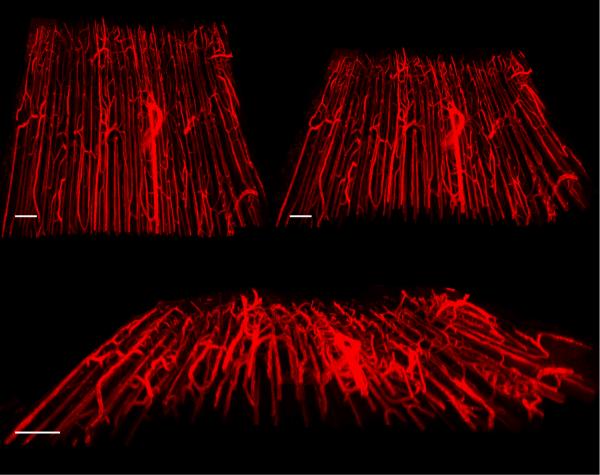
In vivo acquisition has the added advantage of observing tissue morphology while blood pressure and tissue tonicity are at physiological levels. Although motion of tissue during acquisition can be a serious issue for in vivo experiments (Schroeder et al., 2010), the speed of ROVAR, coupled with reasonable overlap and net dimensions, allow reconstructions spanning several millimeters (Figure 6). During the acquisition of this volume there is some motion visible during the playback of the Z-stack. Also visible during playback of the Z-stack is blood flow through the capillary network (Supplemental Movie 1).
Figure 6.
3D renderings of skeletal muscle vasculature from image data acquired in vivo. Scale bars 150μm; overall dimensions 1.5mm × 1.5mm × 100 μm. Motion of tissue was small enough to allow reconstruction of tiles.
The number of potential experimental systems from which large scale volumetric data may be acquired is expanded by using the ROVAR methods. The morphology of cellular structures can be altered in diseases, genetic models, or experimental perturbations. Differences in morphology can often be quantified by computational algorithms that calculate any number of parameters such as expression density, connectivity, colocalization, shape, etc. Having wide field-of-view, high-resolution data with more unbiased selection parameters could be useful in automating the characterization of cellular parameters in vivo or in situ. For example, using a vascular dye such as ANEPPS could assist in modeling and calculating variation in capillary structure and enable modeling of microcirculation in model systems. This future work could yield further insight at the intersection of cell biology and tissue physiology.
Supplementary Material
Acknowledgements
The authors would like to acknowledge David Chess, Brian Glancy, and Joni Taylor for their help with animal preparation and surgery and acknowledge Randall Pursley for editorial advice.
References
- Chow SK, Hakozaki H, Price DL, MacLean NA, Deerinck TJ, Bouwer JC, Martone ME, Peltier ST, Ellisman MH. Automated microscopy system for mosaic acquisition and processing. J Microsc. 2006;222:76–84. doi: 10.1111/j.1365-2818.2006.01577.x. [DOI] [PubMed] [Google Scholar]
- Combs CA, Smirnov A, Chess D, McGavern DB, Schroeder JL, Riley J, Kang SS, Lugar-Hamer M, Gandjbakhche A, Knutson JR, Balaban RS. Optimizing multiphoton fluorescence microscopy light collection from living tissue by noncontact total emission detection (epiTED) Journal of Microscopy. 2010 doi: 10.1111/j.1365-2818.2010.03411.x. [DOI] [PMC free article] [PubMed] [Google Scholar]
- Debarre D, Botcherby EJ, Watanabe T, Srinivas S, Booth MJ, Wilson T. Image-based adaptive optics for two-photon microscopy. Opt Lett. 2009;34:2495–2497. doi: 10.1364/ol.34.002495. [DOI] [PMC free article] [PubMed] [Google Scholar]
- Denk W, Strickler JH, Webb WW. Two-photon laser scanning fluorescence microscopy. Science. 1990;248:73–76. doi: 10.1126/science.2321027. [DOI] [PubMed] [Google Scholar]
- Emmenlauer M, Ronneberger O, Ponti A, Schwarb P, Griffa A, Filippi A, Nitschke R, Driever W, Burkhardt H. XuvTools: free, fast and reliable stitching of large 3D datasets. J Microsc. 2009;233:42–60. doi: 10.1111/j.1365-2818.2008.03094.x. [DOI] [PubMed] [Google Scholar]
- Jobsis PD, Rothstein EC, Balaban RS. Limited utility of acetoxymethyl (AM)-based intracellular delivery systems, in vivo: interference by extracellular esterases. J Microsc. 2007;226:74–81. doi: 10.1111/j.1365-2818.2007.01755.x. [DOI] [PMC free article] [PubMed] [Google Scholar]
- Losavio BE, Liang Y, Santamaria-Pang A, Kakadiaris IA, Colbert CM, Saggau P. Live neuron morphology automatically reconstructed from multiphoton and confocal imaging data. J Neurophysiol. 2008;100:2422–2429. doi: 10.1152/jn.90627.2008. [DOI] [PubMed] [Google Scholar]
- McMullen JD, Zipfel WR. A multiphoton objective design with incorporated beam splitter for enhanced fluorescence collection. Opt Express. 2010;18:5390–5398. doi: 10.1364/OE.18.005390. [DOI] [PMC free article] [PubMed] [Google Scholar]
- Preibisch S, Saalfeld S, Tomancak P. Globally optimal stitching of tiled 3D microscopic image acquisitions. Bioinformatics. 2009;25:1463–1465. doi: 10.1093/bioinformatics/btp184. [DOI] [PMC free article] [PubMed] [Google Scholar]
- Rothstein EC, Nauman M, Chesnick S, Balaban RS. Multi-photon excitation microscopy in intact animals. J Microsc. 2006;222:58–64. doi: 10.1111/j.1365-2818.2006.01570.x. [DOI] [PMC free article] [PubMed] [Google Scholar]
- Schroeder JL, Luger-Hamer M, Pursley R, Pohida T, Chefd'hotel C, Kellman P, Balaban RS. Subcellular motion compensation for minimally invasive microscopy, in vivo: evidence for oxygen gradients in resting muscle. Circ Res. 2010;106:1129–1133. doi: 10.1161/CIRCRESAHA.109.211946. [DOI] [PMC free article] [PubMed] [Google Scholar]
- Sherman L, Ye JY, Albert O, Norris TB. Adaptive correction of depth-induced aberrations in multiphoton scanning microscopy using a deformable mirror. J Microsc. 2002;206:65–71. doi: 10.1046/j.1365-2818.2002.01004.x. [DOI] [PubMed] [Google Scholar]
Associated Data
This section collects any data citations, data availability statements, or supplementary materials included in this article.


