

Abstract
Background
PG11047 is a novel conformationally restricted analog of the natural polyamine spermine that lowers cellular endogenous polyamine levels and competitively inhibits natural polyamine functions leading to cancer cell growth inhibition. The activity of PG11047 was evaluated against the PPTP’s in vitro and in vivo panels.
Procedures
PG11047 was evaluated against the PPTP in vitro panel using 96 hour exposure at concentrations ranging from 10 nM to 100 μM. It was tested against the PPTP in vivo panels at a dose of 100 mg/kg administered by the intraperitoneal (IP) route weekly for 6 weeks.
Results
In vitro PG11047 demonstrated a concentration-response pattern consistent with cytostatic activity. The median relative IC50 for PG11047 was 71 nM. Cell lines of the Ewing sarcoma panel had a lower median relative IC50 value compared to the remaining cell lines in the panel, while cell lines of the neuroblastoma panel had a higher median relative IC50 value. In vivo PG11047 induced significant differences in EFS distribution compared to control in 5 of 32 (15.6%) of the evaluable solid tumor xenografts and in 0 of 7 (0%) of the evaluable ALL xenografts. The single case of tumor regression occurred in an ependymoma xenograft.
Conclusions
Further pediatric development of PG11047 will require better defining a target population and identifying combinations for which there is a tumor-selective cytotoxic effect. The regression observed for an ependymoma xenograft and the exquisite sensitivity of some Ewing sarcoma cell lines to the antiproliferative effects of PG11047 provide leads for further preclinical investigations.
Keywords: Preclinical Testing, Developmental Therapeutics, polyamine
INTRODUCTION
PG11047 is a novel conformationally restricted analog of the natural polyamine spermine that lowers cellular endogenous polyamine levels and competitively inhibits natural polyamine functions leading to cancer cell growth inhibition [1,2]. The polycationic polyamines spermidine and spermine are essential for eukaryotic cell growth. Early attempts at targeting polyamine synthesis and catabolism pathways focused on inhibition of ornithine decarboxylase (ODC), which is required for cellular proliferation. Polyamine biosynthesis begins with the conversion of ornithine to putrescine by ODC, and this is a rate-limiting step in polyamine biosynthesis. 2-difluoromethylornithine (DFMO, eflornithine) is an enzyme-activated irreversible inhibitor of ODC, which has been extensively studied for cancer chemoprevention and treatment. DFMO is effective in the treatment of African trypanosomiasis and has been approved by FDA for this indication [3–5]. A placebo-controlled randomized cancer chemoprevention trial evaluating DFMO given with sulindac in persons with a history of resected adenomas demonstrated a marked reduction in recurrent adenomatous polyps for those receiving DFMO and sulindac [6]. However, DFMO has shown limited effectiveness as an anticancer treatment [7,8], although there was a trend for benefit in a randomized trial for patients with anaplastic gliomas receiving DFMO with standard chemotherapy [9]. The limited efficacy of DFMO in the therapeutic setting may reflect an inability to maintain the high DFMO concentrations necessary to maintain ODC inhibition and polyamine depletion, as well as compensatory mechanisms that blunt the effects of DFMO-induced polyamine depletion.
PG11047-induced depletion of endogenous polyamines involves feedback inhibition of polyamine biosynthetic enzymes as well as induction of the polyamine metabolizing enzymes spermidine/spermine N1-acetyltransferase (SSAT) and spermine oxidase (SMO) [2]. The ability of PG11047 to bind to nucleic acids with avidity, but with modified function, likely contributes to its antiproliferative/cell killing actions [2]. PG11047 inhibits proliferation of a range of cancer cell lines, including breast cancer, prostate, non-small lung cell cancer, and small cell lung cancer cell lines [1,10,11]. PG11047 demonstrated in vivo tumor growth inhibition against prostate cancer and NSCLC xenografts [10,12].
The polyamine pathway is a downstream target for known oncogenes, and inhibition of polyamine synthesis can disrupt the action of those genes. Of relevance to pediatric cancers, MYC and MYCN activate transcription of ODC [13–17]. Furthermore, disabling ODC abolishes MYC-induced suppression of the CDK inhibitors p21(Cip1) and p27(Kip1), thereby impairing MYC’s proliferative response [18]. Based on interest in polyamine function as a therapeutic target and on the strength of the preclinical data supporting PG11047 as a potent modulator of polyamine synthesis, catabolism, and as an agent able to inhibit cancer cell growth in vitro and in vivo, the PPTP evaluated this agent to gain insight into its utility against pediatric tumors.
MATERIALS AND METHODS
In vitro testing
In vitro testing was performed using DIMSCAN, a semiautomatic fluorescence-based digital image microscopy system that quantifies viable (using fluorescein diacetate [FDA]) cell numbers in tissue culture multiwell plates [19]. Cells were incubated in the presence of PG11047 for 96 hours at concentrations from 10 nM to 100 μM and analyzed as previously described [20]. Absolute IC50 values represent the concentration of PG11047 that reduces cell survival to 50% of the control value, while relative IC50 values represent the PG11047 concentration that reduces cell survival by 50% of the maximum PG11047 effect [21]. Relative In/Out (I/O)% values represent the percentage difference between the Ymin value and the estimated starting cell number and either the control cell number (for agents with Ymin > starting cell number) or 0 (for agents with Ymin < estimated starting cell number). Relative I/O% values range between 100% (no treatment effect) to −100% (complete cytotoxic effect), with a Relative I/O% value of 0 being observed for a completely effective cytostatic agent.
In vivo tumor growth inhibition studies
CB17SC scid−/− female mice (Taconic Farms, Germantown NY), were used to propagate subcutaneously implanted kidney/rhabdoid tumors, sarcomas (Ewing, osteosarcoma, rhabdomyosarcoma), neuroblastoma, and non-glioblastoma brain tumors, while BALB/c nu/nu mice were used for glioma models, as previously described [22]. Human leukemia cells were propagated by intravenous inoculation in female non-obese diabetic (NOD)/scid−/− mice as described previously [23]. Female mice were used irrespective of the patient gender from which the original tumor was derived. All mice were maintained under barrier conditions and experiments were conducted using protocols and conditions approved by the institutional animal care and use committee of the appropriate consortium member. Ten mice (solid tumors) or 8 mice (leukemia models) were used in each control or treatment group. Tumor volumes (cm3) [solid tumor xenografts] or percentages of human CD45-positive [hCD45] cells [ALL xenografts] were determined as previously described [24] and responses were determined using three activity measures as previously described [24]. An in-depth description of the analysis methods is included in the Supplemental Response Definitions section.
Statistical Methods
The exact log-rank test, as implemented using Proc StatXact for SAS®, was used to compare event-free survival distributions between treatment and control groups. P-values were two-sided and were not adjusted for multiple comparisons given the exploratory nature of the studies.
Drugs and Formulation
PG11047 was provided to the PPTP by Progen Pharmaceuticals, through the Cancer Therapy Evaluation Program (NCI). PG11047 was formulated in sterile water for injection, and it was administered at a dose of 100 mg/kg weekly by the intraperitoneal route.
RESULTS
PG11047 in vitro testing
Table I shows the relative and absolute IC50 values and Ymin values for the 23 cell lines of the PPTP in vitro panel. PG11047 demonstrated treatment to control (T/C) concentration-response curves with non-zero plateaus at higher concentrations. Plateau Ymin values exceeded those expected for a completely effective cytostatic agent for 20 of 23 cell lines, as demonstrated in Table I by the Relative I/O% values exceeding 0 for these 20 cell lines. This is a typical pattern of response observed for cytostatic agents using the T/C endpoint and is illustrated by the response of the ALL cell line NALM-6 to PG11047 (Figure 1). The median relative IC50 for PG11047 across the entire panel was 71 nM. Cell lines of the Ewing sarcoma panel had a lower median relative IC50 value (<22 nM) compared to the remaining cell lines in the panel, while cell lines of the neuroblastoma panel had a higher median relative IC50 value (575 nM). The ratio of the median relative IC50 of the entire panel to that of each cell line is presented in Table I and Figure 1. Higher ratios are indicative of greater sensitivity to PG11047 and are shown by bars to the right of the midpoint line. The greater sensitivity of the Ewing sarcoma cell lines (TC-71 through CHLA-258) and the lesser sensitivity for the neuroblastoma cell lines (NB-1643 through CHLA-136) is illustrated in Figure 1.
Table I.
Activity of PG11047 against the PPTP in vitro panel
| Cell Line | Histology | Relative IC50 (nM)* | Absolute IC50 (nM)* | Median Relative IC50 Ratio | Ymin (T/C%)* | Relative I/O%** |
|---|---|---|---|---|---|---|
| RD | Rhabdomyosarcoma | 186 | 11,581 | 0.39 | 49 | 46% |
| Rh41 | Rhabdomyosarcoma | 67 | 106 | 1.09 | 37 | 19% |
| Rh18 | Rhabdomyosarcoma | 126 | >100,000 | 0.58 | 69 | 44% |
| Rh30 | Rhabdomyosarcoma | 97 | 162 | 0.75 | 28 | 14% |
| BT-12 | Rhabdoid | 43 | 50 | 1.68 | 22 | 15% |
| CHLA-266 | Rhabdoid | 33 | >100,000 | 2.17 | 72 | 62% |
| TC-71 | Ewing sarcoma | 45 | 53 | 1.62 | 14 | 13% |
| CHLA-9 | Ewing sarcoma | <10 | <10 | >8.05 | 23 | 20% |
| CHLA-10 | Ewing sarcoma | 34 | 254 | 2.16 | 49 | 46% |
| CHLA-258 | Ewing sarcoma | <10 | >100,000 | >8.05 | 52 | 21% |
| GBM2 | Glioblastoma | 78 | 112 | 0.92 | 34 | 27% |
| NB-1643 | Neuroblastoma | 224 | 2526 | 0.32 | 38 | 21% |
| NB-EBc1 | Neuroblastoma | 71 | 829 | 1.02 | 19 | −17% |
| CHLA-90 | Neuroblastoma | 929 | 707 | 0.08 | 47 | 26% |
| CHLA-136 | Neuroblastoma | 2,528 | 9483 | 0.03 | 18 | −37% |
| NALM-6 | ALL | 59 | 124 | 1.24 | 27 | 25% |
| COG-LL-317 | ALL | <10 | <10 | >8.05 | 6 | 2% |
| RS4;11 | ALL | 208 | 318 | 0.35 | 19 | 5% |
| MOLT-4 | ALL | 117 | 135 | 0.62 | 2 | −80% |
| CCRF-CEM | ALL | 59 | 231 | 1.22 | 34 | 30% |
| Kasumi-1 | AML | 72 | 192 | 1.00 | 39 | 14% |
| Karpas-299 | ALCL | 22 | 52 | 3.28 | 24 | 18% |
| Ramos-RA1 | NHL | 89 | 256 | 0.81 | 31 | 30% |
| Median | 71 | 231 | 1.00 | 31 | 20% | |
| Minimum | <10 | <10 | 0.03 | 2 | −80% | |
| Maximum | 2,528 | >100,000 | >8.05 | 72 | 62% |
See Materials and Methods for definitions.
Relative I/O% is based on the Observed Ymin and the Predicted Ymin (if the agent acted as a completely effective cytostatic agent) and equals (Observed Ymin−Predicted Ymin)/(100−Predicted Ymin) if Observed Ymin > Predicted Ymin; and (Predicted Ymin−Observed Ymin)/(Predicted Ymin) if Observed Ymin < Predicted Ymin).
Figure 1.
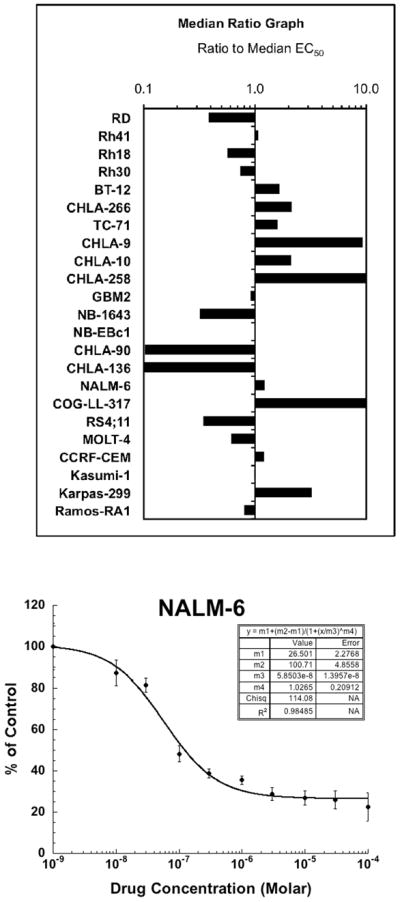
PG11047 in vitro activity. Top panel: The median relative IC50 (EC50) ratio graph shows the relationship between the relative IC50 values for the cell lines of the PPTP in vitro panel. Each bar represents the ratio of the median relative IC50 for the entire cell line panel to the relative IC50 value of the indicated cell line. Bars to the right represent cell lines with higher sensitivity, while bars to the left indicate cell lines with lesser sensitivity. Bottom panel: Representative dose response curve for the NALM-6 (ALL) cell line.
PG11047 in vivo testing
PG11047 was evaluated in 45 xenograft models. Fifty-two of 854 mice died during the study (6.1%), with 1 of 424 in the control arm (0.2%) and 51 of 430 in the PG11047 treatment arm (11.9%). Six tumor lines were excluded from analysis due to toxicity greater than 25 percent. Excluded xenografts were from the rhabdoid tumor (1 of 3), Wilms tumor (1 of 3) Ewing sarcoma (1 of 5), rhabdomyosarcoma (2 of 6), and ALL (1 of 8) panels. A complete summary of results is provided in Supplemental Table I, including total numbers of mice, number of mice that died (or were otherwise excluded), numbers of mice with events and average times to event, tumor growth delay, as well as numbers of responses and T/C values.
PG11047 induced significant differences in EFS distribution compared to control in 5 of 32 (15.6%) of the evaluable solid tumor xenografts and in 0 of 7 (0%) of the evaluable ALL xenografts. For those xenografts with a significant difference in EFS distribution between treated and control groups, the EFS T/C activity measure additionally requires an EFS T/C value of > 2.0 for intermediate activity and indicates a substantial agent effect in slowing tumor growth. High activity further requires a reduction in final tumor volume compared to the starting tumor volume. PG11047 induced tumor growth inhibition meeting criteria for intermediate activity in 1 of 29 (3.4%) evaluable solid tumor xenografts, the Ewing sarcoma xenograft CHLA-258 (Figure 2). No solid tumor xenografts met criteria for high EFS T/C activity. Intermediate EFS T/C activity was not observed for any of the evaluable ALL xenografts (0 of 7).
Figure 2.

PG11047 activity against individual solid tumor xenografts. Kaplan-Meier curves for EFS, median relative tumor volume graphs, and individual tumor volume graphs are shown for selected lines: CHLA-258, BT-36, NB-1771, and OS-1. Controls (gray lines); Treated (black lines).
The only xenograft achieving an objective response was BT-36 from the ependymoma panel (Figure 2). This xenograft is slow-growing, which may explain why the p-value for the control versus treated EFS distribution was not significant for this xenograft. Among the remaining xenografts, the best response in the solid tumor panels was PD2 (progressive disease with growth delay) which was observed in three xenografts (Figure 2), one each from the Ewing sarcoma (CHLA-258), the neuroblastoma (NB-1771), and the osteosarcoma (OS-1) tumor panels. In the ALL panel, the best response was PD2, which was observed in a single xenograft. The in vivo testing results for the objective response measure of activity are presented in Figure 3 in a ‘heat-map’ format as well as a ‘COMPARE’-like format, based on the scoring criteria described the Supplemental Response Definitions section. The latter analysis demonstrates relative tumor sensitivities around the midpoint score of 5 (stable disease).
Figure 3.

PG11047 in vivo objective response activity, left: The colored heat map depicts group response scores. A high level of activity is indicated by a score of 6 or more, intermediate activity by a score of ≥ 2 but < 6, and low activity by a score of < 2. Right: representation of tumor sensitivity based on the difference of individual tumor lines from the midpoint response (stable disease). Bars to the right of the median represent lines that are more sensitive, and to the left are tumor models that are less sensitive. Red bars indicate lines with a significant difference in EFS distribution between treatment and control groups, while blue bars indicate lines for which the EFS distributions were not significantly different.
DISCUSSION
PG11047 showed an activity pattern consistent with cytostasis against the cell lines of the PPTP in vitro panel. The Ewing sarcoma cell lines appearing somewhat more sensitive and the neuroblastoma cell lines somewhat less sensitive than the remaining cell lines studied. The cytostatic pattern of response observed for the PPTP cell lines is consistent with that recently described for breast cancer, colon cancer, and lung cancer cell lines [10,11,25]. There was a wide concentration range over which the PG11047 half-maximal effect was observed, ranging from less than 10 nM to greater than 1 μM. The three most sensitive cell lines with EC50 values less than 10 nM included two of the four Ewing sarcoma cell lines evaluated as well as an ALL cell line. This exquisite level of sensitivity is not observed in most adult cancer cell lines [1,10,11], but has been noted for select lymphoma cell lines (L. Marton, personal communication). The cellular basis for this high sensitivity has not been identified.
The in vivo antitumor activity observed for PG11047 against the PPTP childhood cancer models consisted of regression in a single ependymoma xenograft and tumor growth inhibition in selected other xenografts. The degree of tumor growth inhibition was modest, with a single xenograft showing more than a two-fold increase in time to event. Tumor growth inhibition is also described for adult cancer xenografts [10,12]. The ependymoma xenograft for which a regression was observed grows slowly, which resulted in there not being a significant difference between the treated and control groups in EFS distribution. Because of this, further testing is required to define the effectiveness for PG11047 for this and other ependymoma xenografts.
There has been substantial interest in the role of inhibitors of polyamine synthesis for neuroblastoma [26]. MYCN-amplified neuroblastoma shows coordinate deregulation of multiple polyamine enzymes, including ODC, resulting in enhanced polyamine biosynthesis [15,16]. Further supporting a role for the polyamine pathway in neuroblastoma, DFMO treatment blocks the proliferative response of MYCN-amplified neuroblastoma, and when started at birth delays the onset of tumor development in neuroblastoma-prone genetically engineered mice [15,16]. Delaying DFMO treatment of genetically engineered mice until after tumor onset produces a small, but significant, extension in the time to tumor progression and death [15]. The combination of DFMO plus standard chemotherapy agents extends survival beyond that achieved with chemotherapy alone [15]. There are similarities between the activity of DFMO that has been described for neuroblastoma and that described in this report for PG11047. Both agents induce a cytostatic response associated with cell cycle arrest [11,16,17], and the in vivo activity of each agent is modest when treatment is initiated after tumor onset [15]. Transitioning the strategy of polyamine depletion into an effective treatment for neuroblastoma will require the identification of combination therapies that selectively deprive cancer cells of major compensatory pathways, leading to cytotoxic activity with a favorable therapeutic window [26].
PG11047 is under clinical evaluation in adults with cancer. The agent has generally been well tolerated [2]. It is currently in a phase 1b trial (Clinical Trial Identifier: NCT00705874) in which it is given in combination with one of seven different approved drugs, including conventional cytotoxic agents (e.g., cisplatin and gemicitabine) and molecular targeted agents (e.g., sunitinib, bevacizumab, and erlotinib). Further pediatric development of PG11047 will require better defining a target population and identifying combinations for which there is a tumor-selective cytotoxic effect. The regression observed for an ependymoma xenograft and the exquisite sensitivity of some Ewing sarcoma cell lines to the antiproliferative effects of PG11047 provide leads for further preclinical investigations.
Supplementary Material
Table II.
Activity of PG11047 against the PPTP in vivo panel
| Xenograft Line | Histology | Time to Event1 | P- value | EFS T/C2 | Median Final RTV3 | Tumor Volume T/C4 | T/C Activity5 | EFS Activity5 | Response Activity5 |
|---|---|---|---|---|---|---|---|---|---|
| KT-14 | Rhabdoid | 23.6 | 0.305 | 1.2 | >4 | 0.79 | Low | Low | Low |
| KT-12 | Rhabdoid | 14.7 | 0.118 | 1.3 | >4 | 0.69 | Low | Low | Low |
| KT-11 | Wilms | 13.1 | 0.046 | 0.7 | >4 | 1.64 | Low | Low | Low |
| KT-13 | Wilms | 11.9 | 0.114 | 1.3 | >4 | 0.82 | Low | Low | Low |
| EW5 | Ewing | 8.4 | 0.552 | 1 | >4 | 1.19 | Low | Low | Low |
| EW8 | Ewing | 8.6 | 0.682 | 1.1 | >4 | 0.47 | Low | Low | Low |
| TC-71 | Ewing | 10.2 | 0.72 | 1 | >4 | 1.1 | Low | Low | Low |
| CHLA-258 | Ewing | 33.3 | 0.046 | 2.9 | >4 | 0.49 | Low | Int | Int |
| Rh28 | ALV RMS | 28.7 | 0.045 | 1.3 | >4 | 0.81 | Low | Low | Low |
| Rh30 | ALV RMS | 19.7 | 0.236 | 1.2 | >4 | 0.73 | Low | Low | Low |
| Rh41 | ALV RMS | 13.2 | 0.182 | 1 | >4 | 0.93 | Low | Low | Low |
| Rh18 | EMB RMS | 15.2 | 0.504 | 1 | >4 | 0.9 | Low | Low | Low |
| BT-28 | Medulloblastoma | 9.3 | 0.803 | 1.1 | >4 | 0.72 | Low | Low | Low |
| BT-45 | Medulloblastoma | 14.5 | 0.338 | 1.1 | >4 | 1.02 | Low | Low | Low |
| BT-50 | Medulloblastoma | 31.2 | 0.029 | . | >4 | 2.03 | Low | NE | Low |
| BT-36 | Ependymoma | > EP | 0.077 | > 1.1 | 0.7 | 0.56 | Low | NE | High |
| BT-44 | Ependymoma | 13.3 | 0.662 | 1 | >4 | 1 | Low | Low | Low |
| GBM2 | Glioblastoma | 19.8 | 0.001 | 1.2 | >4 | 0.46 | Low | Low | Low |
| BT-39 | Glioblastoma | 17.8 | 0.329 | 1.2 | >4 | 0.77 | Low | Low | Low |
| D645 | Glioblastoma | 10.5 | 0.168 | 1.1 | >4 | 0.96 | Low | Low | Low |
| D456 | Glioblastoma | 10.1 | 0.197 | 1.2 | >4 | 0.87 | Low | Low | Low |
| NB-SD | Neuroblastoma | > EP | 0.061 | > 2.1 | >4 | 0.5 | Low | Low | Low |
| NB-1771 | Neuroblastoma | 8.6 | 0.079 | 1.7 | >4 | 0.49 | Low | Low | Int |
| NB-1691 | Neuroblastoma | 8.4 | 0.459 | 1.5 | >4 | 0.53 | Low | Low | Low |
| NB-EBc1 | Neuroblastoma | 6.9 | 0.335 | 1.1 | >4 | 0.95 | Low | Low | Low |
| NB-1643 | Neuroblastoma | 19.2 | 0.126 | 1.1 | >4 | 0.69 | Low | Low | Low |
| OS-1 | Osteosarcoma | > EP | <0.001 | > 1.5 | 2.4 | 0.56 | Low | NE | Int |
| OS-2 | Osteosarcoma | 27.3 | 0.294 | 1.1 | >4 | 1.09 | Low | Low | Low |
| OS-17 | Osteosarcoma | 13.5 | 0.307 | 0.9 | >4 | 1.17 | Low | Low | Low |
| OS-9 | Osteosarcoma | 23.2 | 0.059 | 1.3 | >4 | 0.78 | Low | Low | Low |
| OS-33 | Osteosarcoma | 20.7 | 0.004 | 1.2 | >4 | 0.66 | Low | Low | Low |
| OS-31 | Osteosarcoma | 18.6 | 0.503 | 1.1 | >4 | 0.86 | Low | Low | Low |
| ALL-2 | ALL B-precursor | 13.1 | 0.898 | 0.8 | >25 | . | Low | Low | |
| ALL-3 | ALL B-precursor | 11.8 | 0.675 | 1.5 | >25 | . | Low | Int | |
| ALL-7 | ALL B-precursor | 9 | 0.389 | 1 | >25 | . | Low | Low | |
| ALL-8 | ALL T-cell | 3.3 | 0.366 | 0.9 | >25 | . | Low | Low | |
| ALL-16 | ALL T-cell | 23.6 | 0.883 | 1.1 | >25 | . | Low | Low | |
| ALL-17 | ALL B-precursor | 7.5 | 0.134 | 1.2 | >25 | . | Low | Low | |
| ALL-19 | ALL B-precursor | 10.8 | 0.842 | 1 | >25 | . | Low | Low |
Kaplan-Meier estimate of the median time to event for the treatment group;
EFS T/C value = ratio of the median time to event of the treatment group and of the respective control group;
RTV (Relative tumor volume) = ratio of tumor volume at specified time post-treatment to pretreatment tumor volume;
Tumor Volume T/C = ratio of RTV for treatment and control groups calculated at day 21 or when all mice in the control and treated groups still had measurable tumor volumes (if less than 21 days);
Acknowledgments
This work was supported by NO1-CM-42216, CA21765, and CA108786 from the National Cancer Institute and used PG11047 supplied by Progen Pharmaceuticals. In addition to the authors this paper represents work contributed by the following: Sherry Ansher, Catherine A. Billups, Joshua Courtright, Edward Favours, Henry S. Friedman, Danuta Gasinski, Debbie Payne-Turner, Chandra Tucker, Jianrong Wu, Joe Zeidner, Ellen Zhang, and Jian Zhang. Children’s Cancer Institute Australia for Medical Research is affiliated with the University of New South Wales and Sydney Children’s Hospital.
Footnotes
CONFLICT OF INTEREST STATEMENT: The authors consider that there are no actual or perceived conflicts of interest.
References
- 1.Reddy VK, Valasinas A, Sarkar A, et al. Conformationally restricted analogues of 1N,12N-bisethylspermine: synthesis and growth inhibitory effects on human tumor cell lines. Journal of medicinal chemistry. 1998;41(24):4723–4732. doi: 10.1021/jm980172v. [DOI] [PubMed] [Google Scholar]
- 2.Casero RA, Jr, Marton LJ. Targeting polyamine metabolism and function in cancer and other hyperproliferative diseases. Nat Rev Drug Discov. 2007;6(5):373–390. doi: 10.1038/nrd2243. [DOI] [PubMed] [Google Scholar]
- 3.Van Nieuwenhove S, Schechter PJ, Declercq J, et al. Treatment of gambiense sleeping sickness in the Sudan with oral DFMO (DL-alpha-difluoromethylornithine), an inhibitor of ornithine decarboxylase; first field trial. Trans R Soc Trop Med Hyg. 1985;79(5):692–698. doi: 10.1016/0035-9203(85)90195-6. [DOI] [PubMed] [Google Scholar]
- 4.Sjoerdsma A, Schechter PJ. Eflornithine for African sleeping sickness. Lancet. 1999;354(9174):254. doi: 10.1016/S0140-6736(05)66324-6. [DOI] [PubMed] [Google Scholar]
- 5.Schechter PJ, Sjoerdsma A. Difiuoromethylornithine in the treatment of African trypanosomiasis. Parasitology today (Personal ed. 1986;2(8):223–224. doi: 10.1016/0169-4758(86)90087-6. [DOI] [PubMed] [Google Scholar]
- 6.Meyskens FL, Jr, McLaren CE, Pelot D, et al. Difluoromethylornithine plus sulindac for the prevention of sporadic colorectal adenomas: a randomized placebo-controlled, double-blind trial. Cancer prevention research (Philadelphia, Pa. 2008;1(1):32–38. doi: 10.1158/1940-6207.CAPR-08-0042. [DOI] [PMC free article] [PubMed] [Google Scholar]
- 7.Levin VA, Uhm JH, Jaeckle KA, et al. Phase III randomized study of postradiotherapy chemotherapy with alpha-difluoromethylornithine-procarbazine, N-(2-chloroethyl)-N′-cyclohexyl-N-nitrosurea, vincristine (DFMO-PCV) versus PCV for glioblastoma multiforme. Clin Cancer Res. 2000;6(10):3878–3884. [PubMed] [Google Scholar]
- 8.Prados MD, Wara WM, Sneed PK, et al. Phase III trial of accelerated hyperfractionation with or without difluromethylornithine (DFMO) versus standard fractionated radiotherapy with or without DFMO for newly diagnosed patients with glioblastoma multiforme. Int J Radiat Oncol Biol Phys. 2001;49(1):71–77. doi: 10.1016/s0360-3016(00)01458-9. [DOI] [PubMed] [Google Scholar]
- 9.Levin VA, Hess KR, Choucair A, et al. Phase III randomized study of postradiotherapy chemotherapy with combination alpha-difluoromethylornithine-PCV versus PCV for anaplastic gliomas. Clin Cancer Res. 2003;9(3):981–990. [PubMed] [Google Scholar]
- 10.Hacker A, Marton LJ, Sobolewski M, et al. In vitro and in vivo effects of the conformationally restricted polyamine analogue CGC-11047 on small cell and non-small cell lung cancer cells. Cancer chemotherapy and pharmacology. 2008;63(1):45–53. doi: 10.1007/s00280-008-0706-x. [DOI] [PMC free article] [PubMed] [Google Scholar]
- 11.Kuo WL, Das D, Ziyad S, et al. A systems analysis of the chemosensitivity of breast cancer cells to the polyamine analogue PG-11047. BMC medicine. 2009;7:77. doi: 10.1186/1741-7015-7-77. [DOI] [PMC free article] [PubMed] [Google Scholar]
- 12.Dredge K, Kink JA, Johnson RM, et al. The polyamine analog PG11047 potentiates the antitumor activity of cisplatin and bevacizumab in preclinical models of lung and prostate cancer. Cancer chemotherapy and pharmacology. 2009;65(1):191–195. doi: 10.1007/s00280-009-1105-7. [DOI] [PubMed] [Google Scholar]
- 13.Nilsson JA, Maclean KH, Keller UB, et al. Mnt loss triggers Myc transcription targets, proliferation, apoptosis, and transformation. Molecular and cellular biology. 2004;24(4):1560–1569. doi: 10.1128/MCB.24.4.1560-1569.2004. [DOI] [PMC free article] [PubMed] [Google Scholar]
- 14.Bello-Fernandez C, Packham G, Cleveland JL. The ornithine decarboxylase gene is a transcriptional target of c-Myc. Proceedings of the National Academy of Sciences of the United States of America. 1993;90(16):7804–7808. doi: 10.1073/pnas.90.16.7804. [DOI] [PMC free article] [PubMed] [Google Scholar]
- 15.Hogarty MD, Norris MD, Davis K, et al. ODC1 is a critical determinant of MYCN oncogenesis and a therapeutic target in neuroblastoma. Cancer research. 2008;68(23):9735–9745. doi: 10.1158/0008-5472.CAN-07-6866. [DOI] [PMC free article] [PubMed] [Google Scholar]
- 16.Rounbehler RJ, Li W, Hall MA, et al. Targeting ornithine decarboxylase impairs development of MYCN-amplified neuroblastoma. Cancer research. 2009;69(2):547–553. doi: 10.1158/0008-5472.CAN-08-2968. [DOI] [PMC free article] [PubMed] [Google Scholar]
- 17.Wallick CJ, Gamper I, Thorne M, et al. Key role for p27Kip1, retinoblastoma protein Rb, and MYCN in polyamine inhibitor-induced G1 cell cycle arrest in MYCN-amplified human neuroblastoma cells. Oncogene. 2005;24(36):5606–5618. doi: 10.1038/sj.onc.1208808. [DOI] [PubMed] [Google Scholar]
- 18.Nilsson JA, Keller UB, Baudino TA, et al. Targeting ornithine decarboxylase in Myc-induced lymphomagenesis prevents tumor formation. Cancer cell. 2005;7(5):433–444. doi: 10.1016/j.ccr.2005.03.036. [DOI] [PubMed] [Google Scholar]
- 19.Frgala T, Kalous O, Proffitt RT, et al. A fluorescence microplate cytotoxicity assay with a 4-log dynamic range that identifies synergistic drug combinations. Molecular cancer therapeutics. 2007;6(3):886–897. doi: 10.1158/1535-7163.MCT-04-0331. [DOI] [PubMed] [Google Scholar]
- 20.Houghton PJ, Morton CL, Kolb EA, et al. Initial testing (stage 1) of the proteasome inhibitor bortezomib by the Pediatric Preclinical Testing Program. Pediatr Blood Cancer. 2008;50(1):37–45. doi: 10.1002/pbc.21214. [DOI] [PubMed] [Google Scholar]
- 21.Sebaugh JL. Guidelines for accurate EC50/IC50 estimation. Pharmaceut Statist. 2010 doi: 10.1002/pst.426. [DOI] [PubMed] [Google Scholar]
- 22.Friedman HS, Colvin OM, Skapek SX, et al. Experimental chemotherapy of human medulloblastoma cell lines and transplantable xenografts with bifunctional alkylating agents. Cancer research. 1988;48(15):4189–4195. [PubMed] [Google Scholar]
- 23.Liem NL, Papa RA, Milross CG, et al. Characterization of childhood acute lymphoblastic leukemia xenograft models for the preclinical evaluation of new therapies. Blood. 2004;103(10):3905–3914. doi: 10.1182/blood-2003-08-2911. [DOI] [PubMed] [Google Scholar]
- 24.Houghton PJ, Morton CL, Tucker C, et al. The Pediatric Preclinical Testing Program: description of models and early testing results. Pediatr Blood Cancer. 2007;49(7):928–940. doi: 10.1002/pbc.21078. [DOI] [PubMed] [Google Scholar]
- 25.Ignatenko NA, Yerushalmi HF, Pandey R, et al. Gene expression analysis of HCT116 colon tumor-derived cells treated with the polyamine analog PG-11047. Cancer genomics & proteomics. 2009;6(3):161–175. [PMC free article] [PubMed] [Google Scholar]
- 26.Evageliou NF, Hogarty MD. Disrupting polyamine homeostasis as a therapeutic strategy for neuroblastoma. Clin Cancer Res. 2009;15(19):5956–5961. doi: 10.1158/1078-0432.CCR-08-3213. [DOI] [PMC free article] [PubMed] [Google Scholar]
Associated Data
This section collects any data citations, data availability statements, or supplementary materials included in this article.