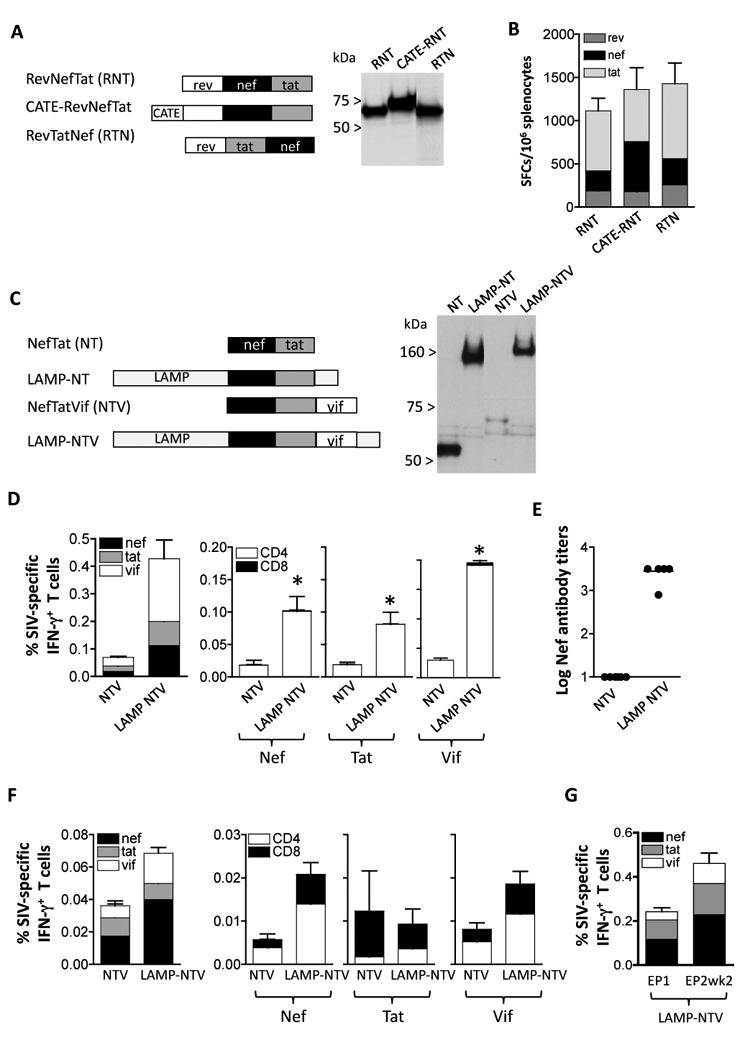
Fig. 5.

Immunogenicity to accessory proteins. (A) Cartoon depicts fusion proteins consisting of Rev (aa 1-107), Nef (aa 4-260) and Tat (aa 2-130). Two configurations changing the position of Nef (plasmid RevNefTat [RNT, 166S] and RevTatNef [RTN, plasmid 168S]; and the b-Catenin-RevNefTat (CATE-RNT; RNT [plasmid 174S] are shown. Expression of the proteins from 293 cells transfected with 100 ng of the respective DNAs was visualized on Western immunoblots probed with anti-Nef antibody. The relative GFP relative values (×100) of lanes 1-3 were: 300, 270, and 300, respectively. (B) Immunogenicity in Balb/c mice upon IM vaccination using plasmids expressing the fusion proteins shown in panel A. Mice were immunized at day 0 and week 4 with 100 μg of the indicated plasmids and sacrificed 2 weeks later. The levels of Rev-, Nef- and Tat-specific cellular immune responses were determined by ELISPOT assay. The mean and SEM are shown. (C) Cartoon depicts fusions of NefTat with LAMP and Vif Expression of the proteins from 293 cells transfected with 200 ng of DNA was visualized on Western immunoblots probed with anti-Nef antibody. The relative GFP values (×100) of the transfection in lanes 1-4: 240, 250, 270, and 260, respectively. (D) Immunogenicity of the NTV and LAMP-NTV fusion proteins shown in panel C. Balb/C mice (N=6) were immunized at day 0 week 3 and week 6 with 100 μg of the indicated plasmids and sacrificed 2 weeks later. Cellular immune responses to Nef, Tat and Vif were determined from splenocytes from individual mice (left panel) and antigen-specific CD4+ and CD8+ T cells were measured (right panels). Statistical analysis was performed using two-tailed Mann Whitney t test, with p values of 0.043 (Nef), 0.043 (Tat) and 0.0022 (Vif). The mean and SEM are shown. (E) The humoral immune responses to Nef were analyzed from plasma samples from individual mice (right panel) as endpoint ELISA titers. The mean is shown. (F) Immunogenicity of NTV and LAMP-NTV in rhesus macaques. Naïve macaques (see Figure 3C) were vaccinated with NTV and LAMP-NTV plasmids as described [31]. The levels of antigen-specific IFN-g producing total (left panel) and CD4+ and CD8+ T cells (right panels) were measured by flow cytometry at 14 weeks post EP4. Mean and SEM are shown. (G) The ART-treated macaques were co-immunized with the LAMP-pol expression vector. The immune responses determined by flow cytometry were measured at the day of EP1 and 2 weeks post EP2. The percent of antigen-specific IFN- g producing CD4+ and CD8+ T cells are shown (Mean and SEM).
