Abstract
The enhanced migration found in tumor cells is often caused by external stimuli and the sequential participation of cytoskeleton-related signaling molecules. However, until now, the molecular connection between the lysophosphatidic acid (LPA) receptor and nonmuscle myosin II (NM II) has not been analyzed in detail for LPA-induced migration. Here, we demonstrate that LPA induces migration by activating the LPA1 receptor which promotes phosphorylation of the 20kDa NM II light chain through activation of Rho kinase (ROCK). We show that LPA-induced migration is insensitive to pertussis toxin (PTX) but does require the LPA1 receptor as determined by siRNA and receptor antagonists. LPA activates ROCK and also increases GTP-bound RhoA activity, concomitant with the enhanced membrane recruitment of RhoA. LPA-induced migration and invasion are attenuated by specific inhibitors including C3 cell-permeable transferase and Y-27632. We demonstrate that NM II plays an important role in LPA-induced migration and invasion by inhibiting its cellular function with blebbistatin and shRNA lentivirus directed against NM II-A or II-B. Inhibition or loss of either NM II-A or NM II-B in 4T1 cells results in a decrease in migration and invasion. Restoration of the expression of NM II-A or NM II-B also rescued LPA-induced migration. Taken together, these results suggest defined pathways for signaling through the LPA1 receptor to promote LPA-mediated NM II activation and subsequent cell migration in 4T1 breast cancer cells.
Keywords: Nonmuscle myosin II, LPA receptor, phosphorylation, migration
Introduction
Lysophosphatidic acid (LPA), one of the simplest natural phospholipids is a bioactive extracellular lipid mediator which also provokes diverse cellular responses including migration, cell proliferation, chemotaxis, and invasion during normal and malignant states (Boucharaba et al. 2006; Hama et al. 2004; Hao et al. 2007; Shida et al. 2008; Tager et al. 2008). LPA, which is abundant in serum, is released from activated platelets and can act in both autocrine and paracrine signaling pathways (Aoki 2004; Pages et al. 2001). It has been used as a hallmark for cancer. The elevated production of LPA and its receptors is concordant with tumor progression in several types of cancer including malignant breast cancer.
Three isotypes of the LPA receptor (LPA1/EDG2, LPA2/EDG4, LPA3/EDG7) have been cloned (An et al. 1998; Bandoh et al. 1999). They belong to the G-protein coupled receptor (GPCR) family, mediate activation of at least three heterotrimeric G-proteins (Gq/11, Gi/o and G12/13) (Moolenaar 1997), and stimulate multiple downstream effectors (Bandoh et al. 2000; Chen et al. 2007; Contos et al. 2002; Im et al. 2000; Ishii et al. 2000). Previous reports suggested that LPA stimulates the RhoA-ROCK pathway leading to membrane ruffles and stress fiber formation and increased cell motility in a variety of cell types including fibroblasts, gliomas, and breast cancer cells (Kitzing et al. 2007; Manning et al. 2000; Tsuji et al. 2002). However, to date, it is still uncertain which of the isotypes of the LPA receptors activates the RhoA-ROCK pathway for cell migration in breast cancer cells. Several reports have shown that the LPA1 receptor contributes to the metastasis of breast cancer xenografts to bone (Boucharaba et al. 2004). The LPA2 andLPA3 receptors are also aberrantly expressed in breast cancers (Kitayama et al. 2004; Liu et al. 2009). Even though these studies suggest a potential contribution of LPA and its receptors in breast tumorigenesis, the specific roles of LPA receptor isotypes have not been fully evaluated and the downstream target molecules for the interrelationship between isotypes of the LPA receptor and RhoA dependent cell migration in breast cancer cells have yet to be identified.
All nonmuscle myosin II (NM II) proteins are hexameric complexes consisting of a pair of nonmuscle myosin heavy chains II (NMHC II), a pair of essential light chains (ELC), and a pair of regulatory light chains (RLC) (Sellers 1999). In mammalian cells, three NMHC-II isoforms (NMHC II-A, NMHC II-B, and NMHC II-C) have been identified (Golomb et al. 2004; Leal et al. 2003; Shohet et al. 1989; Simons et al. 1991; Takahashi et al. 1992). They are distinguished by unique sequences and enzymatic activities. They also exhibit a distinct tissue distribution and cell type specific-expression patterns although these patterns also partially overlap. Furthermore, they play key roles in diverse physiological processes such as cell division, migration, and morphological changes (Bao et al. 2005; Bresnick 1999; Conti and Adelstein 2008; Jana et al. 2006). Phosphorylation of the RLC is crucial for the generation of contractile force in cell migration and this phosphorylation is controlled by a number of kinases including myosin light chain kinase (MLCK) and ROCK (Katoh et al. 2001; Kolega 2003; Totsukawa et al. 2004). Phosphorylation of Ser-19 and Thr-18 on the 20-kDa RLC promotes cell movement in a variety of cell types responding to diverse stimuli. In addition, Ser-19 phosphorylation of the RLC is enriched near membrane protrusions and in areas of cell retraction (Matsumura et al. 1998). Although, the contractile force generated by NM II motor activity is involved in cell motility, little is known about the specific functional roles of NM II in LPA-induced migration in the murine breast cancer cell line, 4T1.
In the present study, we demonstrate that LPA1 receptor signaling is required for ROCK-induced RLC phosphorylation on Ser-19 and NM II activation, leading to migration and invasion in breast cancer cells.
Material and Methods
Materials
LPA, VPC 12249, and VPC 32183 were purchased from Biomol. (−) Blebbistatin was from Sigma. Y27632, pertussis toxin (PTX) and ML-7 were from Calbiochem. C3 cell permeable transferase and RhoA assay kits were from Cytoskeleton Inc. Protease inhibitor cocktail, phosphatase inhibitor cocktail, MLCK siRNA anti-phospho MYPT (Ser-695) antibody, ROCK siRNA, ROCK antibody, immobilized protein A, horseradish peroxidase-conjugated goat anti-rabbit IgG, and goat anti-mouse IgA, IgM, and IgG were from Santa Cruz. Polyclonal anti-phospho RLC (Ser-19), anti-phospho MYPT (Thr-853), anti-Rac1, and anti-Cdc42 antibodies were from Cell Signaling. MYPT-1 rabbit monoclonal antibody was from Epitomics. MYPT-1 rabbit monoclonal antibody was from Abcam. Anti-actin antibody was from Chemicon International. Enhanced chemiluminescence kit (ECL system) was from Pierce. Dulbecco’s modified Eagle’s medium (DMEM) was from Life Technologies, Inc. Polyclonal antibodies for the recognition of NM II-A, II-B, and II-C were generated as described previously and were from covance (Golomb et al. 2004).
Cell culture and transfection
4T1, and MDA-MB-231 cells were maintained in DMEM supplemented with 10% (v/v) fetal bovine serum (FBS) at 37°C in a humidified, CO2-controlled (5%) incubator. MCF-10A cells were maintained in DMEM:F12 (1:1) supplemented with 5% horse serum, 0.5 μg/ml Hydrocortisone, 20 ng/ml EGF, 10 μg/ml insulin, 100 ng/ml Cholera toxin at 37°C in a humidified, CO2-controlled (5%) incubator. 4T1 cells-infected with lentivirus encoding NMHC II-A shRNA or NMHC II-B shRNA were selected for 2 weeks in the presence of puromycin (2 μg/ml). 4T1, and MDA-MB-231 cells were transfected using Lipofectamine 2000 (Life Technologies, Gaithersburg, MD) or Nucleofector kits according to the manufacturer’s instruction (Amaxa, Cologne, Germany) for the transient expression of the indicated siRNA. To introduce GFP-NMHC II-A or GFP-NMHC II-B in NMHC II depleted 4T1 cells, Nucleofector kits were used according to the manufacturer’s instruction. Transfection efficiency was measured by visualization of GFP-expressing cells and ranged from 30–40%. The protein concentration was measured by Bradford assay prior to conducting LPA-induced migration. No significant differences in growth curves (cell death or proliferation) were observed among the samples in response to transfection.
Lentivirus for NMHC II-A shRNA, or NMHC II-B shRNA and siRNA for LPA receptors, NMHC II-A, or NMHC II-B
The shRNA plasmids for mouse Myh 9, and Myh 10 were purchased from Open Biosystems. The lentiviruses encoding NMHC II-A shRNA or NMHC II-B shRNA were harvested by triple transfection using packing plasmids (pCMV-VSV-G and pCMV-dR8.2 dvpr) and target plasmids (shRNA for mouse NMHC II-A or NMHC II-B) in 293T cells. The shRNA for mouse NMHC II-A was used as a sequence of hairpin (CCGGCGGTAAATTCATTCGTATCAACTTCGAGTTGATACGAATGAATTTACCGTTTTTG) and shRNA for mouse NMHC II-B was also used as a sequence of hairpin (CCGGGCCAGGATGAAGCAGCTTAAACTCGAGTTTAAGCTGCTTCATCCTGGCTTTTTG). After 24 h of transfection, the media was filtered using a 0.45 μm filter membrane as described previously (Singer and Verma 2008; Stewart et al. 2003). Control shRNA was used as a negative control (sequence of hairpin is CCTAAGGTTAAGTCGCCCTCGCTCTAGCGAGGGCGACTTAACCTTACC). The siRNAs for mouse LPA receptors including the LPA1, LPA2 and LPA3 receptors were purchased from Santa Cruz. The specific siRNA duplex for human NMHC II-A (Ref seq accession number NM_002473) or NMHC II-B (Ref seq accession number NM_005964) was chemically synthesized by Dharmacon, Inc. (Lafayette, CO) and Qiagen (Valencia, CA). Control siRNA (luciferase) was purchased from Dharmacon, Inc. Results of a BLAST search of all siRNA sequences revealed no significant homology to any other sequences in the database.
RNA isolation, reverse transcription (RT)-PCR, and quantitative real-time PCR
Total RNA was extracted from 4T1, MDA-MB-231, MCF-10A cells using an RNeasy mini kit (Qiagen). Reverse transcription-PCR was performed on 0.5 μg RNA in a final volume of 25 μl using the SuperScriptTMIII One-Step RT-PCR system with Platinum® Taq DNA polymerase (Invitrogen). RT-PCR was carried out on 2x reaction mixtures in the presence of 0.4 mM each dNTP, 0.2 μM gene specific primers and cDNA synthesis was followed immediately by PCR amplification, as follow: cDNA synthesis (1 cycle: 55°C for 40 min), Denaturation (1 cycle: 94°C for 2 min), PCR amplification (35 cycles: 94°C for 20 sec, 55°C for 20s, 72°C for 40 sec), and final extension (1 cycle: 72°C for 7 min). LPA1, LPA2 and LPA3 receptor primers were as follows LPA1 forward: 5′-ATCTTTGGCTATGTTCGCCA-3′ and reverse: 5′-TTGCTGTGAACTCCAGCCA-3′; LPA2 forward: 5′-TGGCCTACCCTTCCTCATGTTCCA-3′ and reverse:5 ′-GACCAGTGAGTTGGCCTCAGC-3′, LPA3forward:5′-GAGGATGAGAGTCCACAG-3′ and reverse:5′-GCACAGCAGATCATCTTC-3′ (Chun et al. 1999; Eshel et al. 2005). For real-time PCR, we used the SuperScript first-strand synthesis system (Invitrogen) and prepared cDNA from 1 μg of RNA. One-quarter of the reaction was then used for quantitative real-time PCR. Expression of LPA1, LPA2, and LPA3 receptors was assessed with available probes, reagents, and the ABI7500 sequence detector as recommended by the manufacturer (Applied Biosystems).
Transwell migration and invasion assay
Migration assays were performed as described previously using transwell migration chambers (8 μm pore size, BD Falcon) (Gunawardane et al. 2005). MDA-MB-231, 4T1-WT cells or 4T1 cells stably infected with shRNA lentivirus encoding NMHC II-A or NMHC II-B were allowed to grow to subconfluency and were serum-starved for 24 h. After detachment with trypsin, cells were washed with PBS, and resuspended in serum free medium. For migration assays, 2×10⁵ cells were seeded in the top chamber well (apical side) of a non-coated membrane (6-well insert). For invasion assays, 5×10⁵ cells were plated in the top chamber well of a matrigel-coated membrane (6-well insert). After 12 h of migration at 37°C, cells remaining on the apical side of each insert were removed with a cotton swab. The cells that had migrated to the basal side of the membrane were collected following trypsin treatment. These harvested cells were counted following trypan blue staining. The images of the cells migrating to the basal sides were displayed at the indicated LPA concentration- or serum-condition after washing two-times with PBS, fixation with 4 % formaldehyde for 10 min, and then staining with trypan blue. Cell migration assays were performed in duplicate per experiment and repeated at least three times. Values for duplicate counting are reported as mean and SE of mean as described previously (Gunawardane et al. 2005).
Wound-healing assay
Cell motility was measured by both transwell migration chamber assay and wound-healing migration assay. 4T1-WT cells, or 4T1 cells stably infected with shRNA lentivirus encoding NMHC II-A or NMHC II-B were grown to a confluent monolayer (~75–80%) on 6-well culture plates and were serum-starved for 24 h. Wounds were made in the monolayer with a sterile micropipette tip. After wounding, loose cells or cell debris were removed by washing. Fresh medium containing various reagents were added immediately. Phase-contrast images of the wound were obtained at various times over a 12 h period after wounding. Wound widths were measured at a minimum of six different times. Each side of the wounds was marked using a pen on the bottom of the 6-well dish, and average values of wound widths were calculated for the indicated times. Migration of the cell front was measured using the ImageJ software package (NIH).
Rho A, Rac1, and Cdc42 activity assay
4T1 breast cancer cells were cultured in 100 mm dishes. After treatment with LPA at the indicated times with or without other reagents, these cells were washed with PBS, and then lysed with lysis buffer (50 mM Tris-HCl pH 7.5, 10 mM MgCl2, 0.5 M NaCl, 2% Igepal, and protease inhibitor cocktail). Equal amounts of total proteins from clarified lysates were incubated with Rhotekin-RBD beads to precipitate GTP-bound RhoA, accordingly to the manufacturer’s instructions (Cytoskeleton Inc.). Precipitated GTP-bound RhoA was separated using SDS 4–20% PAGE and immunoblotted with indicated specific antibodies such as RhoA (Cytoskeleton Inc.). To precipitate GTP-bound Rac1, and Cdc42, PAK-PBD beads were used as the same methods. To fractionate the membrane and cytosol from cell lysates, 4T1 cells were washed with PBS, lysed with hypotonic buffer (10 mM Tris-HCl pH 7.5, 10 mM NaCl,10 mM MgCl2, 1 mM DTT, 1 mM PMSF, and protease inhibitor cocktail), centrifuged at 600 × g for 5 min to remove the nuclei and intact cells, and then centrifuged at 15000 × g for 30 min at 4°C to obtain the membrane and cytosol fractions. Membrane and cytosol fractions were analyzed by SDS 4–20% PAGE and by immunoblotting with indicated antibodies such as RhoA, Rac1, and Cdc42.
Immunoblot analysis
4T1 cells, MDA-MB-231 cells, MCF-10A cells, and mouse lung tissue were washed twice with ice-cold PBS and lysed with lysis buffer (50 mM Tris-HCl, pH 8.0, 0.3 M NaCl, 1% Triton X-100, 0.25% Na-deoxycholate, 5 mM EDTA, 1 mM DTT, 1 mM PMSF, protease inhibitor cocktail, and phosphatase inhibitor cocktail). After brief sonication, the lysates were centrifuged at 15,000 × g for 15 min. In samples subjected to immunoprecipitation, supernatants were incubated with anti-nonmuscle myosin II-A, or II-B antibodies for 9 h and these immunocomplexes were recovered by incubation with protein A Sepharose beads for 2 h. Immunoprecipitates were denatured by incubation at 95°C for 5 min in a Laemmli sample buffer, and then separated by SDS 6% or 4–20% PAGE, and finally transferred to nitrocellulose membranes. After blocking in PBST buffer (PBS buffer + 0.05% Tween 20) containing 5% skimmed milk powder, the membranes were incubated with the indicated individual monoclonal or polyclonal antibodies, and subsequently reincubated with either anti-mouse or anti-rabbit IgG coupled with horseradish peroxidase. Detection was performed using enhanced chemiluminescence kit (Pierce) according to instructions of the manufacturer. The protein concentration was determined by Bradford assay.
MTT assay of the breast cancer cells viability
The MTT assay was used as a crude measurement of cell viability (Fowker et al. 2000). MTT is a yellow tetrazolium [3-(4, 5-dimethylthiazol-2-yl)-2, 5-diphenyltetrazolium bromide] dye, which is converted by metabolically active cells into a colored water-insoluble formazan salt. The cells were seeded at 5 × 10⁴/ml (50 μl/well) in 96-well plates, grown for 12 h, and depleted with serum for the indicated times. MTT reagent (5 mg/ml in PBS) was then added to the cells (5 μl/well), and the cultures were incubated at 37°C for 2 h. The reaction was stopped by the addition of 60 μl isopropanol (including 0.2% HCl), and the tetrazolium crystals were dissolved at room temperature. The samples were measured by a Perkin Elmer Microtitre Plate Reader, at a test wavelength of 450 nm.
Statistical analysis
The results are expressed as the mean ± SE of data obtained from the indicated number of experiments performed. Statistical significance was determined using Student’s t test
Result
Migration of breast cancer cells is dependent on LPA stimuli
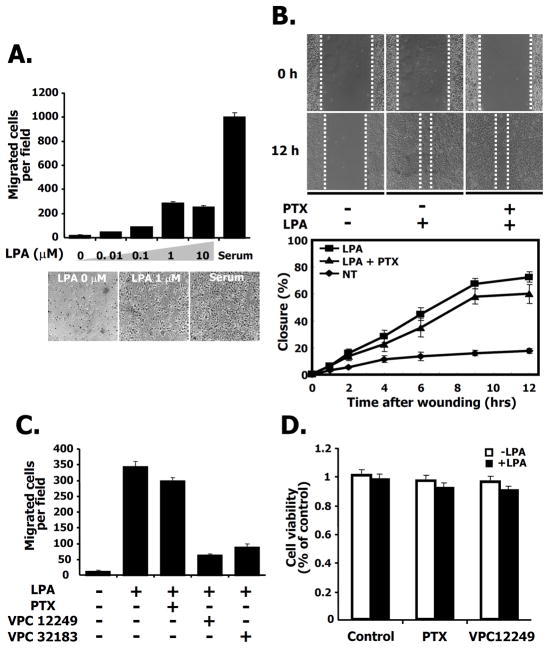
To determine whether LPA induces migration of 4T1 breast cancer cells, we used transwell migration assays with serum as a positive control. After the withdrawal of serum for 24 h, LPA induced cell migration in a dose-dependent manner showing a maximum stimulation of migration at 1 μM LPA (Fig. 1A, top panel). The images of the cells that migrated to the bottom of the membrane are also shown (Fig. 1A, bottom panel). In addition to transwell migration assays, we also used a 2D migration, wound healing assay. As shown in Fig. 1B, 12 h after wounding, 4T1 cells migrated to almost close the wound following LPA treatment. We plotted the distance of wound-width for migrating cells at various times indicated at the bottom panel of Fig. 1B. Furthermore, we also examined the effects of pertussis toxin (PTX) on LPA-induced migration to investigate whether the LPA receptor was sensitive to PTX. Although the wound width was reduced by LPA treatment, the decrease was only slightly affected by PTX treatment (Fig. 1B). To determine which receptor isotype was involved, we examined the effect on migration by antagonists of both the LPA1 and LPA3 receptors using VPC 12249, and VPC 32183, in a transwell migration assay. After treatment with VPC 12249 or VPC 32183, the number of cells migrating was dramatically attenuated compared to cells treated with LPA alone (Fig. 1C). To exclude a possible influence of cell proliferation on the number of migrating cells after treatment with PTX or LPA receptor antagonists, we measured cell viability under the same conditions. There was no significant difference in cell proliferation following treatment with PTX or VPC12249 regardless of the presence or absence of LPA (Fig. 1D). Taken together, these results suggest that LPA-induced migration is involved in a PTX-insensitive pathway that also requires the LPA1, or LPA3 receptor isotypes (or both) in 4T1 breast cancer cells.
Fig. 1. Breast cancer cell line 4T1 migration induced by LPA is pertussis toxin (PTX) insensitive.
A. LPA-stimulated cell migration in transwell chambers. 4T1 cells (2×10⁵) were plated in transwell chambers and then serum starved for 24 h. Cell migration was performed in the indicated concentrations of LPA, or serum (10% FBS) for 12 h. Serum was used as a positive control. LPA-induced migrating cells were counted as described in Experimental Procedures. Migration was assessed in three independent transwell chambers for each condition. The phase contrast micrographs of migrated cells on the basal sides of the transwell membranes are shown for the indicated LPA concentration or serum condition. Bars represent SE for the mean number of cells migrated per field from triplicate determinations. B. Effect of pertussis toxin (PTX, 100ng/ml) on LPA-induced migration in a wound-healing assay (Upper panels) and measurement of cell migration after wounding (Lower panel). 4T1 cells were serum starved for 24 h. The wound was made by scratching with a pipette tip at time 0 h. After 12 h, the image of the wound was measured according to the dashed lines. The graph shows the width of the wound at the indicated time point, expressed as a percentage of the initial distance at time 0 h. C. Cell migration in transwell chambers. 4T1 cells were serum starved for 24 h. Cells were treated with LPA and PTX (100ng/ml) a heterotrimeric G protein inhibitor or VPC 12249 (1mg/ml) or VPC 32183 (1mg/ml) used as LPA1,3 receptor antagonists. After 12 h, migration was assessed as described in Experimental Procedures. These values are representative of three independent experiments. D. Effects of a heterotrimeric G protein inhibitor (PTX) or LPA1,3 receptor antagonist (VPC 12249) on cell viability. 4T1 cells were serum starved for 24 h and then treated with control (vehicle), PTX (100ng/ml) or VPC 12249 (1mg/ml) in the presence or absence of LPA. After 12 h, cell viability was measured as described in Experimental Procedures.
LPA1 receptor is required for LPA-induced migration
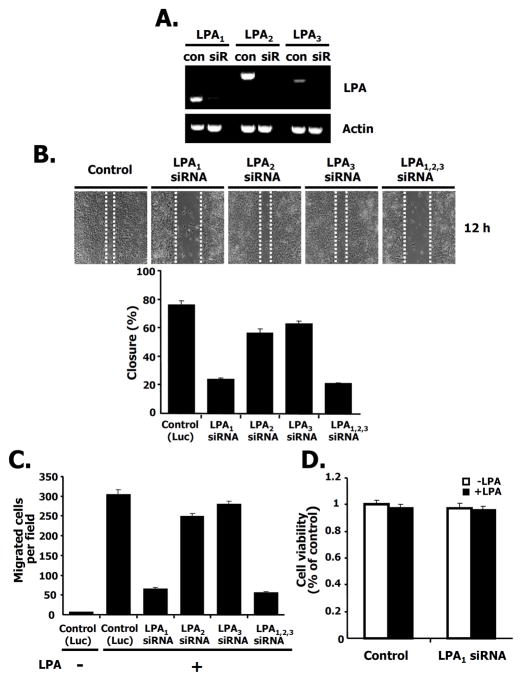
To verify the specificity of the LPA receptor isotype in breast cancer cell migration, we decreased the LPA receptor isotypes using siRNAs directed against LPA1, LPA2 or LPA3. As shown in Fig. 2A, LPA1, LPA2, and LPA3 receptors were expressed in 4T1 breast cancer cells and each of them is specifically silenced by the specific LPA receptor siRNA compared with control siRNA (see also Supple. Fig. 1A). We then investigated LPA-induced migration using a wound-healing assay after specifically silencing each receptor isotype (Fig. 2B, quantified in the bottom panel). SiRNA directed against LPA1 decreased LPA-induced migration compared to control siRNA. Lowering LPA1 orLPA1 had a significantly smaller effect on migration. LPA-mediated migration using siRNAs to all three LPA receptors also shows a similar pattern to that of the LPA1 receptor (Fig. 2B). To measure the number of migrating cells after silencing each LPA receptor isotype, we counted the LPA-induced migrating cells using a transwell assay following LPA treatment. We observed that LPA- induced migration in either the LPA1 receptor silenced cells or LPA1,2,3 receptors silenced cells was significantly attenuated, but cell migration was not significantly affected in either LPA2 or LPA3 receptor knock-down cells (Fig. 2C). To rule out any effect of cell proliferation by LPA1 receptor silencing, we examined cell viability under the same conditions and found that there was no difference between control and LPA1 receptor silenced cells regardless of the presence or absence of LPA (Fig. 2D). These results indicate that the LPA1 receptor is responsible for LPA-induced migration in this breast cancer cell.
Fig. 2. The LPA1 receptor is involved in breast cancer cell migration.
A. The silencing effects of siRNAs for LPA1, LPA2, and LPA3 receptors. 4T1 cells were transfected with the indicated siRNAs for LPA1, LPA2, or LPA3 receptors (siR) or for luciferase as a control (con). After 48 h transfection, RT-PCR was performed as described in Experimental Procedures. B. Effects of siRNA for LPA1, LPA2, and LPA3 receptors on LPA-induced migration in wound-healing assays (Upper panel). Measurement of distance for LPA-induced migration after silencing of the indicated LPA receptor isotypes (Lower panel). 4T1 cells were transfected with siRNAs for LPA1, LPA2, or LPA3 receptors or LPA1,2,3 receptors together or control siRNA (luciferase). Twenty-four hrs after transfection, cells were serum starved for 24 h and then wounded using pipette tips in the presence of LPA. After 12 h, wound size was measured as described in Experimental Procedures. The size of the wound was measured and expressed as a percentage of the initial wound size at time 0 h. C. Effects of siRNAs for LPA1, LPA2, or LPA3 receptors or LPA1,2,3 receptors on cell migration using transwell chambers. 4T1 cells were transfected with siRNAs for the indicated receptors or control siRNA (luciferase). Twenty-four hrs after transfection, cells were serum starved for 24 h. Cell migration was performed in the presence or absence of LPA. After 12 h, LPA-induced migrating cells were counted. These values are representative of three independent experiments. D. Effect of LPA1 receptor knock down on cell viability. 4T1 cells were transfected with siRNAs for the indicated LPA1 receptors or control siRNA (luciferase). After 24 h of transfection, these cells were serum starved for 24 h. Cell viability was measured in the presence or absence of LPA for 12 h.
LPA induces RhoA activation
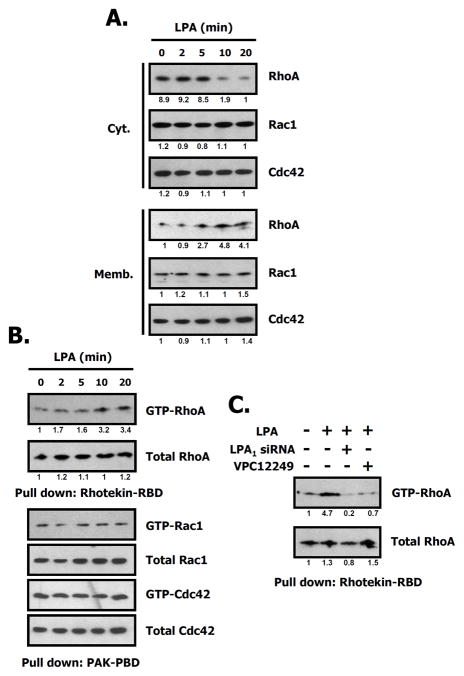
A number of previously published papers have suggested that LPA is one of the stimuli activating several small G proteins including RhoA, Rac1, and Cdc42 in a variety of cell types (Moolenaar 1995; Ueda et al. 2001). We investigated the status of RhoA family activation by LPA. As shown in Fig. 3A, RhoA was translocated from the cytosol to the membrane after being activated for 10 min by LPA in 4T1 cells, while other small G proteins including Rac1, Cdc42 weren’t translocated to the membrane under the same conditions. Note that LPA induced the stimulation of RhoA in a time-dependent manner. Fig. 3B also shows that RhoA activity was maximal at 10 min as measured by the amount of RhoA-GTP pulled down using the Rhotekin-RBD assay. To verify the involvement of the LPA1 receptor in RhoA activation, we investigated the amount of RhoA-GTP using a pull-down assay after transfection with siRNA directed to the LPA1 receptor, or treatment with the LPA1,3 receptor antagonist VPC 12249. The results demonstrate that RhoA activity is significantly augmented by LPA, but inhibited in the presence of VPC 12249 or by transfection of siRNA for the LPA1 receptor (Fig. 3C). These results suggest that LPA specifically enhances RhoA activity by the loading of GTP concurrent with membrane recruitment through the LPA1 receptor.
Fig. 3. LPA induces RhoA activation in 4T1 cells.
A. Translocation of RhoA to the membrane by LPA treatment. 4T1 cell lysates were separated into cytosol (Cyt.) and membrane (Memb.) fractions after LPA treatment. An equal amount of protein (50 μg) was analyzed by SDS 4–20% PAGE, and immunoblotted with the indicated antibodies. Relative intensity of signal was determined using ImageJ (NIH). Data represent one of three independent experiments. B. Time dependence of RhoA activation by LPA (1 μM). After treatment with LPA for the indicated times, cell lysates were harvested and centrifuged. The supernatants were used for pull-down assays with Rhotekin-RBD or PAK-PBD beads. Relative intensity of signal was determined using ImageJ (NIH). Three independent assays are performed. C. Involvement of LPA receptors in RhoA activation. 4T1 cells were treated with LPA for 10 min after silencing of the LPA1 receptor or treatment with VPC12249, an LPA1,3 receptor antagonist. Relative intensity of the signal was determined using ImageJ (NIH).
ROCK stimulated by LPA is required for migration
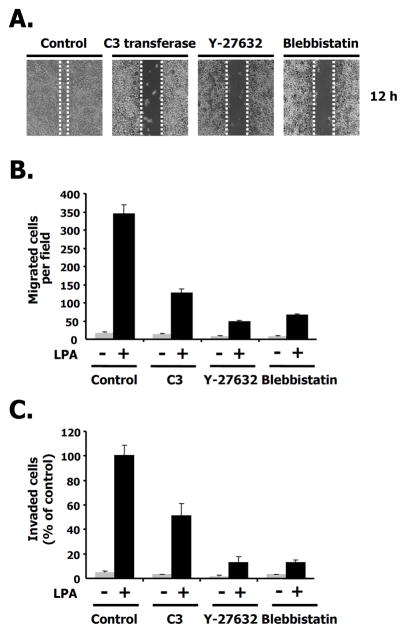
Next, we addressed the question of identifying the downstream targets for RhoA signaling in migration. Previous work suggested that Rho kinase (ROCK) was the downstream effector of RhoA in a variety of cell types (Maekawa et al. 1999). Other groups have shown that NM II was also implicated in cellular responses such as cell motility, and migration (Dulyaninova et al. 2007). We investigated whether LPA-induced migration was affected by blebbistatin, a known NM II inhibitor as well as by the specific RhoA inhibitor, C3 cell permeable transferase. We also used Y27632 as a ROCK inhibitor. As shown in Fig. 4A, LPA-induced migration was attenuated by the C3 cell permeable transferase (2 μg/ml) and by Y27632 (5 μM) in the wound healing assay. LPA-induced migration was also affected by blebbistatin (10 μM) under the same conditions. To further quantitate the effects of LPA-induced migration by these inhibitors, we counted the number of migrating cells following LPA treatment using the transwell assay. After treatment with either C3 or Y27632, LPA-induced migration was dramatically decreased. The ROCK inhibitor, Y27632, potently inhibited LPA-mediated migration more than the RhoA inhibitor, C3 cell permeable transferase. Blebbistatin (10 μM) also prevented LPA-induced migration (Fig. 4B). As shown in Fig. 4C, we also determined the number of invading cells following LPA treatment using a matrigel-coated membrane transwell assay and obtained similar results to the LPA-induced migration assay (Figs. 4B and C). As expected, the disruption of LPA-induced migration by specific RhoA pathway inhibitors correlated with that of the wound healing assay shown in Fig. 4A. These results suggest that the RhoA-ROCK pathway is required for LPA-induced migration in 4T1 breast cancer cells.
Fig. 4. LPA-induced ROCK activity is required for migration.
A. Effects of the C3 cell permeable transferase (2 μg/ml), Y27632 ROCK inhibitor (5 μM), or blebbistatin, a nonmuscle myosin II inhibitor (10 μM) on LPA-induced migration in wound-healing assays. Images of 4T1 cells are shown 12 h after wounding. B. 4T1 cells were treated with the C3 cell permeable transferase, Y27632, or blebbistatin in the presence or absence of LPA for each condition. After 12 h, migrating cells were quantified as described in Experimental Procedures. These values represent the mean ± SE. C. Effects of C3 cell permeable transferase, Y27632, or blebbistatin on a LPA-induced invasion assay. These values represent the mean ± SE.
LPA induces NM II-A and NM II-B phosphorylation through ROCK
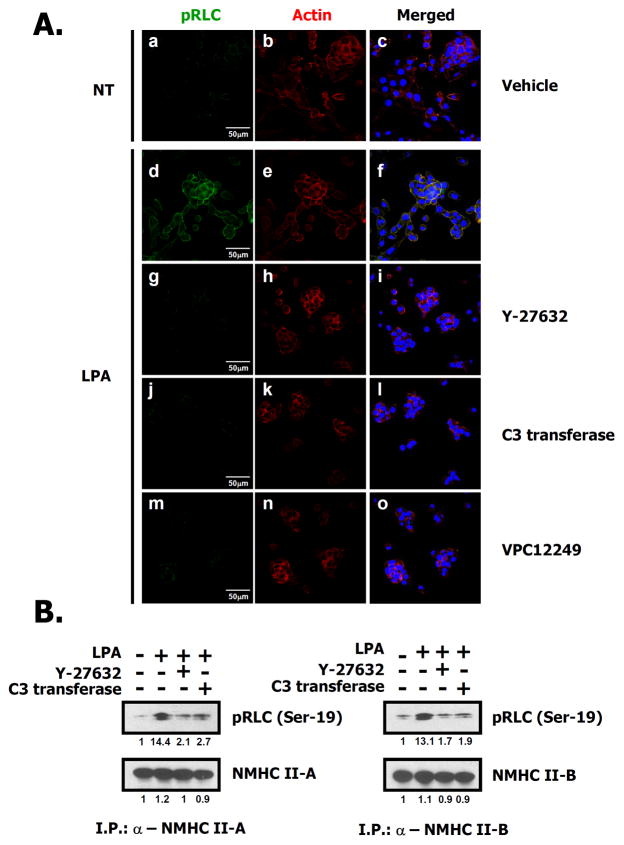
Since both the ROCK inhibitor, Y27632, and the NM II inhibitor, blebbistatin, prevented LPA-induced migration (Fig. 4), we examined the phosphorylation of the regulatory light chain (RLC) at the Ser-19 site by ROCK after treatment with LPA. As shown in Fig. 5A, the phosphorylation of the RLC was increased by LPA treatment, and no signal can be detected in the presence of inhibitors even following treatment with high concentrations of LPA (10 μM). To gain further insight, we immunoprecipitated each of two NM II isoforms found in these cells (see Supple. Fig. 1B), NM II-A and NM II-B using specific antibodies and then measured changes in phosphorylation of the RLC induced by LPA. As shown in the immunoblots in Fig. 5B, phosphorylation of the RLC was significantly enhanced by LPA, but this phosphorylation was attenuated in the presence of Y27632 or C3 cell permeable transferase. However, no significant difference of the RLC phosphorylation associated between NMHC II-A and II-B was observed in this condition. To further verify whether the ROCK-induced phosphorylation of the RLC was mediated by the LPA1 receptor or not, we investigated the phosphorylation of the RLC after transfection of siRNA directed against the LPA1 receptor. Supplementary Fig. 2 demonstrates that this phosphorylation of the RLC was significantly attenuated following introduction of LPA1 receptor siRNA. Based on these results, we suggest that ROCK is involved in LPA-induced RLC phosphorylation and there is no significant difference in phosphorylation between RLCs associated with NMHC II-A or NMHC II-B following LPA treatment.
Fig. 5. ROCK activated by LPA phosphorylates the RLC in both NM II-A and NM II-B.
A. 4T1 cells were serum starved for 24 h. Cells were treated with LPA (d–o) for 10 min after 30 min pretreatment with Y27632 (5 μM, g–i), VPC12249 (1 μM, m–o) or after 2 h pretreatment with C3 transferase (2 μg/ml, j–l). Cells were fixed and stained with rhodamine-phalloidin (red) to visualize actin or anti-pRLC antibody (Ser-19) (green) to detect phosphorylated RLCs. The blue color is DAPI staining to mark nuclei. B. 4T1 cells were serum starved for 24 h. After 30 min pretreatment with Y27632 (5 μM) or 2 h pretreatment with C3 transferase (2 μg/ml), cells were treated with LPA for 10 min, harvested and then lysed. NMHC II-A or II-B were immunoprecipitated with isoform-specific antibodies, separated by SDS-PAGE, and immunoblotted with the indicated antibodies. Relative intensity of signal was determined using ImageJ (NIH).
The effects of MLCK and MYPT-1 on LPA-induced migration
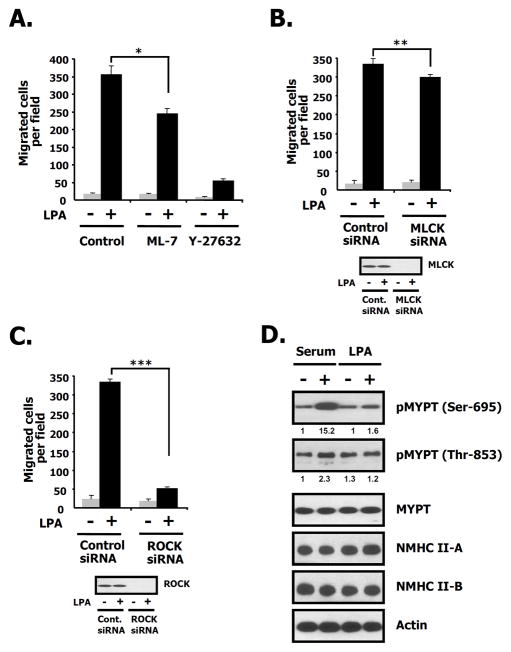
Since myosin light chain kinase (MLCK) can affect migration (Matsumura and Hartshorne 2008; Nguyen et al. 1999), we utilized ML-7, a known MLCK inhibitor, and MLCK siRNA to confirm the molecular regulators for LPA-induced migration. Fig. 6A demonstrates that ML-7 (25 μM) only partially attenuated LPA-induced migration compared to the ROCK inhibitor, Y-27632 (5 μM) which was approximately 5-fold more effective at the concentration used. Fig. 6B also shows that LPA-induced migration was only slightly decreased in MLCK siRNA-transfected cells compared to control siRNA-transfectd cells. These results suggest that MLCK is not significantly involved in LPA-induced migration in 4T1 breast cancer cells. To determine whether the silencing of ROCK disrupts LPA-induced migration or not, we measured LPA-induced migration after the transfection with ROCK siRNA. Fig. 6C demonstrates that LPA-induced migration was decreased in ROCK siRNA-transfected cells compared to control siRNA-transfectd cells. To determine whether LPA1 activation of ROCK results in inhibition of myosin phosphatase activity, we measured whether the target subunit of myosin phosphatase-1 (MYPT-1) is phosphorylated on Ser-695 and Thr-853 (Matsumura and Hartshorne 2008). Serum, used as a positive control, increases phosphorylation of Ser-695 and Thr-853 of MYPT-1. LPA only slightly increases phosphorylation of Ser-695 of MYPT-1, and has no any effect on phosphorylation of Thr-853 (Fig. 6D). These results suggest that LPA-induced migration was not linked to inactivation of myosin phosphatase activity. Taken together, these results lead us to conclude that LPA-induced migration is dependent on ROCK directly phosphorylating the RLC of NM II-A and NM II-B in 4T1 breast cancer cells.
Fig. 6. The effects of ML-7, Y27632 or MYPT-1 on LPA-induced migration.
A. After cells were serum starved for 24 h, cells were treated with control (vehicle), Y27632 (5 μM), or ML-7 (25 μM) in the presence or absence of LPA (1 μM). After 12 h, cell migration was counted. Bar graph quantifies LPA-induced migration in the presence or absence of LPA for each condition. These values represent the mean ± SE. *p< 0.05 versus vehicle-treated cells. B. 4T1 cells were transfected with the indicated siRNAs for MLCK or luciferase (control). Twenty-four hrs after transfection, cells were serum starved for 24 h and then incubated in the presence or absence of LPA. After 12 h, LPA-induced migration was measured. The values in the bar graph represent the mean ± SE.**p< 0.01 versus control (luciferase) siRNA-transfected cells. C. Cells were transfected with the indicated siRNAs for ROCK and luciferase (control). Twenty-four hrs after transfection, cells were serum starved for 24 h and then incubated in the presence or absence of LPA. After 12 h, LPA-induced migration was measured. The values in the bar graph represent the mean ± SE. ***p< 0.01 versus control (luciferase) siRNA-transfected cells. D. After 4T1 cells were serum starved for 24 h, cells were treated with serum (10%) or LPA (1 μM) for 10 min. Cells were harvested, lysed, centrifuged, and the supernatants were subjected to SDS 4–12 % PAGE. The membranes were probed with the indicated antibodies to pMYPT (Ser-695, Thr-853), MYPT-1, NMHC II-A, II-B and actin. Actin was used as a loading control. Relative intensity of signal was determined using ImageJ (NIH).
NM II-A and NM II-B are both key players for LPA-induced migration
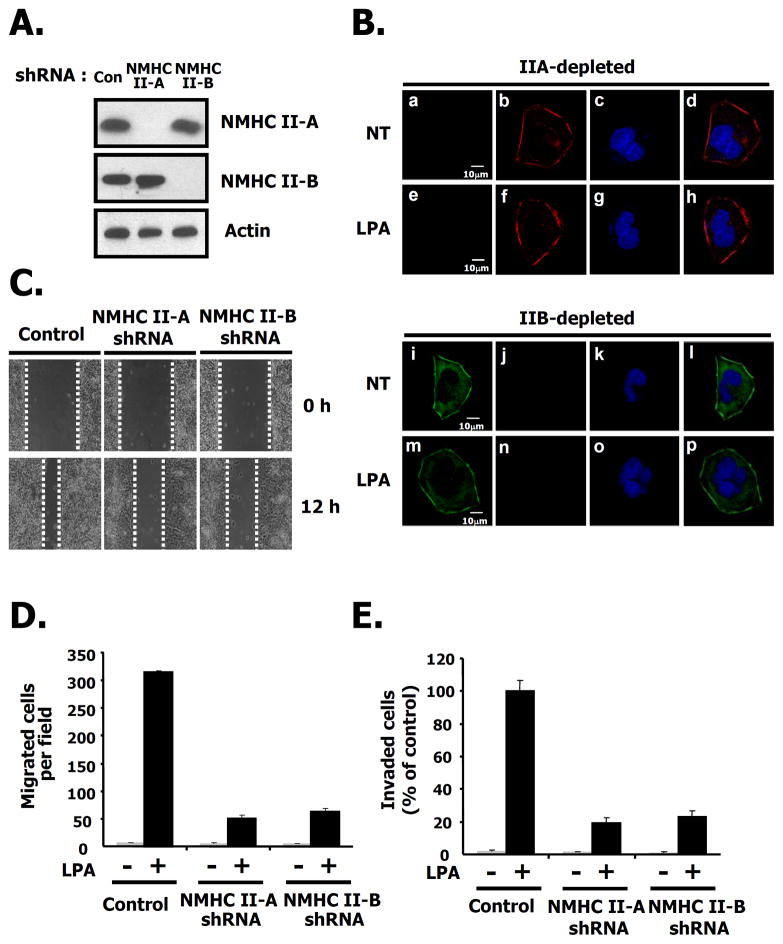
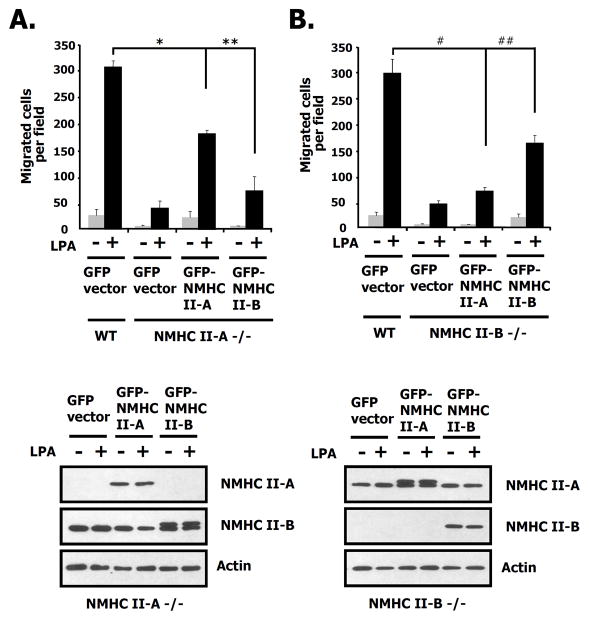
Considering that both migration and invasion stimulated by LPA was interrupted by the specific NM II inhibitor, blebbistain (Figs. 4B and C) and the endogenous expression of NMHC II-A, and B was detected but that of NMHC II-C wasn’t observed in the 4T1 cells (Supple. Fig. 1B), we generated stable knock down cells of NMHC II-A and B using shRNA lentivirus in order to investigate the roles of NM II-A and NM II-B for LPA-induced migration. First we quantified the relative amount of NM II-A and NM II-B in 4T1 cells using mass spectrometry and found that there was approximately 6–7 times more NM II-A than NM-B (data not shown). Immunoblotting and immunofluorescence microscopy reveal that NMHC II-A, and II-B were completely ablated in 4T1 cells by shRNA lentivirus (Figs. 7A, and B). We then measured the migration of the knock-down cells using a wound healing assay. These results show that after wounding, LPA-induced migration in either NMHC II-A or II-B knock down cells was slowed compared to that of control cells (Fig. 7C). To further quantify cell movement, we counted the cells responding to LPA using a transwell assay. As shown in Figs. 7D and E, LPA-induced migration and invasion were decreased in NMHC II-A, or II-B knock-down cells, respectively. These results suggest that both NM II-A and II-B are required for LPA-induced migration and invasion in breast cancer cells. To document whether these effects are reversible, we introduced the GFP-NMHC II-A or GFP-NMHC II-B in NMHC II depleted 4T1 cells. As shown in Fig 8A, expression of GFP-NMHC II-A in NMHC II-A shRNA infected 4T1 cells rescued LPA-induced migration compared to the GFP vector alone. However, adding-back of GFP-NMHC II-B in NMHC II-A silenced 4T1 cells only partially rescued compared to GFP-NMHC II-A. Fig. 8B also demonstrated that similar results were obtained following depletion of NMHC II-B. Restoration of expression of GFP-NMHC II-A or B was confirmed through immunoblotting (Fig. 8 bottom panel) Theses results suggest that NMHC II-A and II-B play distinct roles on LPA-induced migration in 4T1 cells.
Fig. 7. Both NM II-A and NM II-B play a role in 4T1 cell migration.
A. The effects shRNA silencing of NMHC II-A or NMHC II-B in 4T1 cells. After infection with lentivirus, equal amounts of protein in cell lysates were loaded and subsequently immunoblotted with the indicated antibodies to NMHC II-A, II-B, or actin as a loading control. B. 4T1 cells were plated on poly-D-lysine-coated culture slides. After starving in serum-free media for 24 h, cells were incubated in the presence or absence of LPA for 10 min. NMHC II-A or II-B depleted 4T1 cells were fixed and then immunostained with specific antibodies to NMHC II-A (green) and II-B (red) to detect the myosin isoforms. C. A wound was generated by scratching at time point 0 h. After 12 h, the image of the wound is shown in 4T1 cells stably infected with the indicated shRNAs or control, scrambled shRNA. D. Quantification of LPA-induced migration in 4T1 cells stably infected as described for C, above. These values represent the mean ± SE. E. LPA-mediated invasion using matrigel-coated membranes. These values represent the mean ± SE.
Fig. 8. Rescue by GFP-NM II-A or GFP-NM II-B after NM II-A or II-B depletion in 4T1 cells.
A. Quanitification of LPA-induced migration after restoration by vector, GFP-NMHC II-A or GFP-NMHC II-B in NMHC II-A depleted 4T1 cells. Cells were harvested, lysed, centrifuged, and the supernatants were subjected to SDS 412 % PAGE. The membranes were probed with the indicated antibodies to NMHC II-A, II-B and actin. Actin was used as a loading control. These values represent the mean ± SE. *,**p< 0.01 versus GFP vector-transfected cells. B. Quanitification of LPA-induced migration using NMHC II-B depleted 4T1 cells as described in A, above. These values represent the mean ± SE. #, ##p< 0.01 versus GFP vector-transfected cells.
LPA-induced migration in MDA-MB-231 cells
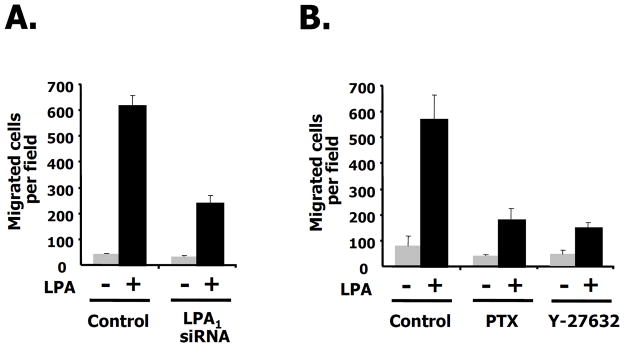
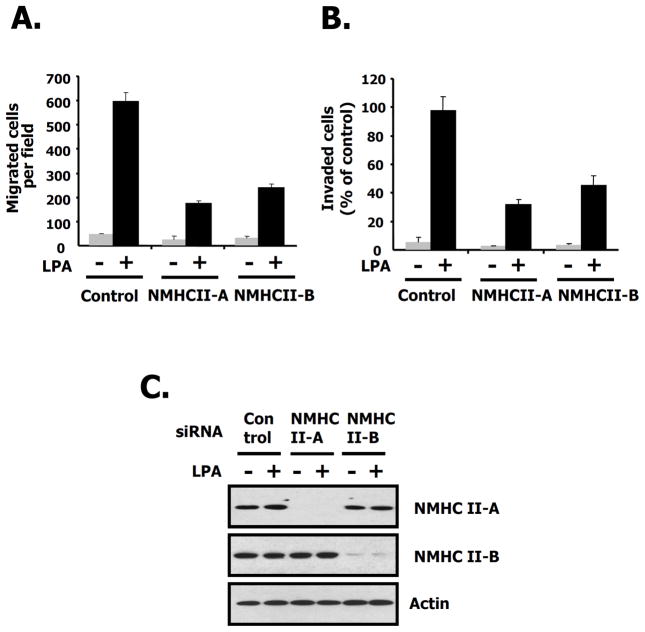
Based on these results, we investigated whether LPA-induced migration is dependent on cell type, by using a second line of human breast cancer cells, MDA-MD-231. Some reports have suggested that the LPA1 receptor was more highly expressed in MDA-MB-231 than any other human breast cancer cell line (Bandoh et al. 1999; Hama et al. 2004; Shida et al. 2008; Supple. Fig. 1A). As shown in Fig. 9A, to verify the effect of the LPA1 receptor on LPA-induced migration, we measured the number of migrating cells after silencing the LPA1 receptor. LPA-induced migration in these cells was significantly attenuated compared to control. The silencing of the LPA1 receptor by siRNA was confirmed in MDA-MB 231 cell (data not shown). We then measured LPA-induced migration using PTX and Y-27632 in the absence or presence of LPA. As shown in Fig. 9B, both PTX and Y-27632 inhibited the LPA-induced migration to the same extent. These results suggest that LPA-induced migration is involved in both a PTX-sensitive pathway and a ROCK-dependent pathway in MDA-MB-231 cells. Next, we measured the number of LPA-induced migrating or invading cells after silencing either NMHC II-A or II-B. Fig. 10 demonstrates that migration (Fig. 10A) and invasion (Fig. 10B) were dramatically attenuated by either decreasing NM II-A, or II-B compared to control cells. The silencing of NMHC II-A or II-B was verified by immunoblotting in MDA-MB 231 cell (Fig. 10C). Therefore, we suggest that NM II-A or II-B also play an essential role for LPA-induced migration and invasion in MDA-MB-231 cells.
Fig. 9. LPA1-induced migration in MDA-MB-231 cells.
A. MDA-MB-231 cells were transfected with LPA1 receptor or control (luciferase) siRNAs. Twenty-four hrs after transfection, cells were serum starved for 24 h. After 12 h, LPA-induced migration was measured for MDA-MB-231 cells using a transwell chamber. These values are representative of three independent experiments. B. Effects of pertussis toxin (PTX, 100ng/ml) and Y27632 (5 μM) on LPA-induced migration. Migration in the presence or absence of LPA was quantificated for each condition. These values represent the mean ± SE.
Fig. 10. The effects of decreasing NM II-A or II-B on LPA-induced migration in MDA-MB-231 cells.
A. Measurement of LPA-induced migration after NMHC II-A or II-B siRNA treatment in MDA-MB-231 cells. Migration of NMHC II-A or II-B siRNA treated cells was measured in the presence or absence of LPA. These values represent the mean ± SE. B. LPA-mediated invasion of NMHC II-A, or II-B siRNA treated cells or control (luciferase) siRNA treated cells using matrigel-coated membranes. These values represent the mean ± SE. C. After transfection with indicated siRNAs for control (luciferase), NMHC II-A, and NMHC II-B, cells were treated with LPA for 10 min, harvested and then lysed. The supernatants were subjected to SDS 4–12 % PAGE. The membranes were probed with the indicated antibodies to NMHC II-A, II-B and actin. Actin was used as a loading control.
Discussion
Enhanced migration is an important feature of tumor cells and is also thought to contribute to invasion and metastasis. Migration and invasion in cancer cells results from highly organized sequential modules triggered by external stimuli. Upon stimulation, the leading edge of the cell membrane protrudes in the intended direction and subsequently stabilizes inducing cell body movement followed by tail detachment and retraction. In this study, we provide evidence that the LPA1 receptor but not the LPA2 or LPA3 receptor is required for LPA-induced migration in the two breast cancer cell lines, 4T1, and MDA- MB-231 cells. In 4T1 cells, the RLCs associated with both NMHC II-A and II-B are phosphorylated by LPA1 receptor-dependent ROCK activation.
Although there is considerable information concerning the functional role of NM IIs in mammary cell migration, the role of each of the NM II isoforms remains controversial. For example, the MCF-10A human normal mammary epithelial cell line, which expresses NM II-A and II-B, continues to migrate when treated with the NM II inhibitor, blebbistatin (Even-Ram et al. 2007). On the other hand, MA-MB-231 human breast cancer cells, which also express NM II-A and II-B, attenuated their migration when NMHC II-A or II-B is depleted using siRNA (Betapudi et al. 2006). Our findings which are similar to those of Betapudi et al. are that LPA-induced migration is impaired by either blebbistatin, or by depletion of NMHC II-A or II-B in 4T1 mouse breast cancer cells which express both isoforms.
Interestingly, a recent paper demonstrated that the ectopic expression of LPA1 receptors in MCF-10A cells, which are known as slow moving cells, caused these cells to acquire invasive characteristics (Li et al. 2009). Consistent with this, MDA-MB-231 cells, which are known as highly migratory cells, expressed more LPA1 receptor than any other breast cancer cell line (Bandoh et al. 1999; Ham et al. 2004; Shida et al. 2008; Supple. Fig. 1A). 4T1 cells, which we employ in this study, also express large numbers of the LPA1 receptor and have enhanced migration characteristics (Fig. 2, Supple. Fig. 1A). These observations suggest that LPA1 receptors appear to play a significant role in mammary cell migration.
LPA receptors are well known heterotrimeric-G protein coupled receptors (Lee et al. 2008; Stähle et al. 2003). The expression profiles and functional roles of the three LPA receptors isotypes have been characterized in a variety of cell types. Specifically, the LPA1 receptor was highly expressed in human breast cancer cells including MDA-MB-231, BT549, and Hs578T (Chen et al. 2007). In an in vivo model, the LPA1 receptor rather than either the LPA2 receptor or LPA3 receptor was required for breast cancer cells to metastasize to bone (Boucharaba et al. 2006). LPA1 receptors appeared to be dominantly expressed in 4T1 cells as shown in Supple. Fig. 1A. Both LPA1 receptor siRNA and LPA1,3 antagonists significantly inhibited LPA-induced migration (Figs. 1, 2, and 9A) in these cells. So, we suggest that LPA1 receptors are required for LPA-induced migration in 4T1 cells.
Our finding that 4T1 cell are relatively insensitive to PTX for LPA-induced migration even at high concentrations (1 μg/ml) is of interest (Figs. 1B, C), since, PTX is usually known as an inhibitor of LPA-induced migration in a wide variety of cancer cells such as U87, PC3, PANC-1, and MDA-MB-231 cells (Anliker and Chun 2004, Ishii et al. 2004). These results imply that the LPA1 receptor in 4T1 cells is mainly coupled to the PTX-insensitive Gα subunit and that these cells appear to have distinct signaling pathways bypassing the PTX-sensitive pathway. Previous studies have reported that G12/13 regulates RhoA activity and LPA stimulates RhoA through G12/13 to induce cell migration (Bian et al. 2006; Hart et al. 1998). Here, we show that the LPA1 receptor activated RhoA but not Rac1 or Cdc42 and stimulated the RhoA dependent ROCK pathway. These results suggest that LPA enhances migration through LPA1-PTX insensitive G12/13-RhoA-ROCK pathway in 4T1 cells.
In view of the fact that the silencing of either NMHC II-A or II-B attenuated LPA-induced migration (Figs. 7D, and E), we can set up a hypothesis in which the disruption of either isoform by silencing of NMHC II-A or II-B expression results in impaired migration. Both NMHC II-A and II-B appear to play unique cellular roles in LPA-induced migration because reduction of one isoform couldn’t be compensated for by transfection of the second isoform with respect to LPA-induced migration (Fig. 8). Furthermore, NM II-A appears to be the major isoform in 4T1 cells since it is expressed at a protein level 6–7 times more than NM II-B as determined by mass spectrometry, but we failed to detect any difference in LPA-induced migration by silencing NM II-A or NM II-B and we couldn’t observe any difference in phosphorylation between RLCs associated with NM II-A or NM II-B following LPA treatment.
Previous work has shown that phosphorylation of the RLC regulates cell migration and induces morphological changes. Sandquist et al. showed that the ROCK-induced phosphorylation of the RLC regulates cell migration in the lung carcinoma A 549 cell line. Generally, both ROCK and MLCK are candidates for kinases phosphorylating the RLC in cell migration. Their specific activity and localization have been delineated in a variety of cell types (Totsukawa et al. 2004). They suggested that ROCK predominantly activates NM II contractility in the central cell region whereas MLCK plays a role at the cell margins. Here, we determine that ROCK rather than MLCK is the main kinase for LPA-induced migration in 4T1 cells (Figs. 6A, B, and C). Based on our studies with MYPT-1, we suggest that ROCK is more likely to phosphorylate and directly activate myosin, than to phosphorylate and inactivate myosin phosphatase (Fig. 6D).
Although a number of investigators have utilized 4T1 breast cancer cells as a positive control for the study of metastasis in vivo, the signaling mechanism triggering the induction of migration or invasion was largely unknown. Here, we provide evidence about the mechanism of in vitro migration, and also describe how NM II can contribute to LPA-induced migration in 4T1 cells.
Supplementary Material
Acknowledgments
We thank the members of the Laboratory of Molecular Cardiology (NHLBI, National Institutes of Health ) for reagents, and helpful discussions, in particular, Mary Anne Conti, Sachiyo Kawamoto, Xuefei Ma, and Kee K. Kim. We thank Christian A. Combs and Daniela A. Malide (Light Microscopy Core Facility, NHLBI, National Institutes of Health) for professional skills and advice. We thank Stephanie Jackson for editorial assistance.
Contact grant sponsor: The intramural program of NHLBI, NIH.
Contact grant number: Funded by NHLBI Division of the Intramural Research
References
- An S, Bleu T, Hallmark OG, Goetzl EJ. Characterization of a novel subtype of human G protein-coupled receptor for lysophosphatidic acid. J Biol Chem. 1998;273:7906–7910. doi: 10.1074/jbc.273.14.7906. [DOI] [PubMed] [Google Scholar]
- Anliker B, Chun J. Lysophospholipid G protein-coupled receptors. J Biol Chem. 2004;279:20555–20558. doi: 10.1074/jbc.R400013200. [DOI] [PubMed] [Google Scholar]
- Aoki J. Mechanisms of lysophosphatidic acid production. Semin Cell Dev Biol. 2004;15:477–489. doi: 10.1016/j.semcdb.2004.05.001. [DOI] [PubMed] [Google Scholar]
- Bandoh K, Aoki J, Hosono H, Kobayashi S, Kobayashi T, Murakami-Murofushi K, Tsujimoto M, Arai H, Inoue K. Molecular cloning and characterization of a novel human G-protein-coupled receptor, EDG7, for lysophosphatidic acid. J Biol Chem. 1999;274:27776–27785. doi: 10.1074/jbc.274.39.27776. [DOI] [PubMed] [Google Scholar]
- Bandoh K, Aoki J, Taira A, Tsujimoto M, Arai H, Inoue K. Lysophosphatidic acid (LPA) receptors of the EDG family are differentially activated by LPA species. Structure-activity relationship of cloned LPA receptors. FEBS Lett. 2000;478:159–165. doi: 10.1016/s0014-5793(00)01827-5. [DOI] [PubMed] [Google Scholar]
- Bao J, Jana SS, Adelstein RS. Vertebrate nonmuscle myosin II isoforms rescue small interfering RNA-induced defects in COS-7 cell cytokinesis. J Biol Chem. 2005;280:19594–19599. doi: 10.1074/jbc.M501573200. [DOI] [PubMed] [Google Scholar]
- Betapudi V, Licate LS, Egelhoff TT. Distinct roles of nonmuscle myosin II isoforms in the regulation of MDA-MB-231 breast cancer cell spreading and migration. Cancer Res. 2006;66:4725–4733. doi: 10.1158/0008-5472.CAN-05-4236. [DOI] [PubMed] [Google Scholar]
- Bian D, Mahanivong C, Yu J, Frisch SM, Pan ZK, Ye RD, Huang S. The G12/13-RhoA signaling pathway contributes to efficient lysophosphatidic acid-stimulated cell migration. Oncogene. 2006;25:2234–2244. doi: 10.1038/sj.onc.1209261. [DOI] [PubMed] [Google Scholar]
- Boucharaba A, Serre CM, Gres S, Saulnier-Blache JS, Bordet JC, Guglielmi J, Clezardin P, Peyruchaud O. Platelet-derived lysophosphatidic acid supports the progression of osteolytic bone metastases in breast cancer. J Clin Invest. 2004;114:1714–1725. doi: 10.1172/JCI22123. [DOI] [PMC free article] [PubMed] [Google Scholar]
- Boucharaba A, Serre CM, Guglielmi J, Bordet JC, Clezardin P, Peyruchaud O. The type 1 lysophosphatidic acid receptor is a target for therapy in bone metastases. Proc Natl Acad Sci USA. 2006;103:9643–9648. doi: 10.1073/pnas.0600979103. [DOI] [PMC free article] [PubMed] [Google Scholar]
- Bresnick AR. Molecular mechanisms of nonmuscle myosin-II regulation. CurrOpin Cell Biol. 1999;11:26–33. doi: 10.1016/s0955-0674(99)80004-0. [DOI] [PubMed] [Google Scholar]
- Chen M, Towers LN, O’Connor KL. LPA2 (EDG4) mediates Rho-dependent chemotaxis with lower efficacy than LPA1 (EDG2) in breast carcinoma cells. Am J Physiol Cell Physiol. 2007;292:1927–1933. doi: 10.1152/ajpcell.00400.2006. [DOI] [PubMed] [Google Scholar]
- Chun J, Contos JJ, Munroe D. A growing family of receptor genes for lysophosphatidic acid (LPA) and other lysophospholipids (LPs) Cell Biochem Biophys. 1999;30:213–242. doi: 10.1007/BF02738068. [DOI] [PubMed] [Google Scholar]
- Conti MA, Adelstein RS. Nonmuscle myosin II moves in new directions. J Cell Sci. 2008;121:11–18. doi: 10.1242/jcs.007112. [DOI] [PubMed] [Google Scholar]
- Contos JJ, Ishii I, Fukushima N, Kingsbury MA, Ye X, Kawamura S, Brown JH, Chun J. Characterization of lpa(2) (Edg4) and lpa(1)/lpa(2) (Edg2/Edg4) lysophosphatidic acid receptor knockout mice: signaling deficits without obvious phenotypic abnormality attributable to lpa(2) Mol Cell Biol. 2002;22:6921–6929. doi: 10.1128/MCB.22.19.6921-6929.2002. [DOI] [PMC free article] [PubMed] [Google Scholar]
- Dulyaninova NG, House RP, Betapudi V, Bresnick AR. Myosin-IIA heavy-chain phosphorylation regulates the motility of MDA-MB-231 carcinoma cells. Mol Biol Cell. 2007;8:3144–3155. doi: 10.1091/mbc.E06-11-1056. [DOI] [PMC free article] [PubMed] [Google Scholar]
- Eshel R, Ben-Zaken O, Vainas O, Nadir Y, Minucci S, Polliack A, Naparstek E, Vlodavsky I, Katz BZ. Leukomogenic factors downregulate heparanase expression in acute myeloid leukemia cells. Biochem Biophys Res Commun. 2005;335:1115–1122. doi: 10.1016/j.bbrc.2005.08.004. [DOI] [PubMed] [Google Scholar]
- Even-Ram S, Doyle AD, Conti MA, Matsumoto K, Adelstein RS, Yamada KM. Myosin IIA regulates cell motility and actomyosin-microtubule crosstalk. Nat Cell Biol. 2007;3:299–309. doi: 10.1038/ncb1540. [DOI] [PubMed] [Google Scholar]
- Golomb E, Ma X, Jana SS, Preston YA, Kawamoto S, Shoham NG, Goldin E, Conti MA, Sellers JR, Adelstein RS. Identification and characterization of nonmuscle myosin II-C, a new member of the myosin II family. J Biol Chem. 2004;279:2800–2808. doi: 10.1074/jbc.M309981200. [DOI] [PubMed] [Google Scholar]
- Gunawardane RN, Sgroi DC, Wrobel CN, Koh E, Daley GQ, Brugge JS. Novel role for PDEF in epithelial cell migration and invasion. Cancer Res. 2005;65:11572–11580. doi: 10.1158/0008-5472.CAN-05-1196. [DOI] [PMC free article] [PubMed] [Google Scholar]
- Hama K, Aoki J, Fukaya M, Kishi Y, Sakai T, Suzuki R, Ohta H, Yamori T, Watanabe M, Chun J, Arai H. Lysophosphatidic acid and autotaxin stimulate cell motility of neoplastic and non-neoplastic cells through LPA1. J Biol Chem. 2004;279:17634–17639. doi: 10.1074/jbc.M313927200. [DOI] [PubMed] [Google Scholar]
- Hao F, Tan M, Xu X, Han J, Miller DD, Tigyi G, Cui MZ. Lysophosphatidic acid induces prostate cancer PC3 cell migration via activation of LPA(1), p42 and p38alpha. Biochim Biophys Acta. 2007;1771:883–892. doi: 10.1016/j.bbalip.2007.04.010. [DOI] [PMC free article] [PubMed] [Google Scholar]
- Hart MJ, Jiang X, Kozasa T, Roscoe W, Singer WD, Gilman AG, Sternweis PC, Bollag G. Direct stimulation of the guanine nucleotide exchange activity of p115 RhoGEF by Galpha13. Science. 1998;280:2112–2114. doi: 10.1126/science.280.5372.2112. [DOI] [PubMed] [Google Scholar]
- Im DS, Heise CE, Harding MA, George SR, O’Dowd BF, Theodorescu D, Lynch KR. Molecular cloning and characterization of a lysophosphatidic acid receptor, Edg-7, expressed in prostate. Mol Pharmacol. 2000;57:753–759. [PubMed] [Google Scholar]
- Ishii I, Contos JJ, Fukushima N, Chun J. Functional comparisons of the lysophosphatidic acid receptors, LP(A1)/VZG-1/EDG-2, LP(A2)/EDG-4, and LP(A3)/EDG-7 in neuronal cell lines using a retrovirus expression system. Mol Pharmacol. 2000;58:895–902. doi: 10.1124/mol.58.5.895. [DOI] [PubMed] [Google Scholar]
- Ishii I, Fukushima N, Ye X, Chun J. Lysophospholipid receptors: signaling and biology. Annu Rev Biochem. 2004;73:321–354. doi: 10.1146/annurev.biochem.73.011303.073731. [DOI] [PubMed] [Google Scholar]
- Jana SS, Kawamoto S, Adelstein RS. A specific isoform of nonmuscle myosin II-C is required for cytokinesis in a tumor cell line. J Biol Chem. 2006;281:24662–24670. doi: 10.1074/jbc.M604606200. [DOI] [PubMed] [Google Scholar]
- Katoh K, Kano Y, Amano M, Kaibuchi K, Fujiwara K. Stress fiber organization regulated by MLCK and Rho-kinase in cultured human fibroblasts. Am J Physiol Cell Physiol. 2001;280:1669–1679. doi: 10.1152/ajpcell.2001.280.6.C1669. [DOI] [PubMed] [Google Scholar]
- Kitayama J, Shida D, Sako A, Ishikawa M, Hama K, Aoki J, Arai H, Nagawa H. Over-expression of lysophosphatidic acid receptor-2 in human invasive ductal carcinoma. Breast Cancer Res. 2004;6:640–646. doi: 10.1186/bcr935. [DOI] [PMC free article] [PubMed] [Google Scholar]
- Kitzing TM, Sahadevan AS, Brandt DT, Knieling H, Hannemann S, Fackler OT, Grosshans J, Grosse R. Positive feedback between Dia1, LARG, and RhoA regulates cell morphology and invasion. Genes Dev. 2007;21:1478–1483. doi: 10.1101/gad.424807. [DOI] [PMC free article] [PubMed] [Google Scholar]
- Kolega J. Asymmetric distribution of myosin IIB in migrating endothelial cells is regulated by a rho-dependent kinase and contributes to tail retraction. Mol Biol Cell. 2003;14:4745–4757. doi: 10.1091/mbc.E03-04-0205. [DOI] [PMC free article] [PubMed] [Google Scholar]
- Leal A, Endele S, Stengel C, Huehne K, Loetterle J, Barrantes R, Winterpacht A, Rautenstrauss B. Gene (Amst) 2003;312:165–171. doi: 10.1016/s0378-1119(03)00613-9. [DOI] [PubMed] [Google Scholar]
- Lee SY, Lee HY, Kim SD, Jo SH, Shim JW, Lee HJ, Yun J, Bae YS. Lysophosphatidylserine stimulates chemotactic migration in U87 human glioma cells. Biochem Biophys Res Commun. 2008;374:147–151. doi: 10.1016/j.bbrc.2008.06.117. [DOI] [PubMed] [Google Scholar]
- Li TT, Alemayehu M, Aziziyeh AI, Pape C, Pampillo M, Postovit LM, Mills GB, Babwah AV, Bhattacharya M. Beta-arrestin/Ral signaling regulates lysophosphatidic acid-mediated migration and invasion of human breast tumor cells. Mol Cancer Res. 2009;7:1064–1077. doi: 10.1158/1541-7786.MCR-08-0578. [DOI] [PubMed] [Google Scholar]
- Liu S, Umezu-Goto M, Murph M, Lu Y, Liu W, Zhang F, Yu S, Stephens LC, Cui X, Murrow G, Coombes K, Muller W, Hung MC, Perou CM, Lee AV, Fang X, Mills GB. Expression of autotaxin and lysophosphatidic acid receptors increases mammary tumorigenesis, invasion, and metastases. Cancer Cell. 2009;15:539–550. doi: 10.1016/j.ccr.2009.03.027. [DOI] [PMC free article] [PubMed] [Google Scholar]
- Maekawa M, Ishizaki T, Boku S, Watanabe N, Fujita A, Iwamatsu A, Obinata T, Ohashi K, Mizuno K, Narumiya S. Signaling from Rho to the actin cytoskeleton through protein kinases ROCK and LIM-kinase. Science. 1999;285:895–898. doi: 10.1126/science.285.5429.895. [DOI] [PubMed] [Google Scholar]
- Manning TJ, Jr, Parker JC, Sontheimer H. Role of lysophosphatidic acid and rho in glioma cell motility. Cell Motil Cytoskeleton. 2000;45:185–199. doi: 10.1002/(SICI)1097-0169(200003)45:3<185::AID-CM2>3.0.CO;2-G. [DOI] [PubMed] [Google Scholar]
- Matsumura F, Hartshorne DJ. Myosin phosphatase target subunit: Many roles in cell function. Biochem Biophys Res Commun. 2008;369:149–156. doi: 10.1016/j.bbrc.2007.12.090. [DOI] [PMC free article] [PubMed] [Google Scholar]
- Matsumura F, Ono S, Yamakita Y, Totsukawa G, Yamashiro S. Specific localization of serine 19 phosphorylated myosin II during cell locomotion and mitosis of cultured cells. J Cell Biol. 1998;140:119–129. doi: 10.1083/jcb.140.1.119. [DOI] [PMC free article] [PubMed] [Google Scholar]
- Moolenaar WH. Lysophosphatidic acid signalling. Curr Opin Cell Biol. 1995;7:203–210. doi: 10.1016/0955-0674(95)80029-8. [DOI] [PubMed] [Google Scholar]
- Moolenaar WH, Kranenburg O, Postma FR, Zondag GC. Lysophosphatidic acid: G-protein signalling and cellular responses. Curr Opin Cell Biol. 1997;9:168–173. doi: 10.1016/s0955-0674(97)80059-2. [DOI] [PubMed] [Google Scholar]
- Nguyen DH, Catling AD, Webb DJ, Sankovic M, Walker LA, Somlyo AV, Weber MJ, Gonias SL. Myosin light chain kinase functions downstream of Ras/ERK to promote migration of urokinase-type plasminogen activator-stimulated cells in an integrin-selective manner. J Cell Biol. 1999;146:149–164. doi: 10.1083/jcb.146.1.149. [DOI] [PMC free article] [PubMed] [Google Scholar]
- Pages C, Simon MF, Valet P, Saulnier-Blache JS. Lysophosphatidic acid synthesis and release. Prostaglandins Other Lipid Mediat. 2001;64:1–10. doi: 10.1016/s0090-6980(01)00110-1. [DOI] [PubMed] [Google Scholar]
- Sandquist JC, Swenson KI, Demali KA, Burridge K, Mean AR. Rho kinase differentially regulates phosphorylation of nonmuscle myosin II isoforms A and B during cell rounding and migration. J Biol Chem. 2006;281:35873–35883. doi: 10.1074/jbc.M605343200. [DOI] [PubMed] [Google Scholar]
- Sellers JR. Myosins. 2. Oxford University Press; Oxford: 1999. [Google Scholar]
- Shida D, Fang X, Kordula T, Lepine S, Alvarez SE, Milstien S, Spiegel S. Crosstalk between LPA1 and epidermal growth factor receptors mediates up-regulation of sphingosine kinase 1 to promote gastric cancer cell motility and invasion. Cancer Res. 2008;68:6569–6577. doi: 10.1158/0008-5472.CAN-08-0411. [DOI] [PMC free article] [PubMed] [Google Scholar]
- Shohet RV, Conti MA, Kawamoto S, Preston YA, Brill DA, Adelstein RS. Cloning of the cDNA encoding the myosin heavy chain of a vertebrate cellular myosin. Proc Natl Acad Sci USA. 1989;86:7726–7730. doi: 10.1073/pnas.86.20.7726. [DOI] [PMC free article] [PubMed] [Google Scholar]
- Simons M, Wang M, McBride OW, Kawamoto S, Yamakawa K, Gdula D, Adelstein RS, Weir L. Human nonmuscle myosin heavy chains are encoded by two genes located on different chromosomes. Circ Res. 1991;69:530–539. doi: 10.1161/01.res.69.2.530. [DOI] [PubMed] [Google Scholar]
- Singer O, Verma IM. Application of lentiviral vectors for shRNA delivery and transgenesis. Curr Gene Ther. 2008;8:483–488. doi: 10.2174/156652308786848067. [DOI] [PMC free article] [PubMed] [Google Scholar]
- Stähle M, Veit C, Bachfischer U, Schierling K, Skripczynski B, Hall A, Gierschik P, Giehl K. Mechanisms in LPA-induced tumor cell migration: critical role of phosphorylated ERK. J Cell Sci. 2003;116:3835–3846. doi: 10.1242/jcs.00679. [DOI] [PubMed] [Google Scholar]
- Stewart SA, Dykxhoorn DM, Palliser D, Mizuno H, Yu EY, An DS. Lentivirus-delivered stable gene silencing by RNAi in primary cells. RNA. 2003;9:493–501. doi: 10.1261/rna.2192803. [DOI] [PMC free article] [PubMed] [Google Scholar]
- Tager AM, LaCamera P, Shea BS, Campanella GS, Selman M, Zhao Z, Polosukhin V, Wain J, Karimi-Shah BA, Kim ND, Hart WK, Pardo A, Blackwell TS, Xu Y, Chun J, Luster AD. The lysophosphatidic acid receptor LPA1 links pulmonary fibrosis to lung injury by mediating fibroblast recruitment and vascular leak. Nature Medicine. 2008;14:45–54. doi: 10.1038/nm1685. [DOI] [PubMed] [Google Scholar]
- Takahashi M, Kawamoto S, Adelstein RS. Evidence for inserted sequences in the head region of nonmuscle myosin specific to the nervous system; Cloning of the cDNA encoding the myosin heavy chain-B isoform of vertebrate nonmuscle myosin. J Biol Chem. 1992;267:17864–17871. [PubMed] [Google Scholar]
- Totsukawa G, Wu Y, Sasaki Y, Hartshorne DJ, Yamakita Y, Yamashiro S, Matsumura F. Distinct roles of MLCK and ROCK in the regulation of membrane protrusions and focal adhesion dynamics during cell migration of fibroblasts. J Cell Biol. 2004;164:427–439. doi: 10.1083/jcb.200306172. [DOI] [PMC free article] [PubMed] [Google Scholar]
- Tsuji T, Ishizaki T, Okamoto M, Higashida C, Kimura K, Furuyashiki T, Arakawa Y, Birge RB, Nakamoto T, Hirai H. ROCK and mDia1 antagonize in Rho-dependent Rac activation in Swiss 3T3 fibroblasts. J Cell Biol. 2002;157:819–830. doi: 10.1083/jcb.200112107. [DOI] [PMC free article] [PubMed] [Google Scholar]
- Ueda H, Morishita R, Yamauchi J, Itoh H, Kato K, Asano T. Regulation of Rac and Cdc42 pathways by G(i) during lysophosphatidic acid-induced cell spreading. J Biol Chem. 2001;276:6846–6852. doi: 10.1074/jbc.M007541200. [DOI] [PubMed] [Google Scholar]
Associated Data
This section collects any data citations, data availability statements, or supplementary materials included in this article.


