Abstract
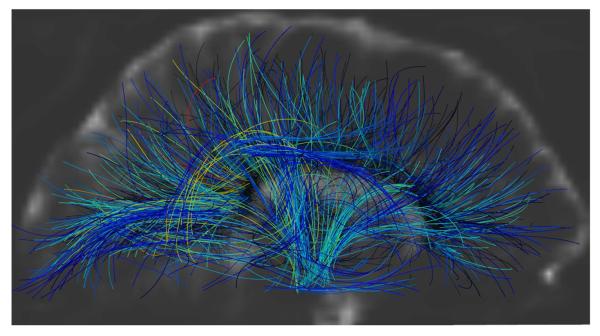
A global probabilistic fiber tracking approach based on the voting process provided by the Hough transform is introduced in this work. The proposed framework tests candidate 3D curves in the volume, assigning to each one a score computed from the diffusion images, and then selects the curves with the highest scores as the potential anatomical connections. The algorithm avoids local minima by performing an exhaustive search at the desired resolution. The technique is easily extended to multiple subjects, considering a single representative volume where the registered high-angular resolution diffusion images (HARDI) from all the subjects are non-linearly combined, thereby obtaining population-representative tracts. The tractography algorithm is run only once for the multiple subjects, and no tract alignment is necessary. We present experimental results on HARDI volumes, ranging from simulated and 1.5T physical phantoms to 7T and 4T human brain and 7T monkey brain datasets.
Keywords: Tractography, diffusion-weighted magnetic resonance imaging (DWI), Hough transform, orientation distribution function (ODF), population studies
1. Introduction
Understanding the connectivity between different areas of the brain is essential in studying brain function and development. Diffusion-weighted magnetic resonance imaging (DWI) provides, through tractography, a unique in-vivo quantitative measurement of the brain's anatomical connectivity. In addition to its benefits in neurosurgical planning, DWI tractography has considerable clinical importance by noninvasively quantifying changes in the white matter connectivity at different stages of diseases or development. Moreover, it can be used to segment fiber bundles of the central nervous system, or in tract-based statistical analysis of scalars such as the fractional anisotropy (FA). Performing tractography in multiple subjects is invaluable for population studies and creating fiber bundle atlases.
DWI provides local information about the fiber orientation by measuring the diffusion of the tissue water, in vivo, assuming a high correlation between the fiber and diffusion orientations. However, there is no unique solution as to how to integrate these voxel-scale local orientations to infer global connectivity. Early fiber tractography algorithms, known as streamline methods, are based on following the principal diffusion orientation (Basser et al., 2000; Conturo et al., 1999; Jones et al., 1999; Lazar et al., 2003; Mori et al., 1999). Despite their simplicity, these methods are prone to cumulative errors caused by noise, partial volume effects, and discrete integration, and have difficulty in distinguishing fiber crossing and kissing mostly due to the fact that the entire diffusion information is not globally used and integrated. This led to the development of other successful approaches, including probabilistic techniques (Behrens et al., 2007; Björnemo et al., 2002; Descoteaux et al., 2009; Friman et al., 2006; Jones, 2008; Lazar & Alexander, 2005; Parker et al., 2003), global techniques based on front propagation (Campbell et al., 2005; Jackowski et al., 2005; Parker et al., 2002; Pichon et al., 2005; Prados et al., 2006; Tournier et al., 2003), simulation of the diffusion process or fluid flow (Batchelor et al., 2001; Hageman et al., 2009; Hagmann et al., 2003; Kang et al., 2005; O'Donnell et al., 2002; Yörük et al., 2005), DWI geodesic computations (Jbabdi et al., 2008; Lenglet et al., 2009a; Melonakos et al., 2007; Pechaud et al., 2009), graph theoretical techniques (Iturria-Medina et al., 2007; Sotiropoulos et al., 2010; Zalesky, 2008), spin glass models (Fillard et al., 2009; Mangin et al., 2002), and Gibbs tracking (Kreher et al., 2008). Generally speaking, for virtually every tractography method, a particular putative subset of all possible curves is implicitly considered from which the resulting tracts are chosen according to some criteria, which are different depending on the particular selection strategy. The closer the subset is to the universal set of curves, the more accurate we expect the results to be. For a recent thorough discussion on different tractography techniques, see (Behrens & Jbabdi, 2009).
Prior approaches for multi-subject tractography are typically based on the post processing of tractography results from individual subjects (El Kouby et al., 2005; Jbabdi et al., 2009; Leemans et al., 2006; Maddah et al., 2006; O'Donnell & Westin, 2007; Voineskos et al., 2009; Wakana et al., 2004). These methods generally require aligning the tracts and mapping them into a common fiber coordinate system, which is challenging due to the large number of high-dimensional fiber trajectories per subject and the lack of clearly defined criteria for aligning curves and particularly tracts.
In this work, we present a global probabilistic approach inspired by the voting procedure provided by the popular Hough transform (Duda & Hart, 1972; Gonzalez & Woods, 2008). Our proposed tractography algorithm essentially tests candidate 3D curves in the volume, assigning a score to each of them, and then returning the curves with the highest scores as the potential anatomical connections. The score is accordingly derived from the DWI data. Being an exhaustive search, this proposed algorithm avoids entrapment in local minima within the discretization resolution of the parameter space.1 Furthermore, the specific definition of the candidate tract score has the desired effect of attenuating the noise through the integration of the real-valued local votes derived from the diffusion data. We also introduce a simultaneous multi-subject tractography technique which takes as input a single representative volume – where the HARDI data from all the (registered) subjects are non-linearly integrated – and generates population-representative tracts. The multi-subject tractography algorithm is run only once, and no tract alignment is necessary. We present experimental results on HARDI volumes such as a simulated phantom, a biological phantom dataset acquired at 1.5T, a monkey brain dataset acquired at 7T, and a number of human brain datasets acquired at 4T and 7T.2
In Sec. 2 we present the proposed algorithm in detail. Experimental results are presented in Sec. 3, and Sec. 4 concludes with a review of the contributions. Additional implementation details are provided in the Appendix.
2. Methods
We first randomly generate a sufficiently high number of initial seed points inside a brain mask or a region of interest. From each initial point, we consider as many passing curves as desired, based on the expected resolution and available computational resources (Fig. 1, left). A score is computed for each curve, and the one(s) with the maximum score is (are) then chosen as the best curve(s) representing the fiber bundle passing through that seed point (Fig. 1, middle & right).3 This process is detailed in the following subsections.
Fig 1.
(Left) Different possible curves passing through a seed point are tested and their scores are computed. (Middle) The curve with the highest score is selected. (Right) The process is repeated for all the remaining seed points.
2.1. Curve parameterization
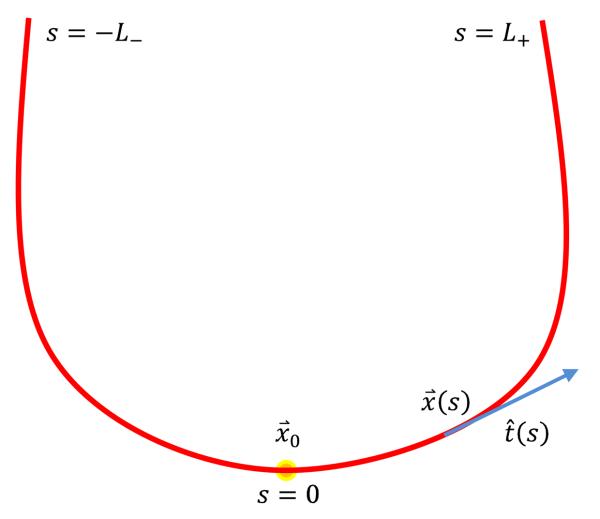
We parameterize the 3D curves by the arc length s, with s = 0 corresponding to the seed point (Fig. 2). The unit tangent vector of the curve is identified at each point by standard polar coordinates and θ(s) and ϕ(s):
| (1) |
Fig 2.
Curves starting from the seed point x⃗0 are parameterized by the arc length, s ∈ [−L−,L+]. The unit tangent vector, t̂(s), is approximated with polynomials.
In our proposed model, we consider simple polynomial approximations of these two angles with respect to the arc length:
| (2) |
| (3) |
where N is the polynomial order (different orders for θ and ϕ can be considered if desired). In addition, two extra parameters L− and L+ determine the partial (Euclidean) lengths of the curve on each side of the seed point (Fig. 2), with 0 ≤ L−,+ ≤ Lmax where the constant Lmax is chosen as the maximum expected curve (fiber) length, essentially about the largest dimension of the volume. The Hough-inspired process will be used to select the best possible coefficients ak, bk, L−, and L+, based on the available diffusion data. Each curve initiated from the seed point x⃗ is then represented using d = 2N + 4 unique parameters, {a0, …, aN, b0, …, bN, L−, L+}, and explicitly computed by integrating the tangent vector:
| (4) |
2.2. Fiber score computation
A score, intended to estimate the log-probability of the existence of a fiber, is assigned to each possible 3D curve passing through a seed point x⃗. In this work, the score is defined as
| (5) |
The expression P(x⃗, t̂)dΩ represents the probability for the point x⃗ to be located inside a fiber bundle passing in the direction t̂ through the infinitesimal solid angle dΩ.4 The constant λ, which is used to compensate for the absence of log dΩ in the integral, can also be interpreted as a prior on the length of the fiber bundles, as choosing a larger λ favors the score of longer curves.5 By enforcing the curves to remain in the brain mask, and choosing a value of λ which is large enough, the curves which are oriented towards the cortex are expected to actually reach the gray matter region (e.g., see Fig. 8).
Fig 8.
A sagittal slice of the human brain baseline image in the middle of the computed tracts. Cerebrospinal fluid is identified as white regions.
P(x⃗, t̂) can be computed using the conditional probability formula as,
| (6) |
The prior probability of the existence of a fiber at the point x⃗, P(x⃗), is considered to be equal to either the fractional anisotropy (FA) or generalized fractional anisotropy (GFA) inside the brain tissue, and zero outside the brain mask and inside the cerebrospinal fluid. This comes from the assumption that the more anisotropic a region is, the more likely a fiber bundle may be passing through that region. In addition, as long as no further constraints or selections are provided by the user, the initial seed points are chosen randomly with a spatial probability distribution proportional to P(x⃗).6 Other choices for P(x⃗), such as the white matter complexity introduced in (Haro et al., 2008), are also possible.
Next, assuming that a fiber is actually passing through the point x⃗, the probability for it to be in the direction t̂, i.e. P(t̂|x⃗), is derived from the orientation distribution function (ODF) at each voxel in the volume. Computed from various DWI modalities, the diffusion ODF is defined as,
| (7) |
which is the integration of the PDF(r⃗) (the spatial probability density function of the diffusion of water after a certain amount of time), in a cone of constant solid angle (CSA) in the direction of the unit vector û. In Diffusion Spectrum Imaging (DSI) (Wedeen et al., 2005), PDF(r⃗) is available on a discrete Cartesian grid, and therefore the ODF is directly computed from the above formula. In the case of the Diffusion Tensor Imaging (DTI) (Basser et al., 1994), the ODF is computed by integrating the 3D normal distribution,
| (8) |
where D is proportional to the estimated diffusion tensor.
In this work, however, we use Q-ball Imaging (QBI) (Tuch, 2004), which is a popular HARDI reconstruction method proven successful in resolving multiple intravoxel fiber orientations. The original ODF expression in QBI does not include the Jacobian factor r2, creating the need for post-processing such as artificial sharpening. Here we use the normalized and dimensionless ODF estimator in QBI, derived in (Aganj et al., 2010), which by considering the factor r2 computes the CSA-ODF,
| (9) |
with S(û) and S0 the diffusion signal and the baseline image respectively, and FRT and the Funk-Radon transform (Funk, 1916) and the Laplace-Beltrami operator respectively. This ODF reconstruction scheme has been shown to outperform the original QBI by improving the resolution of multiple fiber orientations (Aganj et al., 2010), and producing more stable and consistent GFA (Fritzsche et al., 2010). To allow sampling in any desired direction t̂, the ODFs were approximated in the real and symmetric modified spherical harmonic basis, following the method proposed by Descoteaux et al. (2007) for the original QBI, and subsequently adapted in (Aganj et al., 2010) for the CSA-QBI.
Putting all this together, and using for instance the FA as P(x⃗), the score in Eq. (5) thus becomes,
| (10) |
where ODFx⃗(s) (t̂(s)) stands for the ODF at the 3D position x⃗(s) evaluated in the direction t̂(s), with x⃗(s) and t̂(s) represented via the polynomials as specified in equations (1-4). The score integral in equations (5) and (10) has the additional nice effect of attenuating the additive and independent noise in the data through summation.
2.3. Hough transform
As discussed in Sec. 2.1, every curve starting from a particular seed point is presented as a point in a d-dimensional space, with d = 2N + 4 being the number of necessary parameters. In theory, we would like to find all possible curves which pass through the seed point while computing their scores, to eventually choose the one(s) with the highest score(s) as the potential fiber tract(s) passing through the seed point.7 However, we can only perform such an exhaustive search within a finite resolution, by discretizing ℝd and assigning discrete values to the curve parameters within some predefined limits.8 The resulting d-dimensional array of curve scores is often called the Hough transform (Duda & Hart, 1972; Gonzalez & Woods, 2008) of the data with respect to the curves passing through the chosen seed point. This can be seen as a voting process where the voxels cast real-valued votes for the curves. The overall vote is the integrand of the score integral (Eq. (5) or (10)) if a curve passes through a voxel, and zero otherwise.
The proposed method avoids entrapment in local minima by performing an exhaustive search in the (discretized) high-dimensional space of the curves. Nevertheless, the discretization resolution of the parameter space causes the algorithm to obtain an approximation of the true global optimum (which is improved by increasing the resolution as desired). To alleviate this issue, we choose the best curve in a multi-resolution approach: once the point (in the parameter space ℝd) corresponding to the curve with the highest score is found in one resolution level, the neighborhood (in the parameter space) of that point is discretized again with a higher resolution and the search is continued at the next level.9 We have performed our experiments using three levels of resolution.
This concludes the description of the proposed technique for a single dataset. We now show how this can be efficiently extended to multiple datasets or subjects.
2.4. Extension to multiple subjects
Here we extend our Hough transform-based global approach to obtain average representative tracts from multiple subjects or datasets. We perform this by first registering the HARDI volumes, using either linear transformation or more sophisticated algorithms such as (Chiang et al., 2008), and then running the algorithm described above on a single equivalent volume composed of the voxel-wise mean ODF and mean FA across all the subjects.10 We may use either the arithmetic or the geometric mean, however, the linearity of the curve score (Eq. (10)) with respect to the logarithms of the ODF and FA makes the use of the geometric mean more appealing (since the arithmetic mean of the logarithms of the ODF and FA values equals the logarithm of their geometric mean). Hence, we reconstruct the effective ODF and FA for each voxel by computing the geometric mean of their values across the subjects,
| (11) |
| (12) |
where the superscripts i and eq indicate respectively the ith subject (out of a total of M) and the equivalent subject. We eventually use the equivalent ODF and FA volumes in the single-subject tractography algorithm, thereby running it only once for all the subjects and avoiding complications due to curve (tracts) registration.
3. Experimental results and discussion
3.1. Results for single subjects
We tested our method on various HARDI datasets, also using each of them to explain a different aspect of the proposed algorithm. The FA and the CSA-ODFs of each dataset were computed as explained in Sec. 2.2. The initial seed points were chosen randomly with a spatial probability distribution proportional to the FA, except for the simulated and the monkey brain datasets where the distribution was uniform.
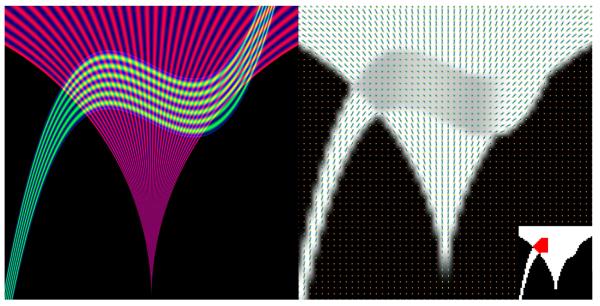
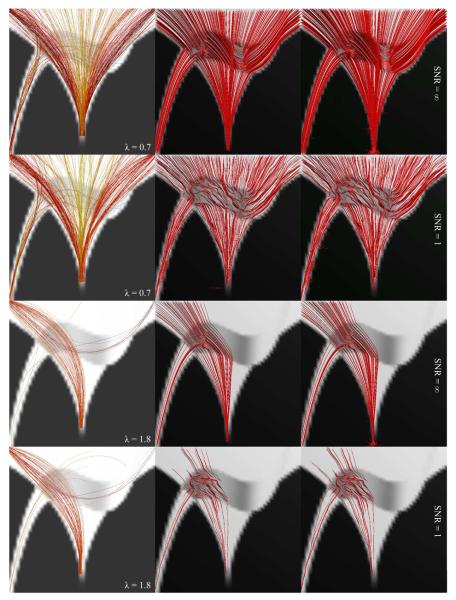
To validate our approach, we first show results on artificial data and compare our approach to one deterministic and another probabilistic streamline method, both implemented in the Camino Diffusion MRI toolkit (Cook et al., 2006) and exploiting q-ball ODFs.11 Using simulated diffusion data, we created a phantom containing two crossing fiber bundles. As Fig. 3 demonstrates, this phantom has various challenging fiber configurations, including fanning, crossing, and merging.12 The phantom was made as a 50 × 50 × 1 slice; however, to simulate the partial volume effects, we initially created it ten times larger, then downsampled it after applying a low-pass filter. Figure 4 shows tractography results using the proposed algorithm (with uniform P(x)) (left), the deterministic streamline method (middle), and the Probabilistic Index of Connectivity (PICo) technique (Seunarine et al., 2007) (right). We performed tractography from randomly generated seed points with uniform spatial distribution, once for 500 points in the phantom mask (λ = 0.7; Fig. 4, two top rows), and a second time for 80 points in a smaller region identified in Fig. 3 (bottom, right) as red (λ = 1.8; Fig. 4, two bottom rows). We tested both the noise-free case (rows 1 & 3), and with the signal-to-noise ratio of 0 dB (rows 2 & 4). The streamline methods follow the principal diffusion direction (PDD), which may be misleading in the crossing regions, as the two directions might be mingled in the ODFs (or tensors), resulting in a false PDD different from the original ones. The global nature of our algorithm, however, alleviates this problem. For instance, as can be observed in the two top rows of Fig. 4, our method clearly reveals the crossing in the intersection region, resulting in curves going in the directions of the two perpendicular bundles, as opposed to the streamline methods, where curves seem to be going in an “average” direction not corresponding to any of the two bundles. In the case of the smaller seed-point region (two bottom rows), this results in the complete miss of one of the branches by the two streamline methods, in addition to more susceptibility to noise. Our algorithm identifies that branch, although giving only an approximated shape of it. This could still be the result of the altered PDD, in addition to the limitations of the third order polynomials.
Fig 3.
Ground truth (left) and the ODFs overlaid on the GFA map (right) of the simulated phantom. The local region for the seed points and the phantom mask are indicated in respectively red and white (bottom, right).
Fig 4.
Comparison of the proposed method (left) with streamline deterministic (middle) and probabilistic (right) techniques from 500 seed points chosen in the phantom mask (two top rows) and 80 in the region identified in Fig. 3 (bottom, right) as red (two bottom rows), in noiseless (rows 1 & 3) and noisy (rows 2 & 4) cases.
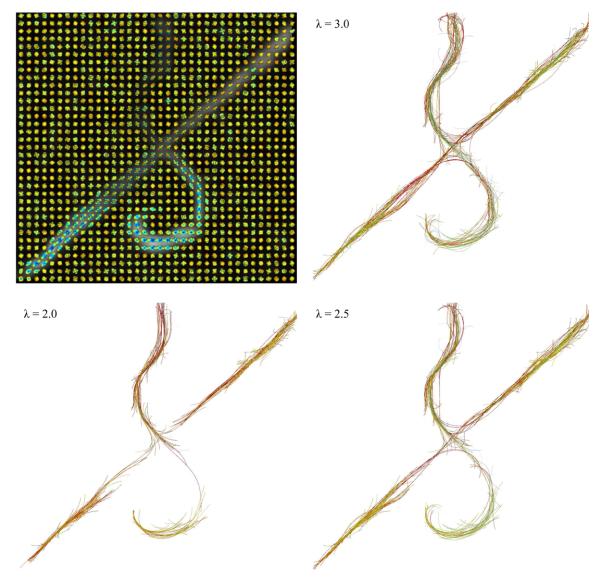
Next, we used the biological phantom in (Campbell et al., 2005), constructed from excised rat spinal cords and designed to have crossing tracts (90 diffusion images at b = 1300 s/mm2, 1.5T).13 We computed the tracts from 200 seed points, using three different bias values of λ = 2.0, 2.5, and 3.0 (see Sec. 2.2), and polynomials of order N = 3, resulting in a total number of d = 10 parameters to represent the candidate 3D curves initiated from each seed point. Figure 5 (top, left) shows the ODFs superimposed on the FA map, and the rest of the subfigures show the tractography results using different values for λ. Increasing λ results in longer curves being selected. The color and the opacity of each tract (in all the figures) increase with the score, from transparent blue to opaque red. Given the simple structure of this phantom dataset, experiments on more complex real datasets were required to test our algorithm; these are described next.
Fig 5.
Reconstructed ODFs (top, left) and the tractography results (rest of the subfigures) on the excised rat spinal cords, using various values for the bias parameter λ.
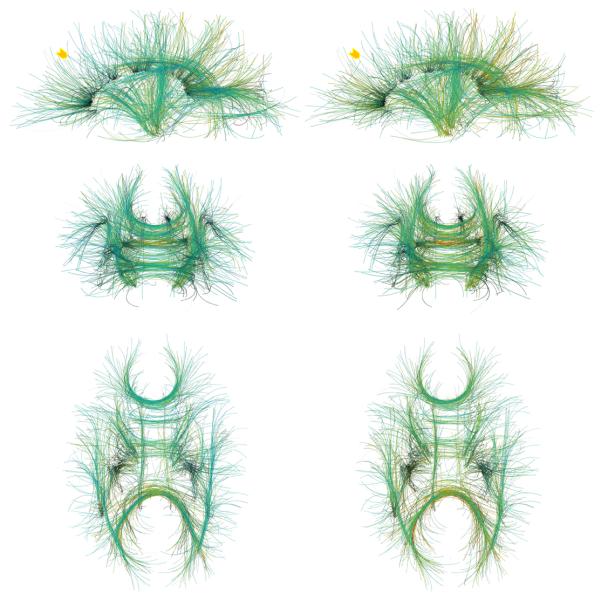
We performed additional experiments on a human brain HARDI dataset acquired at 7T. A single refocused 2D single shot spin echo EPI sequence was used. Image parameters were: FOV: 192×192 mm2 (matrix: 196×96) to yield a spatial resolution of 2×2×2 mm3, TR/TE 4800/57 msec., acceleration factor (GRAPPA) of 2 and 6/8 partial Fourier were used along the phase encode direction. Diffusion-weighted images were acquired at b = 3000 s/mm2 with 256 directions, along with 31 baseline images. EPI echo spacing was 0.57 msec. with a bandwidth of 2895 Hz/Pixel. Tracts were computed from 1500 seed points in two experiments, using polynomials of orders N = 2 and N = 3 (Fig. 6). High scoring curves are concentrated in major fiber bundles such as corona radiata, corpus callosum, cingulum, superior longitudinal fasciculus, and arcuate fasciculus. Higher polynomial order brings more flexibility to the curves, resulting in them being spread out more continuously in the white matter regions (e.g. in corona radiata). A 3D stereoscopic rendering of the results is shown in Fig. 7. Figure 8 shows a sagittal slice of the baseline image among the computed tracts. A significant portion of the curves can be seen to reach the gray matter, even though the FA (used as the prior) is lower around this region.
Fig 6.
Tractography results on a human brain HARDI dataset from 1500 seed points using polynomial orders of (left) N = 3 and (right) N = 2, shown in (top) sagittal, (middle) coronal, and (bottom) axial views. The arrows indicate areas where the computed curves are more uniformly spread out when using the higher polynomial order.
Fig 7.
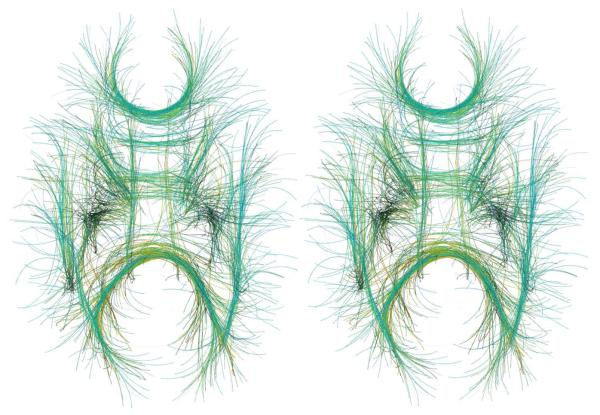
Stereoscopic rendering of Fig. 6 (bottom, left). To see this image in 3D, please cross your eyes and move the image closer or further away from you until you see what appears to be a third, 3D image in the middle. This figure would be a bonus for those who can perceive 3D with standard eye-crossing techniques.
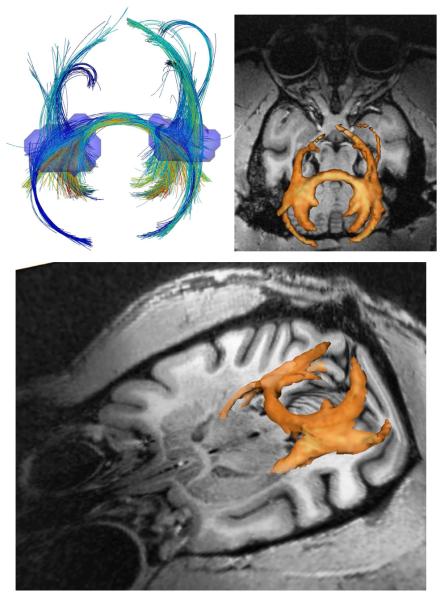
Next, we used the monkey brain HARDI dataset introduced in (Lenglet et al., 2009b) to test the performance of our method on specific fiber bundles. An anesthetized Macaca mulatta monkey was scanned using a 7T MR scanner (Siemens) equipped with a head gradient coil (80mT/m G-maximum, 200mT/m/ms) with a diffusion weighted spin-echo EPI sequence. Diffusion images were acquired at b = 3000 s/mm2 (twice during the same session, and then averaged) over 100 directions uniformly distributed on the sphere. We used TR/TE of 4600/65 ms, and a voxel size of 1×1×1 mm3. We computed the tracts from 1350 seed points uniformly distributed in a mask containing the intersection of the forceps minor and the inferior longitudinal fasciculus, using the polynomials of order N = 3. Results are depicted in Fig. 9. A fiber density map was created by counting, at each voxel, the number of intersecting curves while taking into account their respective score. A three-dimensional isosurface was then generated by thresholding this map to keep the most relevant connections. It is as well presented in Fig. 9, overlaid on a structural MRI. Major tracts including the splenium fibers, posterior corona radiata, tapetum, as well as the inferior fronto-occipital and longitudinal fasciculi – including the optic radiations – are clearly identified. Moreover, fibers of the optic tract are recovered until they reach the optic chiasm.
Fig 9.
Tractography results on a monkey brain HARDI dataset shown in axial (top) and tilted (bottom) views. 1350 seed points were randomly generated inside the transparent blue regions (top, left). Isosurface of the fiber density map is shown in orange overlaid on T1 image (top right & bottom).
3.2. Results for multiple subjects
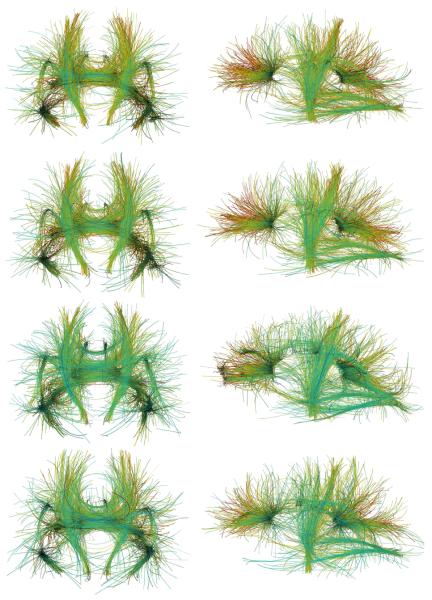
We used our multi-subject tractography algorithm to compute mean tracts from five HARDI datasets, introduced in (de Zubicaray et al., 2008), each acquired from a different healthy young adult. Images were acquired using a 4T Bruker Medspec MRI scanner. Diffusion-weighted images were acquired using single-shot echo planar imaging with a twice-refocused spin echo sequence to reduce eddy-current induced distortions. Imaging parameters were: 23 cm FOV, TR/TE 6090/91.7 ms, with a 128×100 acquisition matrix. Each 3D volume consisted of 55 2-mm thick axial slices with a 1.8×1.8 mm2 in-plane resolution. 105 images were acquired: 11 with no diffusion sensitization (i.e., T2-weighted b0 images) and 94 diffusion-weighted images (b = 1159 s/mm2) with gradient directions evenly distributed on the sphere. Scan time was approximately 14 minutes. Images were corrected for motion and eddy current distortions. Each subject's average b0 image was aligned to a group-specific minimal deformation template (MDT) using a nine-parameter affine transformation. This transformation was then applied to each individual DWI and gradient directions were corrected accordingly for ODF calculations.
We combined the individual datasets into two equivalent volumes, using the geometric and the arithmetic means (see Sec. 2.4). We tested the tractography algorithm on both equivalent volumes, and also for comparison, on two of the five individual datasets. In each experiment, polynomials of order N = 3 were used to represent 3D tracts initiated from 1500 seed points. Figure 10 (two top rows) show the mean tracts from the five subjects using respectively the geometric and arithmetic means. The two bottom subfigures show tracts from individual subjects. As Fig. 10 demonstrates, combining the volumes improves the results by producing fibers that are less scattered and better concentrated in major fiber bundles. Note particularly how corticospinal tracts are enhanced.
Fig 10.
Tractography results from five human brain HARDI datasets combined using geometric (top row) and arithmetic (row two) means, and from individual subjects (two bottom rows), shown in coronal (left) and sagittal (right) views.
3.3. Discussion
Although every possible curve can be represented with an infinite polynomial using the Taylor expansion, keeping only N coefficients gives us an approximated curve which, as N grows, converges to the true curve. Through our experiments, we observed that at least a polynomial order of N = 2 is necessary to correctly extract the fiber bundles from the data, since (basically resulting in straight lines) and N = 1 turn out to be models which are too simple. Since we did not observe noticeable improvement in our human brain tractography results by increasing N from 2 to 3 (see, e.g., Fig. 6) and beyond that, we deduced that the second or third order polynomials are most likely sufficient for this type of data.14 Depending on the available resources, the slight improvements by increasing the polynomial order from N = 2 to N = 3 may or may not be worth the two added dimensions in the search space (see the Appendix for more details about the complexity of the algorithm). The proposed framework is not limited to these low orders, and increasing the order will only result in additional computational cost.
Throughout our experiments, we determined the best values of λ (see Sec. 2.2) assessing the results obtained using different values for it. As seen in Fig. 5, a value of λ which is too large or too small might result in false positives and false negatives, respectively. We observed that the manually-determined optimal λ remains consistent for different datasets with the same acquisition parameters. This means that the method can be easily used in population studies, without the need to tune λ separately for each subject.
4. Conclusions
We have introduced a global approach for single- and multi-subject probabilistic tractography, based on the voting process provided by the Hough transform. We presented experimental results on a physical phantom and brain HARDI datasets, and showed that using this approach, data from multiple subjects can be non-linearly combined and exploited to obtain population statistics and more accurate tractography results. The incorporation of spatial coherence and continuity in curve score computation, and a systematic approach to optimization of the parameter λ are the subject of future research.
Acknowledgments
This work was partly supported by NIH (P41 RR008079, P30 NS057091, R01 HD050735, R01 EB007813, R01 MH060662, R01 EB008432, R01 EB008645, CON000000004051–3014, CON000000015793–3014, NLM T15 LM07356), NSF, ONR, NGA, ARO, and DARPA. Computing resources were provided by the University of Minnesota Supercomputing Institute, and the Laboratory of Neuro Imaging (UCLA). We would like to thank Jennifer Campbell of McGill University, Katie L. McMahon and Greig I. de Zubicaray of the Centre for Magnetic Resonance, University of Queensland, and Margaret J. Wright of Queensland Institute of Medical Research for providing us with HARDI data.
Appendix
In this appendix, we provide additional details on the implementation of the proposed tractography technique.
The Hough transform is often used in global optimization problems to avoid local optimum solutions. This approach is however characterized by its high computational complexity, given that in a straightforward implementation, all possible solutions must be tested in order to reconstruct the table of scores. This issue could yet be alleviated by parallelizing the exhaustive searches at the seed points, as they can be computed independently of one another. Note that out of the d = 2N + 4 parameters (10 for a polynomial of order N = 3), two are the partial curve lengths (L+ and L−), for different values of which the score is computed on the fly while the integral of Eq. (10) is taken. This integral is in fact computed progressively by discretizing the 3D curve and summing the integrand while advancing on the curve. At each step, the value of the accumulator represents the score for a fixed set of polynomial coefficient values, with a new value for the length parameter. This reduces the space where the score-integral is computed to d′ = 2N + 2 dimensions (8 for N =3). For N = 2, the algorithm (implemented in C) took about one and a half minutes to compute the maximum-score curve among over four billion curves for each seed point. This was increased to one to two hours per seed point in the case of N = 3 to test over three hundred billion curves. We ran about 50 to 100 parallel jobs to be able to finish the entire tractography (using about 1500 seed points) in less than a day. Also note that the (potentially) high-dimensional table of scores need not be stored in computer memory, since the maximum score can be computed on the fly, thus circumventing any memory exhaustion.
A question which may arise while implementing the proposed algorithm, is whether all the polynomial coefficients should have the same discretization resolution, and if not, how to determine it. From Eq. (2) it can be seen that the small change Δak in the kth coefficient (due to its discretization resolution) results in the following change in at the arc length :
| (A.1) |
Ideally, we would like a uniform resolution for θ, which would mean that Δθ(s) needs to be independent of s and k. Although this dependency cannot be eliminated, it can be minimized by choosing a specific value for Δak. Assuming the desired constant value δ for Δθ(s), we minimize the following squared error integral to obtain the optimum value :
| (A.2) |
By choosing such resolutions for the polynomial coefficients ak, and similarly for bk, the curve space is discretized more uniformly, hence increasing the accuracy of the search for the high scoring curves.
Footnotes
Publisher's Disclaimer: This is a PDF file of an unedited manuscript that has been accepted for publication. As a service to our customers we are providing this early version of the manuscript. The manuscript will undergo copyediting, typesetting, and review of the resulting proof before it is published in its final citable form. Please note that during the production process errors may be discovered which could affect the content, and all legal disclaimers that apply to the journal pertain.
Please note that many prior approaches may as well be modified to perform efficient exhaustive searches.
This paper extends our previous conference versions for single and multiple subjects (Aganj et al., 2009a,b). In particular, we provide more implementation details and additional validation and comparisons.
As customary in probabilistic techniques, several candidate curves may as well be selected per seed point, each carrying a score.
The curve score is defined by assuming that adjacent voxels are independent, making it only an approximation of the true fiber log-probability. The incorporation of spatial coherence and continuity is the subject of future research.
Not including λ may cause the zero-length curve (L− = L+ = 0) to gain the maximum score, due to the potentially negative values of the logarithm.
A uniform distribution for the seed points would in fact force the algorithm to pick as many curves in the lesser anisotropic regions of the brain as in the highly anisotropic fiber bundles, sometimes producing unrealistic results.
As customary in probabilistic techniques, several candidate curves may be selected per seed point, each carrying a score. In our experiments, however, we used a winner-take-all approach and select/visualize only the maximum-score curve.
This is the standard procedure in the Hough transform, where the accumulator is discretized.
Note that this multi-scale approach is performed to discretize the Hough transform (the parameter space), and not the spatial domain itself.
This could be interpreted as multiple votes per voxel, cast by each corresponding voxel in each volume.
We chose to compare with Camino (and not e.g. FSL) to have a fair comparison between ODF-based methods.
Matlab codes to regenerate the phantom can be found at: netfiles.umn.edu/users/iman/www/Synth.zip
Scanning parameters, quoting from (Campbell et al., 2005): The cords were scanned 1 h after the surgeries with a Siemens 1.5T Sonata MR scanner (Siemens Medical Systems, Erlangen, Germany) using a knee coil. A single-shot spin-echo echo planar sequence with twice-refocused balanced gradients, designed for minimization of eddy current artifacts, was used. For diffusion tensor reconstruction, four coregistered datasets were acquired, consisting of 90 diffusion weighted images with isotropically spaced diffusion weighting directions (b = 1300 s/mm2, TR = 8s, TE = 110 ms, 2.5 mm isotropic voxels, 40 slices), as well as 10 images with b = 0 s/mm2 and otherwise identical imaging parameters.
This, however, needs further investigation which is part of the future research.
References
- Aganj I, Lenglet C, Keriven R, Sapiro G, Harel N, Thompson PM. A Hough transform global approach to diffusion MRI tractography; Proc. of 17th Annual Meeting of ISMRM; Honolulu. 2009a. [Google Scholar]
- Aganj I, Lenglet C, Sapiro G, Chiang MC, Thompson PM. Multi-subject diffusion MRI tractography via a Hough transform global approach; Proc. of 15th Annual Meeting of OHBM; San Francisco. 2009b. [Google Scholar]
- Aganj I, Lenglet C, Sapiro G, Yacoub E, Ugurbil K, Harel N. Reconstruction of the orientation distribution function in single and multiple shell q-ball imaging within constant solid angle. Magnetic Resonance in Medicine. 2010;64(2):554–566. doi: 10.1002/mrm.22365. [DOI] [PMC free article] [PubMed] [Google Scholar]
- Basser PJ, Mattiello J, LeBihan D. Estimation of the effective self-diffusion tensor from the NMR spin echo. J Magn Reson B. 1994;103(3):247–254. doi: 10.1006/jmrb.1994.1037. [DOI] [PubMed] [Google Scholar]
- Basser PJ, Pajevic S, Pierpaoli C, Duda J, Aldroubi A. In vivo fiber tractography using DT-MRI data. Magnetic Resonance in Medicine. 2000;44(4):625–632. doi: 10.1002/1522-2594(200010)44:4<625::aid-mrm17>3.0.co;2-o. [DOI] [PubMed] [Google Scholar]
- Batchelor PG, Hill DLG, Atkinson D, Calamante F. Study of connectivity in the brain using the full diffusion tensor from MRI; Proc. of 17th IPMI; Davis. 2001. [Google Scholar]
- Behrens TEJ, Jbabdi S. Diffusion MRI: From Quantitative Measurement to In-vivo Neuroanatomy. 1st ed. Academic Press; 2009. MR diffusion tractography. [Google Scholar]
- Behrens TEJ, Johansen Berg H, Jbabdi S, Rushworth MFS, Woolrich MW. Probabilistic diffusion tractography with multiple fibre orientations: What can we gain? NeuroImage. 2007;34(1):144–155. doi: 10.1016/j.neuroimage.2006.09.018. [DOI] [PMC free article] [PubMed] [Google Scholar]
- Björnemo M, Brun A, Kikinis R, Westin CF. Regularized stochastic white matter tractography using diffusion tensor MRI; Proc. of 5th MICCAI; Tokyo. 2002. [Google Scholar]
- Campbell JSW, Siddiqi K, Rymar VV, Sadikot AF, Pike GB. Flow-based fiber tracking with diffusion tensor and q-ball data: Validation and comparison to principal diffusion direction techniques. NeuroImage. 2005;27(4):725–736. doi: 10.1016/j.neuroimage.2005.05.014. [DOI] [PubMed] [Google Scholar]
- Chiang MC, et al. Brain fiber architecture, genetics, and intelligence: A high angular resolution diffusion imaging (HARDI) study; Proc. of 11th MICCAI; New York. 2008. [DOI] [PMC free article] [PubMed] [Google Scholar]
- Conturo TE, et al. Tracking neuronal fiber pathways in the living human brain. Proc. of National Academy of Sciences. 1999;96(18):10422–10427. doi: 10.1073/pnas.96.18.10422. [DOI] [PMC free article] [PubMed] [Google Scholar]
- Cook PA, et al. Camino: Open-source diffusion-MRI reconstruction and processing; 14th Scientific Meeting of the International Society for Magnetic Resonance in Medicine; Seattle, WA. 2006. [Google Scholar]
- de Zubicaray GI, et al. Meeting the Challenges of Neuroimaging Genetics. Brain Imaging and Behavior. 2008;2(4):258–263. doi: 10.1007/s11682-008-9029-0. [DOI] [PMC free article] [PubMed] [Google Scholar]
- Descoteaux M, Angelino E, Fitzgibbons S, Deriche R. Regularized, fast, and robust analytical q-ball imaging. Magnetic Resonance in Medicine. 2007;58(2):497–510. doi: 10.1002/mrm.21277. [DOI] [PubMed] [Google Scholar]
- Descoteaux M, Deriche R, Knösche TR, Anwander A. Deterministic and probabilistic tractography based on complex fibre orientation distributions. IEEE Transactions on Medical Imaging. 2009;28(2):269–286. doi: 10.1109/TMI.2008.2004424. [DOI] [PubMed] [Google Scholar]
- Duda RO, Hart PE. Use of the Hough transformation to detect lines and curves in pictures. Commun. ACM. 1972;15(1) [Google Scholar]
- El Kouby V, et al. MR diffusion-based inference of a fiber bundle model from a population of subjects; Proc. of 8th MICCAI; Palm Springs. 2005. [DOI] [PubMed] [Google Scholar]
- Fillard P, Poupon C, Mangin JF. A novel global tractography algorithm based on an adaptive spin glass model; Proc. of 12th MICCAI; London. 2009. [DOI] [PubMed] [Google Scholar]
- Friman O, Farnebäck G, Westin CF. A Bayesian approach for stochastic white matter tractography. IEEE Transactions on Medical Imaging. 2006;25(8):965–978. doi: 10.1109/tmi.2006.877093. [DOI] [PubMed] [Google Scholar]
- Fritzsche KH, Laun FB, Meinzer HP, Stieltjes B. Opportunities and pitfalls in the quantification of fiber integrity: What can we gain from Q-ball imaging? NeuroImage. 2010;51(1):242–251. doi: 10.1016/j.neuroimage.2010.02.007. [DOI] [PubMed] [Google Scholar]
- Funk P. Über eine geometrische Anwendung der Abelschen Integralgleichung. Mathematische Annalen. 1916;77:129–135. [Google Scholar]
- Gonzalez RC, Woods RE. Digital Image Processing. 3rd ed. Prentice Hall; 2008. [Google Scholar]
- Hageman NS, Toga AW, Narr KL, Shattuck DW. A diffusion tensor imaging tractography algorithm based on Navier-Stokes fluid mechanics. IEEE Transactions on Medical Imaging. 2009;28(3):348–60. doi: 10.1109/TMI.2008.2004403. [DOI] [PMC free article] [PubMed] [Google Scholar]
- Hagmann P, et al. DTI mapping of human brain connectivity: statistical fibre tracking and virtual dissection. NeuroImage. 2003;19(3):545–554. doi: 10.1016/s1053-8119(03)00142-3. [DOI] [PubMed] [Google Scholar]
- Haro G, Lenglet C, Sapiro G, Thompson PM. On the Non-Uniform Complexity of Brain Connectivity; Proc. 5th IEEE ISBI; Paris. 2008. [Google Scholar]
- Iturria-Medina Y, et al. Characterizing brain anatomical connections using diffusion weighted MRI and graph theory. NeuroImage. 2007;36(3):645–660. doi: 10.1016/j.neuroimage.2007.02.012. [DOI] [PubMed] [Google Scholar]
- Jackowski M, Kao C, Qiu M, Constable R, Staib L. White matter tractography by anisotropic wavefront evolution and diffusion tensor imaging. Medical Image Analysis. 2005;9(5):427–440. doi: 10.1016/j.media.2005.05.008. [DOI] [PMC free article] [PubMed] [Google Scholar]
- Jbabdi S, Bellec P, Toro R, Daunizeau J, Pelegrini-Issac M, Benali H. Accurate anisotropic fast marching for diffusion-based geodesic tractography. International Journal of Biomedical Imaging. 2008 doi: 10.1155/2008/320195. 2008. [DOI] [PMC free article] [PubMed] [Google Scholar]
- Jbabdi S, Woolrich MW, Behrens TEJ. Multiple-subjects connectivity-based parcellation using hierarchical Dirichlet process mixture models. NeuroImage. 2009;44(2):373–384. doi: 10.1016/j.neuroimage.2008.08.044. [DOI] [PubMed] [Google Scholar]
- Jones DK. Tractography gone wild: Probabilistic fibre tracking using the wild bootstrap with diffusion tensor MRI. IEEE Transactions on Medical Imaging. 2008;27(9):1268–1274. doi: 10.1109/TMI.2008.922191. [DOI] [PubMed] [Google Scholar]
- Jones DK, Simmons A, Williams SCR, Horsfield MA. Non-invasive assessment of axonal fiber connectivity in the human brain via diffusion tensor MRI. Magnetic Resonance in Medicine. 1999;42(1):37–41. doi: 10.1002/(sici)1522-2594(199907)42:1<37::aid-mrm7>3.0.co;2-o. [DOI] [PubMed] [Google Scholar]
- Kang N, Zhang J, Carlson ES, Gembris D. White matter fiber tractography via anisotropic diffusion simulation in the human brain. IEEE Transactions on Medical Imaging. 2005;24(9):1127–1137. doi: 10.1109/TMI.2005.852049. [DOI] [PubMed] [Google Scholar]
- Kreher BW, Mader I, Kiselev VG. Gibbs tracking: A novel approach for the reconstruction of neuronal pathways. Magnetic Resonance in Medicine. 2008;60(4):953–963. doi: 10.1002/mrm.21749. [DOI] [PubMed] [Google Scholar]
- Lazar M, Alexander AL. Bootstrap white matter tractography (BOOT-TRAC) NeuroImage. 2005;24(2):524–532. doi: 10.1016/j.neuroimage.2004.08.050. [DOI] [PubMed] [Google Scholar]
- Lazar M, et al. White matter tractography using diffusion tensor deflection. Human Brain Mapping. 2003;18(4):306–321. doi: 10.1002/hbm.10102. [DOI] [PMC free article] [PubMed] [Google Scholar]
- Leemans A, Sijbers J, De Backer S, Vandervliet E, Parizel P. Multiscale white matter fiber tract coregistration: a new feature-based approach to align diffusion tensor data. Magnetic Resonance in Medicine. 2006;55(6):1414–1423. doi: 10.1002/mrm.20898. [DOI] [PubMed] [Google Scholar]
- Lenglet C, Prados E, Pons JP, Deriche R, Faugeras O. Brain connectivity mapping using riemannian geometry, control theory, and PDEs. SIAM Journal on Imaging Sciences. 2009a;2(2):285–322. [Google Scholar]
- Lenglet C, et al. High resolution diffusion MRI on in-vivo monkey brains at 7T; Proc. 14th Annual Meeting of OHBM; San Francisco. 2009b. [Google Scholar]
- Maddah M, Grimson WEL, Warfield SK. Statistical modeling and EM clustering of white matter fiber tracts. Proc. of 3rd IEEE ISBI. 2006 [Google Scholar]
- Mangin JF, et al. A framework based on spin glass models for the inference of anatomical connectivity from diffusion-weighted MR data - a technical review. NMR in Biomedicine. 2002;15(7–8):481–492. doi: 10.1002/nbm.780. [DOI] [PubMed] [Google Scholar]
- Melonakos J, Mohan V, Niethammer M, Smith K, Kubicki M, Tannenbaum A. Finsler tractography for white matter connectivity analysis of the cingulum bundle; Proc. of 10th MICCAI; Brisbane. 2007. [DOI] [PMC free article] [PubMed] [Google Scholar]
- Mori S, Crain BJ, Chacko VP, Van Zijl PCM. Three dimensional tracking of axonal projections in the brain by magnetic resonance imaging. Annals of Neurology. 1999;45(2):265–269. doi: 10.1002/1531-8249(199902)45:2<265::aid-ana21>3.0.co;2-3. [DOI] [PubMed] [Google Scholar]
- O'Donnell L, Haker S, Westin CF. New approaches to estimation of white matter connectivity in diffusion tensor MRI: Elliptic PDEs and geodesics in a tensor-warped space; Proc. of 5th MICCAI; Tokyo. 2002. [Google Scholar]
- O'Donnell LJ, Westin CF. Automatic tractography segmentation using a high-dimensional white matter atlas. IEEE Transactions on Medical Imaging. 2007;26(11):1562–1575. doi: 10.1109/TMI.2007.906785. [DOI] [PubMed] [Google Scholar]
- Parker GJM, Haroon HA, Wheeler-Kingshott CAM. A framework for a streamline-based probabilistic index of connectivity (PICo) using a structural interpretation of MRI diffusion measurements. Journal of Magnetic Resonance Imaging. 2003;18(2):242–254. doi: 10.1002/jmri.10350. [DOI] [PubMed] [Google Scholar]
- Parker GJM, Wheeler-Kingshott CAM, Barker GJ. Estimating distributed anatomical connectivity using fast marching methods and diffusion tensor imaging. IEEE Transactions on Medical Imaging. 2002;21(5):505–512. doi: 10.1109/TMI.2002.1009386. [DOI] [PubMed] [Google Scholar]
- Pechaud M, Descoteaux M, Keriven R. Brain connectivity using geodesics in HARDI; Proc. of 12th MICCAI; London. 2009. [DOI] [PubMed] [Google Scholar]
- Pichon E, Westin CF, Tannenbaum AR. A Hamilton-Jacobi-Bellman approach to high angular resolution diffusion tractography; Proc. of 8th MICCAI; Palm Springs. 2005. [DOI] [PMC free article] [PubMed] [Google Scholar]
- Prados E, et al. Control theory and fast marching methods for brain connectivity mapping; Proc. IEEE Conf. CVPR; New York. 2006. [Google Scholar]
- Seunarine KK, Cook PA, Hall MG, Embleton KV, Parker GJM, Alexander DC. Exploiting peak anisotropy for tracking through complex structures; IEEE 11th International Conference on Computer Vision, Workshop on MMBIA; London. 2007. [Google Scholar]
- Sotiropoulos SN, Bai L, Morgan PS, Constantinescu CS, Tench CR. Brain tractography using q-ball imaging and graph theory: Improved connectivities through fibre crossings via a model-based approach. NeuroImage. 2010;49(3) doi: 10.1016/j.neuroimage.2009.10.001. [DOI] [PubMed] [Google Scholar]
- Tournier JD, Calamante F, Gadian DG, Connelly A. Diffusion-weighted magnetic resonance imaging fibre tracking using a front evolution algorithm. NeuroImage. 2003;20(1):276–288. doi: 10.1016/s1053-8119(03)00236-2. [DOI] [PubMed] [Google Scholar]
- Tuch DS. Q-ball imaging. Magnetic Resonance in Medicine. 2004;52(6):1358–1372. doi: 10.1002/mrm.20279. [DOI] [PubMed] [Google Scholar]
- Voineskos AN, et al. Quantitative examination of a novel clustering method using magnetic resonance diffusion tensor tractography. NeuroImage. 2009;45(2):370–376. doi: 10.1016/j.neuroimage.2008.12.028. [DOI] [PMC free article] [PubMed] [Google Scholar]
- Wakana S, Jiang H, Nagae-Poetscher LM, van Zijl PCM, Mori S. Fiber tract-based atlas of human white matter anatomy. Radiology. 2004;230:77–87. doi: 10.1148/radiol.2301021640. [DOI] [PubMed] [Google Scholar]
- Wedeen VJ, Hagmann P, Tseng WI, Reese TG, Weisskoff RM. Mapping complex tissue architecture with diffusion spectrum magnetic resonance imaging. Magnetic Resonance in Medicine. 2005;54(6):1377–1386. doi: 10.1002/mrm.20642. [DOI] [PubMed] [Google Scholar]
- Yörük E, Acar B, Bammer R. A physical model for DT-MRI based connectivity map computation; Proc. of 8th MICCAI; Palm Springs. 2005. [DOI] [PubMed] [Google Scholar]
- Zalesky A. DT-MRI fiber tracking: a shortest paths approach. IEEE Transactions on Medical Imaging. 2008;27(10):1458–1471. doi: 10.1109/TMI.2008.923644. [DOI] [PubMed] [Google Scholar]


