

Abstract
Early in the last century August Krogh embarked on a series of seminal studies to understand the connection between tissue metabolism and mechanisms by which the cardiovascular system supplied oxygen to meet those needs. Krogh recognized that oxygen was supplied from blood to the tissues by passive diffusion and that the most likely site for oxygen exchange was the capillary network. Studies of tissue oxygen consumption and diffusion coefficient, coupled with anatomical studies of capillarity in various tissues, led him to formulate a model of oxygen diffusion from a single capillary. Fifty years after the publication of this work, new methods were developed which allowed the direct measurement of oxygen in and around microvessels. These direct measurements have confirmed the predictions by Krogh and have led to extensions of his ideas resulting in our current understanding of oxygenation within the microcirculation. Developments during the last 40 years are reviewed, including studies of oxygen gradients in arterioles, capillaries, venules, microvessel wall and surrounding tissue. These measurements were made possible by the development and use of new methods to investigate oxygen in the microcirculation, so mention is made of oxygen microelectrodes, microspectrophotometry of haemoglobin and phosphorescence quenching microscopy. Our understanding of oxygen transport from the perspective of the microcirculation has gone from a consideration of oxygen gradients in capillaries and tissue to the realization that oxygen has the ability to diffuse from any microvessel to another location under the conditions that there exists a large enough PO2 gradient and that the permeability for oxygen along the intervening pathway is sufficient.
Keywords: oxygen transport, microcirculation, oxygen tension
INTRODUCTION
Early in the twentieth century, August Krogh conducted pioneering studies on the transport of oxygen and is considered by many as the founder of this field of research (Krogh 1959). At this time in his career, Krogh had a strong interest in understanding tissue metabolism and the role played by oxygen. From his writings, it is clear Krogh was convinced that capillaries were the primary site of oxygen exchange between the blood and tissue, in part because of their high surface area to volume ratio and the fact that the residence time for blood passing through them was relatively long. He carried out anatomical studies in which he determined the extent of the capillary network (capillary density) in various tissues, especially skeletal muscle, due in part to its rather regular vascular network architecture compared with other tissues and its obvious relevance to exercise (Krogh 1919b). This work was complemented by corresponding physiological/biophysical studies in which the diffusion coefficient for oxygen and oxygen consumption were determined (Krogh 1919a). He then employed these experimental findings in a mathematical model of oxygen transport (Krogh Cylinder Model) and concluded that only a small gradient in oxygen tension (PO2) was needed between the blood and tissue to ensure that the tissue received an amount of oxygen necessary to meet its metabolic needs (Krogh 1919b).
Krogh's concept for oxygen transport to tissue was based on several assumptions: (1) oxygen diffused passively and uniformly in the radial direction from blood in the capillary to tissue; (2) blood in capillaries was a homogeneous fluid and offered no resistance to diffusion; (3) oxygen consumption rate in the tissue was the same throughout the cylinder volume; (4) the variable capillary density was a regulator of the oxygen transport rate; (5) arterial blood was delivered to the capillary so that the inlet PO2 was ~100 mmHg. Thus, in Krogh's tissue cylinder there was a longitudinal oxygen gradient within capillaries and a radial oxygen gradient within tissue.
Over the next five decades following publication of the Krogh Cylinder Model, there were a number of variations on the theme of the model (see Popel 1989), but no viable arguments to detract from its value as a unifying principle in the study of oxygen transport. For instance, Stainsby and Otis (1964) interpreted some of their findings on isolated, perfused dog gastrocnemius muscle by applying the Krogh Cylinder Model to the analysis of their data. Based on geometric data from corrosion casts of contracted skeletal muscle, Ellis et al (1983) concluded that a more appropriate model for oxygen transport in this situation was that first described by Hill (1928). Since Krogh's formulation of oxygen transport was aimed at the microcirculatory level of organization, it would have been natural for experimental studies to explore oxygen exchange in the microcirculation. However, over the time period from 1920 to about 1970, only limited progress was made on experimental studies of oxygen transport at the level of capillaries. From the mid-to-late 1960s new technology, in the form of intravital video microscopy and microelectrodes to measure PO2, was being developed that would provide opportunities to embark on novel studies of oxygen in the microcirculation. Figure 1 provides an overview of the oxygen levels that have been found in arterioles, capillaries and venules of various tissues. The text that follows provides some perspective with which to view these measurements.
FIGURE 1.
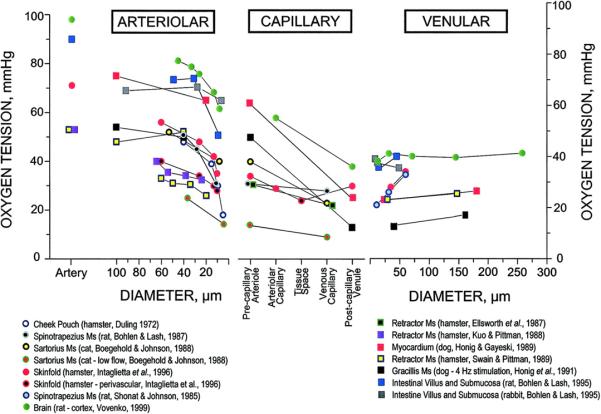
Overview of oxygen tension (PO2) values for arterioles, capillaries and venules for various tissues compiled by Tsai et al (2003). Used by permission of the American Physiological Society.
OXYGEN GRADIENTS IN ARTERIOLES
The first systematic measurements of oxygen in microvascular networks were carried out 40 years ago by Duling (Duling & Berne 1970) using recessed-tip PO2 microelectrodes (Whalen et al 1967) and intravital video microscopy (Bloch 1962; Wiederhielm 1963) in the thin preparations of the hamster cheek pouch and cremaster muscle that were superfused with physiological salt solutions equilibrated with low PO2 gas mixtures. Following Krogh's assumptions about oxygen delivery to the capillaries (i.e., that arterial blood arrives at the entrance to the capillary network), it was expected that oxygenation of the blood throughout the branches of the arteriolar network would be that of arterial blood. Surprisingly, Duling found that there was a progressive decrease in perivascular PO2 as measurements were made on successive arborizations of the arteriolar network of these tissues – there was a longitudinal gradient of PO2 in precapillary microvessels. The PO2 measurements were made on the external surface of the arterioles (i.e., perivascular) to avoid damage to the arteriolar wall that typically occurs when the wall is penetrated by a sharp object (tip diameter < 5 μm), resulting in platelet aggregation at the site of injury. Although placement of the electrode tip in a perivascular position reduced the possibility of microvascular injury, it was necessary to determine whether perivascular PO2 was a good approximation for intravascular PO2, i.e., that there was an insignificant transmural PO2 gradient across the arteriolar wall. Thus, some measurements were made in which the microelectrode was briefly positioned just inside the lumen and then withdrawn to the periarteriolar position, with the finding that only a small transmural PO2 gradient was observed (~ 1 mmHg), justifying the use of the less invasive periarteriolar PO2 measurements to estimate intravascular PO2. Although it was found that the periarteriolar PO2 measurements were relatively insensitive to the presence of the superfusion solution when its PO2 was low (< 20 mmHg), the same was not true for similar measurements near capillaries and venules; i.e., the superfusion solution had an effect on the PO2 of these more downstream vessels with lower flow and PO2.
The question naturally arises “Since most (~98%) of the oxygen in blood is carried by that bound to haemoglobin in the erythrocytes (red blood cells, RBCs) and the oxygen microelectrode measures physically dissolved oxygen (~2%), is the observed longitudinal gradient in arteriolar oxygen simply a manifestation of a small oxygen loss from the plasma component rather than the entire blood content of oxygen”? The answer to this question required the development of a technique to measure the amount of oxygen bound to the haemoglobin in the RBCs or the haemoglobin oxygen saturation (SO2) in microvessels. Following the design principles of oximeters that relied on differences in light absorption by oxy- and deoxy-haemoglobin, and further taking into account the contribution of light scattering by RBCs, a technique was developed to determine SO2 of blood flowing through individual microvessels (Pittman & Duling 1975a, b). This new technique was employed, together with oxygen microelectrodes, to make simultaneous measurements of PO2 and SO2 for arterioles in the hamster cheek pouch, ranging in diameter from about 100 down to 20 μm in diameter. These results confirmed that the longitudinal gradient in PO2 was associated with a corresponding gradient in SO2, related by the oxygen dissociation curve (Pittman & Duling 1977). Thus, the observed longitudinal gradient in blood oxygenation in the arteriolar network was a gradient in total oxygen – that dissolved in plasma plus bound to haemoglobin. Although Krogh did not predict this loss of oxygen from the blood prior to its arrival at the capillaries, possibly because his attention was more focused on the capillaries, we can imagine that he would not have been surprised by this finding.
Measurements of PO2 using microelectrodes
Although at first the observation of the pre-capillary loss of oxygen was viewed with some skepticism, it has been replicated in numerous tissues in a variety of species and is now a widely accepted phenomenon in microvascular networks (see Pittman 2005). Work by others using microelectrodes (Ivanov et al 1982; Lash & Bohlen 1987; Sharan et al 2008) has confirmed the general findings of Duling and Berne (1970).
Measurements of SO2 using microspectrophotometry of haemoglobin
Since almost all of the oxygen carried in blood is reversibly bound to erythrocytic haemoglobin, the total oxygen concentration or content of blood is, to a good approximation, proportional to the SO2 of blood. By using the oxygen dissociation curve of blood, one can calculate SO2 from PO2 and estimate the oxygen content of blood. However, this estimate requires either measurements of or assumptions about the allosteric effectors of oxygen binding to haemoglobin, namely pH, PCO2, 2,3 diphosphoglycerate and temperature. While temperature can be controlled accurately with the appropriate thermo-regulated platforms, accurate knowledge of the other quantities is more difficult, making the accurate estimation of SO2 problematic. That is why the direct measurement of SO2 provides an advantage over the more indirect approach using PO2 and an assumed oxygen dissociation curve. Another advantage of the use of the less invasive optical determination of blood oxygenation, compared with microelectrodes requiring contact with the measured tissue, is that a superfusion solution is not needed in the former situation. While a superfusion solution has the capability of controlling the chemical environment in contact with the tissue surface and providing an easy route for the administration of various pharmacological agents, its ability to insulate the tissue from the atmospheric gaseous environment is less certain (i.e., it is difficult to be sure of the amount of gas exchange between the tissue and atmosphere, due to uncertainties about uniformity of flow and temperature of the fluid in contact with the tissue surface).
The initial applications of microspectrophotometry to investigate oxygen transport in the microcirculation were carried out on the cheek pouch retractor muscle of the hamster (Sullivan & Pittman 1984). This tissue was isolated from the atmosphere by covering it with a thin, transparent plastic film (Saran) whose permeability to oxygen and other gases was extremely low. Thus, for purposes of formulating a mathematical model of oxygen convection, diffusion and consumption in microvascular networks, this scenario was simpler and required fewer assumptions about boundary conditions related to oxygen than for a superfused preparation. In an effort to quantify oxygen transport in arterioles under these circumstances, measurements of haemoglobin concentration ([Hb], Lipowsky et al 1982), average RBC velocity (vRBC, Wayland & Johnson 1967) and arteriolar diameter (d), as well as SO2, were made at upstream and downstream sites of unbranched arteriolar segments at four consecutive branching orders. Convective oxygen flow (QCO2) at each measurement site was calculated as
| [1] |
where CHb is the oxygen binding capacity of haemoglobin (1.34 ml O2 gHb-1; reduced from the stoichiometrically expected 1.39 by the usual presence of 1-2% methaemoglobin plus 1-2% COHb). These measurements were made under normal hematocrit (Swain & Pittman 1989), reduced hematocrit or hemodilution (Kuo & Pittman 1988) and increased hematocrit or hemoconcentration (Kuo & Pittman 1990). The data on convective oxygen flow from each of these studies was used to compute diffusive oxygen flow (QDO2) across the arteriolar wall of each segment as the difference between convective oxygen flow at the upstream and downstream sites:
| [2] |
A careful evaluation of oxygen losses from arterioles under these conditions showed that the estimate of arteriolar oxygen diffusion computed in this way was an order of magnitude higher than expected from predictions of conventional diffusion theory (Popel et al 1989; Popel 1989).
An implicit assumption embodied in Eq. 1 is that the radial distributions of haemoglobin and oxygen at each measurement site are uniform. This is almost certainly not the case for two reasons. First, the upstream site was typically chosen just downstream of a bifurcation, so that the luminal distribution RBCs was probably nonuniform and asymmetric there (Ellsworth & Pittman 1986) and the rearrangement of RBCs as they move downstream and to a more symmetric distribution is a slow process. Second, the radial distribution of oxygen would be expected to be nonuniform, so that SO2 would decrease from the axis of the arteriole to the wall, given the net diffusion of oxygen out of the blood. Such nonuniform luminal distributions have been observed in arterioles, lending experimental support to this proposal (Kobayashi & Takizawa 2002). Since there is reason to believe that both [Hb] and SO2 are distributed nonuniformly within the lumen, these spectrophotometrically determined quantities actually represent averages of [Hb] and SO2 along the light path through the lumen. Also, since QDO2 was computed as the difference between two relatively large, but similar, values, even a small systematic error between the upstream and downstream QCO2 values could give rise to the order of magnitude discrepancy in QDO2 (see Pittman 2005). A systematic search was carried out to determine whether there was any evidence of a systematic error between upstream and downstream values of any of the primary variables used in the calculation of QCO2. SO2 was the only variable with a significant difference between the upstream and downstream sites, suggesting that perhaps neglect of the nonuniformity of SO2 at the two sites might be linked to an artifactually large QDO2. This discrepancy has still not been satisfactorily resolved and is ripe for further investigation. Recent measurements of intravascular PO2 gradients have confirmed their presence in arterioles (Golub & Pittman 2002; Carvalho & Pittman 2008).
Because of the apparently large loss of oxygen from the arterioles, a natural question to consider is “What is the destination for the ‘lost’ oxygen?” Three obvious possibilities to consider are: (1) consumption of oxygen by neighboring parenchymal cells; (2) diffusion of oxygen to other nearby microvessels (e.g., capillaries and venules); and (3) consumption of oxygen within the arteriolar wall. The first possibility appears to be a natural one in which the arterioles act as a source of oxygen for tissue metabolism, much as the capillaries do (i.e., the cells that consume oxygen neither know nor care what the source of the oxygen is). It is not uncommon, especially in dense microvascular networks, for arterioles to be in close proximity to other microvessels – arterioles, capillaries or venules. For instance, Ellsworth and Pittman (1990) demonstrated that capillaries acquired oxygen by diffusion from nearby arterioles, a phenomenon supported by computational modeling (Secomb & Hsu 1994). Although Swain and Pittman (1989) had assumed that the arteriolar wall did not possess any exceptional capacity to consume oxygen, Tsai et al (1998) proposed that the explanation for the apparently large oxygen loss from arterioles was just that – a dramatically high oxygen consumption (two to three orders of magnitude higher than resting skeletal muscle) by some component of the arteriolar wall.
Measurements of PO2 using phosphorescence quenching microscopy
Phosphorescence quenching microscopy (PQM) is a relatively new tool for measuring PO2 in the microcirculation. A phosphorescent molecule (e.g., meso-tetra-(4-carboxyphenyl) palladium prophyrin bound to albumin) is introduced into the site of the PO2 measurements. For instance, the phosphorescent probe could be injected into the circulation for intravascular measurements or topically applied to the tissue of interest for measurements in the interstitium. In the so-called time-domain method (Vanderkooi et al 1987), the phosphor is excited by a brief (~10 μs) flash of light at the appropriate excitation wavelength, and the phosphorescence is observed over a several millisecond time course as the excited phosphor decays to the ground state. The rate of the exponential decay of the excited phosphor (k) depends on the presence of oxygen in its immediate environment, as energy is transferred to oxygen (collisional quenching) according to the Stern-Volmer equation, k = k0 + kQ PO2, where k0 is the decay rate in the absence of oxygen and kQ is the quenching coefficient. Both k0 and kQ are determined in separate calibration experiments. To obtain the PO2 associated with a given phosphorescence decay curve, the curve is fit to an appropriate equation that should describe the time course of the decay (Golub et al 1997), taking into account any non-uniformity of PO2 at the measurement site. The signal-to-noise ratio (S/N) of the collected phosphorescence decay curves is important, since the accuracy of the PO2 determined from the curves by fitting the curves to an appropriate decay model depends critically on having a favorable S/N. A conventional approach to improving the S/N of collected curves is to average enough curves to yield S/N > 100. This can be accomplished by using multiple excitation flashes until a sufficient number of curves are collected. Assuming that the curves should be collected over a short time frame to give good time resolution, this implies that the excitation flash rate should be high. We will later see that there are problems associated with a high excitation rate. This technique was originally developed for macroscopic systems (Vanderkooi et al 1987) and later modified for implementation in intravital microscopy (Torres Filho & Intaglietta 1993). In recent years the method has been refined by improving the signal-to-noise ratio of the detected phosphorescent decay (only a single decay curve is needed to yield a PO2 value) and analysis of situations in which there is heterogeneity of PO2 at the measurement site (Golub et al 1997, 1999), as well as the spatial (~1 μm) and temporal (~10 ms) resolution for measurements of PO2 transients in capillaries due to the passage of RBCs (Golub & Pittman 2004). A recent novel application of PQM is the determination of local oxygen consumption in thin tissues by rapidly (< 1 sec) compressing the tissue to arrest blood flow and measuring the rate of disappearance of oxygen from a small region (~ 600 μm diameter). The oxygen consumption is equal to the oxygen solubility of the interstitial fluid times the rate of decrease of PO2 in the observed region (Golub et al, 2011).
OXYGEN GRADIENTS IN THE ARTERIOLAR WALL
If the arteriolar wall is the site of a large sink for oxygen with a typical permeability to oxygen, then one would expect there to be a substantial transmural PO2 difference (this difference is proportional to the ratio of O2 consumption to Krogh's diffusion coefficient for O2). Measurements of transmural PO2 using microelectrodes were carried out by Duling in the 1970s (Duling & Berne 1970; Duling et al 1978) and more recently by Vovenko (Sharan et al 2008) with the finding that the gradient is only a few mmHg.
Tsai et al (1998) reported measurements of a large transmural PO2 in arterioles of rat mesentery (~30 mmHg) using phosphorescence quenching microscopy. This finding implied that the arteriolar wall consumes oxygen at a rate of 100 to 1000 times higher than expected for vascular cells. This interpretation of the measurements, if correct, would lead to substantial revisions in our concepts about oxygen transport. To determine whether there was any independent evidence in the literature for such a high oxygen consumption, Vadapalli et al (2000) compiled data from the literature for vascular tissue and also estimated the maximum oxygen consumption of the arteriolar wall based on its mitochondrial content, Mmt (see Fig. 2). All published values for isolated vascular cells, in vitro vascular tissue and large vessels in vivo are smaller than Mmt, providing some assurance that the calculation is supported by experimental results. The value for oxygen consumption by the arteriolar wall calculated by Tsai et al (1998; □1 in Fig. 2) is an order of magnitude larger than Mmt, giving one pause to understand the origin of the large transmural PO2 reported by Tsai et al (1998).
FIGURE 2.
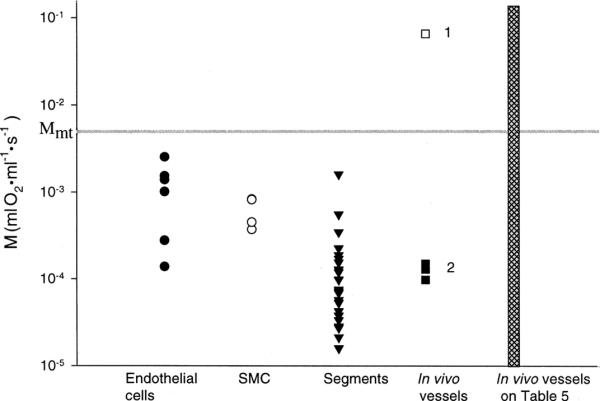
Compilation of oxygen consumption values for vascular tissues from Vadapalli et al (2000). “SMC” stands for smooth muscle cells; “Segments” refers to isolated segments of blood vessels; “In vivo vessels” refers to (1) data from Tsai et al (1998) and (2) data from larger arterial vessels. M is oxygen consumption (ml O2 ml-1 s-1) for the different vascular tissues displayed. Horizontal line at Mmt represents the maximum oxygen consumption predicted on the basis of the mitochondrial content of the tissues considered. □1 is result from Tsai et al (1998). See Table 5 of Vadapalli et al (2000) for source of microvascular results whose range is represented by the height of the cross-hatched bar. Used by permission of the American Physiological Society.
A potential explanation for the large arteriolar wall oxygen consumption lies with the application of the phosphorescence quenching method itself. The act of measuring PO2 using PQM creates an excited phosphor molecule that transfers energy to oxygen molecules and produces singlet oxygen which reacts with nearby organic molecules, thereby consuming oxygen. The amount of oxygen consumption increases with the energy of the excitation flash, the concentration of the phosphor and the PO2 at the measurement site. The consumption results in a reduction of PO2 at the measurement site by about 0.3 mmHg per flash, using typical excitation parameters (Pittman et al 1998). If enough oxygen can diffuse into the excitation region before the next flash occurs, then PO2 can be restored to its initial value. However, if the next flash occurs before oxygen has been replenished at the measurement site, then PO2 falls with each flash until a new steady state is established where the rate at which oxygen is consumed by the flash excitation is equal to the rate at which oxygen diffuses into the site. Thus, for intravascular measurements of PO2, oxygen is replenished quickly by the convective flow into the region; however, for extravascular measurements, oxygen restoration is limited by diffusion into the excitation site. Therefore it is apparent that a physical constraint exists between the size of the excitation region (radius = R) and excitation flash frequency (F). The time required for the oxygen level to be restored to 90% of its original value is given by T90 = 0.54 R2/DO2 (Crank 1956), where DO2 = 1.04.10-5 cm2 s-1, so that one requires the time between excitation flashes (1/F) to be greater that T90 or F < D/(0.54 R2). For the PQM system described by Tsai et al (1998), F = 30 Hz, R = 70 μm and T90 ≈ 2.5 s, whereas the time between flashes in their system was 1/30 = 0.033 s. Thus, it is clear that insufficient time existed between flashes for the restoration of oxygen and one would expect the PO2 to progressively decrease with each flash.
Based on this explanation, one can prescribe criteria for reliable microcirculatory PO2 measurements using PQM. To minimize the oxygen consumption per flash, the excitation light intensity and the phosphor concentration should be low. The detection region should be large (~ 0.5 mm referenced to the microcirculation), so as to improve the signal-to-noise ratio (S/N) by spatial averaging of the signal and obviate the need for averaging many low S/N decay curves over a short time (implying a high excitation frequency). To compensate for the oxygen consumption by PQM, a small excitation region and a low flash frequency should also be employed. Golub and Pittman (2008) described the properties of PQM instruments that had large (LEA) and small (SEA) excitation areas and introduced the related measurement artifact that could arise with intravascular measurements, based on the concept of “critical velocity” (Vcrit), since it is desirable to avoid multiple excitations of the same blood volume. For a large excitation area instrument, Vcrit(LEA) = (Rex+rsamp)F; similarly, for a small excitation area instrument, Vcrit(SEA) = 2rsampF (since Rex = rsamp), where Rex is the radius of the excitation region and rsamp is the radius of the region from which the phosphorescence signal is sampled. If blood velocity < Vcrit, then a given blood volume moving through the excitation region will experience multiple excitations and suffer accumulated reductions in PO2. Multiple excitations of the same volume can lead to spurious results such as large transmural PO2, accentuated longitudinal PO2 gradients related to decreasing blood velocity and U-shaped PO2 profiles from the arteriolar through the venular network. The principles of LEA and SEA implementations of PQM and apparent paradoxes related to oxygen transport in the microcirculation are described in detail by Golub and Pittman (2008).
It is of interest to consider the report by Tsai et al (1998) that the oxygen consumption associated with the phosphorescence method only reduced PO2 by 0.02 mmHg per flash, so that for 90 flashes (30 Hz flash rate for 3 s) PO2 would be reduced by only 1.8 mmHg. A contemporaneous study of this issue by Pittman et al (1998) found that, under similar circumstances, PO2 fell by ~ 0.3 mmHg per flash, a result 15 times larger than that of Tsai et al (1998). A careful analysis of the experiment by Tsai et al (1998) revealed that there was a flaw in the interpretation of their result. The phosphor solution was contained in a glass tube 75 mm long and all but a 0.5 mm region in the middle of the tube was masked to prevent excitation of solution outside this region. Because oxygen is consumed at a rate of about 0.3 mmHg per flash, within a few seconds the PO2 in the narrow excitation region was depleted of oxygen. This caused oxygen to diffuse into this region from the neighboring well-oxygenated regions to each side of the central oxygen-depletion zone. Since oxygen consumption by the method is proportional to the PO2 in the excited volume, once most of the oxygen had been consumed, very little additional oxygen was consumed. Standard diffusion theory (Crank 1956) allows one to estimate that the oxygen depletion zone probably expanded to as much as 2.5 mm to each side of the center of the tube, so that at the end of the flash excitation period, PO2 was essentially zero in a 5 mm central zone of the 75 mm long tube, or about 1/15 of the tube. At the end of the experiment the contents of the tube were mixed and the PO2 measured. Thus, the oxygen consumption per flash was actually 15 times the reported value or 0.02 mmHg × 15 = 0.3 mmHg per flash, in agreement with the results of Pittman et al (1998). A more detailed description of this analysis appears in Tsai et al (2005). It is of interest to note that the transmural PO2 reported by Tsai et al (1998) is about 90 flashes × 0.3 mmHg per flash = 27 mmHg.
In order to further minimize the artifact associated with multiple excitation of the same site, whether stationary or moving, a new version of the phosphorescence quenching measurement of PO2 has been introduced in which the excitation spot is scanned in discrete steps across the measurement region. The excitation spot skips from one measurement site to the next in a systematic cycle, so that sufficient time elapses between excitations of a given site to allow for restoration of the small amount of oxygen consumed by the excitation. Thus, the scanning approach prevents the accumulated effects of oxygen consumption by PQM, since there is only one excitation flash at each measurement site during a scanning cycle. This approach was used to obtain a virtually artifact-free PO2 profile in the tissue around mesenteric arterioles (Golub et al 2007). Fits of the PO2 profile to a one-dimensional model of oxygen diffusion and consumption demonstrate that the oxygen consumption of the wall and tissue is similar to that of most other quiescent cells, in contrast to the report of Tsai et al (1998).
OXYGEN GRADIENTS IN VENULES
Swain and Pittman (1989) reported measurements of SO2 in two branching orders of arterioles and venules of the hamster retractor muscle that represented the most upstream and downstream vessels of each type in which SO2 measurements could be made. One of the main findings from this study was that in this resting muscle about two-thirds of the oxygen which was removed from the entering blood was lost in the arteriolar network, while the remaining one-third was lost from the capillary network. Thus, one could conclude that in an inactive (resting) tissue with low metabolism and blood flow, the arterioles appear to be a major site for oxygen exchange. Recent measurements of intravascular PO2 in mesenteric arterioles and venules indicate that in this tissue with very low metabolic rate, there is no detectable longitudinal gradient of PO2 in either arterioles or venules (Golub et al 2009). In addition, application of the scanning approach to PQM in which only two excitation spots are used at a time, arteriolar-venular diffusive PO2 gradients can be measured directly.
OXYGEN GRADIENTS IN TISSUE
Oxygen gradients in the tissue are determined by the combined effects of cellular metabolism and the diffusion coefficient of oxygen in the interstitial fluid and intracellular milieu. The diffusion coefficients for oxygen in the intra- and extra-cellular compartments should be relatively stable for a given tissue, so that the magnitude of oxygen gradients would be linked to the metabolic activity of the tissue. Skeletal muscle is an example of a tissue with a wide dynamic range for its metabolism, so that the tissue oxygen gradients would be expected to be steeper during muscle contraction compared with the resting state. Because of the relatively large tissue movements during muscle contraction, use of microelectrodes to measure PO2 are generally problematic, although Lash and Bohlen (1987) have reported such measurements in the contracting rat spinotrapezius muscle. Nitric oxide (NO) is thought to have an inhibitory influence on mitochondrial oxygen consumption (Brown 1999), so that changes in NO levels in the mitochondria will alter oxygen consumption and hence the magnitude of tissue oxygen gradients.
The occurrence of the oxygen-binding protein myoglobin in some muscle cells will also have an effect on tissue oxygen gradients. Honig and Gayeski (1987) used cryospectrophotometric measurements to determine cellular oxygenation of myoglobin-containing muscle cells and, based on a reported spatial resolution of ~1 μm for the measurements of myoglobin oxygenation, concluded that there were virtually no intracellular gradients in oxygen. A later report by Voter and Gayeski (1995), which dealt with the technical characteristics of the myoglobin measurements, however, raised concerns regarding the spatial resolution of this technique (report of ~ 120 μm resolution vs previous value of ~1 μm, implying that the signal in this instrument was averaged over several muscle fibers) and the interpretation of the intracellular PO2 values. Some support for the negligible intracellular PO2 gradients has been provided using proton magnetic resonance spectroscopy (MRS) studies of myoglobin during muscle contraction in humans by Richardson et al. (1995) and Mole et al. (1999), who found very low intramyocyte PO2 values that were not consistent with pronounced intracellular PO2 gradients. In regard to the proton MRS measurements, the signal is being averaged over a number of muscle cells which would tend to deemphasize any intracellular gradients. Also, there is some uncertainty as to the absolute calibration “zero” PO2 endpoint that was determined following flow arrest in the muscles studied – what is the level of residual oxygen in the flow-arrested muscle? If the PO2 did not really fall to 0 mmHg from this calibration intervention, then use of the deoxy-myoglobin signal to quantify PO2 could lead to an underestimate of the true PO2, in part due to the low P50 of myoglobin (~3 mmHg) and uncertainty of its value. Thus, there is some question as to the sensitivity of the MRS approach to detecting intracellular PO2 gradients. An intracellular oxygen probe that provides a signal with high spatial resolution would provide a more definitive resolution of this issue.
The role of myoglobin in muscle has been debated over the years. Is it a readily available reservoir of bound oxygen, a facilitator of oxygen diffusion or possibly a temporary storage depot for NO – or some combination of these functions? The idea of myoglobin acting as a facilitator of oxygen transport was reviewed 40 years ago by Wittenberg (1970). More recently the question of whether myoglobin inside muscle cells has sufficient mobility to allow it to manifest an oxygen carrier role to any significant degree has led to consideration of additional roles for this protein, in particular its function in the regulation of nitric oxide bioavailability (Wittenberg and Wittenberg, 2003). Myoglobin continues to be the subject of intense investigation.
OXYGEN GRADIENTS IN CAPILLARIES
Since Duling showed that PO2 measurements in capillaries were too greatly influenced by the presence of a superfusion solution (Duling & Berne 1970), reliable measurements of oxygen levels in capillaries had to await the extension of haemoglobin spectrophotometry to single RBCs (Ellis et al 1990). The first measurements of SO2 in capillaries demonstrated that there were substantial longitudinal gradients of oxygen in capillaries and that RBC oxygenation was quite heterogeneous (Ellsworth et al 1998). Calculation of oxygen flux from capillaries showed that the results followed the predictions of diffusion theory, in contrast to the order of magnitude discrepancy observed in arterioles (Vadapalli et al 2000). An obvious difference between the two cases is that the issue of luminal distribution of RBCs and SO2 is not relevant for the single file flow of RBCs through capillaries, a clue that perhaps neglect of the luminal distributions of RBCs and SO2 in arterioles is related to the large discrepancy between oxygen flux from arterioles predicted by standard diffusion theory and that calculated from the “centerline” measurements of oxygen saturation, hemoglobin concentration and blood velocity using optical techniques (see Eqs. 1 and 2 above). The use of computer-aided video image analysis in the measurement of SO2, RBC supply rate and RBC velocity in capillaries was advanced by Japee et al (2005a, b) and has been used in recent studies by Ellis et al (2010).
The improved spatial resolution of PQM allowed its application to measurements of PO2 in capillaries (Golub & Pittman 2005). By using the scanning approach to PQM, the longitudinal PO2 gradient in capillaries can be measured.
For over 50 years the intra-luminal resistance to oxygen transport was neglected, but it is far from negligible. Hellums (1977) was the first to recognize the importance of the particulate nature of blood in regard to oxygen transport and he calculated that the fraction of intravascular resistance to oxygen transport in capillaries was about one-half of the total resistance. This resistance is contributed primarily by the low solubility of oxygen in the plasma, and it increases when the plasma gap between RBCs increases. These calculations were extended by Federspiel and Popel (1986) and others. One result from Hellums’ work was the prediction of erythrocyte-associated transients (EATs) or fluctuations in PO2 at a measurement site due to the successive passage of RBCs (high PO2) and plasma gaps (low PO2). The presence of EATs indicates a significant resistance to oxygen transport in the blood. EATs can limit the oxygen supply to tissue because only a portion of the capillary wall is in contact with high PO2 at any given moment. EATs provide two roles for altered capillary hematocrit in determining oxygen transport: (1) altered convective oxygen delivery into capillaries and (2) altered EAT-related diffusional resistance for oxygen transport. The refinement of PQM to provide excellent spatial (~1 μm) and temporal (~10 ms) resolution revealed the reality of EATs. The identification of EATs depends on the use of light transmission (low for RBCs, high for plasma gap) and phosphorescent intensity (low for RBCs, high for plasma gap) to distinguish between the presence of RBCs or plasma in the light beam. An example of simultaneous records containing 100 consecutive points (100 Hz for one second) for measurements of PO2 made in a capillary are shown in Fig. 3.
FIGURE 3.

Demonstration of EATs in capillary of rat spinotrapezius muscle. PO2 fluctuations are due to passage of RBCs and plasma gaps for a period of one second. Upper time course was taken near the entrance to the capillary; lower time course was taken a short time later near the exit of the same capillary. The consistent difference in PO2 values indicates a longitudinal gradient in PO2 along this capillary.
OXYGEN GRADIENTS IN CONTRACTING MUSCLE
Most of the intravital microscopic studies referred to above were limited by technical necessity to quiescent tissues (i.e., lack of movement) and thus represent a limited scope of metabolic rates. One would expect that in a situation where blood flow increases greatly to keep pace with oxygen demand (e.g., muscle contraction) the major site of oxygen exchange would shift from the arterioles (resting conditions) to the capillaries. In the case of skeletal muscle, movement by the tissue during contraction makes it difficult to visualize microvessels except during the brief interval between contractions, thereby limiting the contraction frequency to quite low values (e.g., ≤ 1 Hz). In addition, measurement of PO2 with microelectrodes is difficult since the small tips (~ 1-5 μm diameter) are quite fragile and are subject to breakage during muscle contraction, although Lash and Bohlen (1987) used strengthened, slightly larger electrodes to provide PO2 measurements during contraction. Following the introduction of the phosphorescence quenching method to measure PO2 in the microcirculation (Torres Filho & Intaglietta 1993), there have been more recent investigations of oxygenation in contracting skeletal muscle.
A notable example of studies that have combined measurement of oxygen levels using the frequency domain implementation of phosphorescence quenching (Benhke et al 2001) with video imaging of capillary perfusion (Kindig et al 2002) are those begun by Benhke et al (2002). The frequency domain phosphorescence instrument uses a 2 mm diameter fiber optic bundle containing multiple optical fibers for excitation of the oxygen probe and capture of the phosphorescence emission. The oxygen probe is infused into the circulation where it remains due to its low permeability across microvessel walls. Since a 2 mm diameter region containing a combination of arterioles, capillaries and venules is excited, the detected phosphorescence signal is heterogeneous in PO2 (“microvascular PO2”) with contributions from arterioles, capillaries and venules, weighted approximately according to the volume of blood in these different “compartments.” In recent years these measurements have been extended to include studies on the effects of aging, diabetes and chronic heart failure and their impact on the dynamics of oxygen transport during the onset of muscle contraction. Measurements of this type have contributed to our understanding of the coupling between blood flow and metabolism.
Another issue associated with muscle contraction is whether the functional hyperemia of exercise places any limitation on diffusive oxygen supply to tissue due to the decreased transit time of RBCs through the microcirculation. Lash and Bohlen (1995) measured the oxygen saturation in venules following muscle contraction and found that it was higher in spontaneously hypertensive rats (SHR) compared with Wistar-Kyoto (WKY) controls. Subsequently Smith et al (2004) found that PO2 in venules recovered more slowly in SHR than in WKY rats subjected to the same muscle contraction protocol, suggesting that shorter RBC transit times through the less dense capillary networks of the SHRs (rarefaction of hypertension) limited the ability of haemoglobin to release oxygen under these conditions. Thus, the result of Lash and Bohlen (1995) can be reconciled with the seemingly disparate finding of Smith et al (2004) by considering the possibility of a kinetic mismatch between the release of oxygen by RBC haemoglobin and the rapid transit time of RBCs through the capillaries under some conditions of exercise hyperemia.
CURRENT STATUS OF OXYGEN GRADIENTS IN THE MICROCIRCULATION
This review has emphasized experimental approaches to measuring oxygen in the microcirculation which employ microelectrode technology with superfusion fluids and optical methods (haemoglobin microspectrophotometry and phosphorescence quenching microscopy) with gas permeability barrier films. It has been a long and winding road from August Krogh and his model of a single capillary surrounded by a cylinder of oxygen-consuming tissue to today's realization that oxygen has the ability to diffuse between any sites with an intervening PO2 difference. Thus, Fig. 4 shows oxygen diffusion from a single capillary, but also diffusive interactions between various pairs of microvessels. This conceptual picture of oxygen movement within the microcirculation has been utilized in sophisticated computational models of oxygen transport which consider a wide variety of scenarios for the movement of oxygen (Hellums et al 1996; Popel et al 2003).
FIGURE 4.
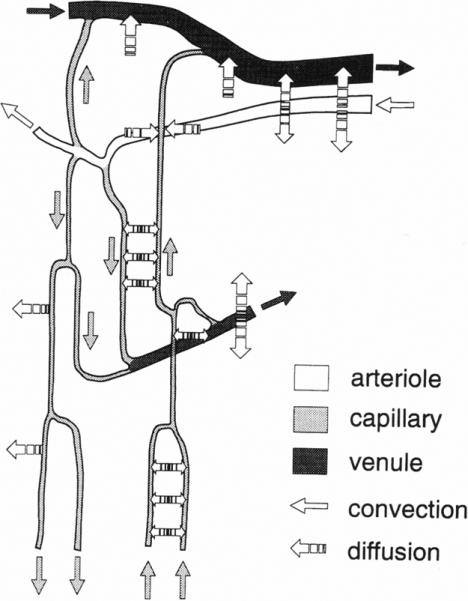
Summary of diffusive interactions for oxygen exchange among arterioles, capillaries and venules (from Ellsworth et al 1994). Used by permission of the American Physiological Society.
ACKNOWLEDGEMENTS
The author thanks the organizers of the August Krogh Symposium 2010 for the opportunity to present a summary of the pioneering work of August Krogh in the area of oxygen transport and its subsequent development to the present day.
The author is pleased to express his grateful appreciation to Dr. Aleksander S. Golub and Dr. Aleksander S. Popel for many discussions over the years which have helped clarify numerous concepts regarding the transport of oxygen in the microcirculation.
The work of the author has been supported by grants HL18292 and HL079087 from the National Heart, Lung and Blood Institute.
Footnotes
CONFLICT OF INTEREST
There are no conflicts of interest.
REFERENCES
- Behnke BJ, Barstow TJ, Kindig CA, McDonough P, Musch TI, Poole DC. Dynamics of oxygen uptake following exercise onset in rat skeletal muscle. Respir Physiol & Neurobiol. 2002;133:229–239. doi: 10.1016/s1569-9048(02)00183-0. [DOI] [PubMed] [Google Scholar]
- Behnke BJ, Kindig CA, Musch TI, Koga S, Poole DC. Dynamics of microvascular oxygen pressure across the rest-exercise transition in rat skeletal muscle. Respir Physiol. 2001;126:53–63. doi: 10.1016/s0034-5687(01)00195-5. [DOI] [PubMed] [Google Scholar]
- Bloch EH. A quantitative study of the hemodynamics in the living microvascular system. Am J Anat. 1962;110:125–153. doi: 10.1002/aja.1001100204. [DOI] [PubMed] [Google Scholar]
- Brown GC. Nitric oxide and mitochondrial respiration. Biochim Biophys Acta. 1999;1411:351–369. doi: 10.1016/s0005-2728(99)00025-0. [DOI] [PubMed] [Google Scholar]
- Carvalho H, Pittman RN. Longitudinal and radial gradients of PO2 in the hamster cheek pouch microcirculation. Microcirculation. 2008;15:215–224. doi: 10.1080/10739680701616175. [DOI] [PubMed] [Google Scholar]
- Crank J. The mathematics of diffusion. Clarendon Press; Oxford: 1956. [Google Scholar]
- Duling BR, Berne RM. Longitudinal gradients in periarteriolar oxygen tension. A possible mechanism for the participation of oxygen in local regulation of blood flow. Circ Res. 1970;27:669–678. doi: 10.1161/01.res.27.5.669. [DOI] [PubMed] [Google Scholar]
- Duling BR, Kuschinsky W, Wahl M. Measurements of the perivascular PO2 in the vicinity of the pial vessels of the cat. Pflugers Arch. 1979;383:29–34. doi: 10.1007/BF00584471. [DOI] [PubMed] [Google Scholar]
- Ellis CG, Ellsworth ML, Pittman RN. Determination of red blood cell oxygenation in vivo by dual video densitometric image analysis. Am J Physiol. 1990;258:H1216–H1223. doi: 10.1152/ajpheart.1990.258.4.H1216. [DOI] [PubMed] [Google Scholar]
- Ellis CG, Goldman D, Hanson M, Stephenson AH, Milkovich S, Benlamri A, Ellsworth ML, Sprague RS. Defects in oxygen supply to skeletal muscle of prediabetic ZDF rats. Am J Physiol Heart Circ Physiol. 2010;298:H1661–H1670. doi: 10.1152/ajpheart.01239.2009. [DOI] [PMC free article] [PubMed] [Google Scholar]
- Ellis CG, Potter RF, Groom AC. The Krogh cylinder geometry is not appropriate for modeling O2 transport in contracted skeletal muscle. Adv Exp Med Biol. 1983;159:253–268. doi: 10.1007/978-1-4684-7790-0_23. [DOI] [PubMed] [Google Scholar]
- Ellsworth M, Ellis C, Popel A, Pittman R. Role of microvessels in oxygen supply to tissue. News Physiol Sci. 1994;9:119–123. doi: 10.1152/physiologyonline.1994.9.3.119. [DOI] [PMC free article] [PubMed] [Google Scholar]
- Ellsworth ML, Pittman RN. Arterioles supply oxygen to capillaries by diffusion as well as by convection. Am J Physiol. 1990;258:H1240–H1243. doi: 10.1152/ajpheart.1990.258.4.H1240. [DOI] [PubMed] [Google Scholar]
- Ellsworth ML, Pittman RN. Evaluation of photometric methods for quantifying convective mass transport in microvessels. Am J Physiol. 1986;251:H869–H879. doi: 10.1152/ajpheart.1986.251.4.H869. [DOI] [PubMed] [Google Scholar]
- Ellsworth ML, Popel AS, Pittman RN. Assessment and impact of heterogeneities of convective oxygen transport parameters in capillaries of striated muscle: experimental and theoretical. Microvasc Res. 1988;35:341–362. doi: 10.1016/0026-2862(88)90089-1. [DOI] [PMC free article] [PubMed] [Google Scholar]
- Federspiel WJ, Popel AS. A theoretical analysis of the effect of the particulate nature of blood on oxygen release in capillaries. Microvasc Res. 1986;32:164–189. doi: 10.1016/0026-2862(86)90052-x. [DOI] [PMC free article] [PubMed] [Google Scholar]
- Golub AS, Pittman RN. Erythrocyte-associated transients in PO2 revealed in capillaries of rat mesentery. Am J Physiol Heart Circ Physiol. 2005;288:H2735–H2743. doi: 10.1152/ajpheart.00711.2004. [DOI] [PubMed] [Google Scholar]
- Golub AS, Pittman RN. Recovery of radial PO2 profiles from phosphorescence quenching measurements in microvessels. Comp Biochem Physiol A Mol Integr Physiol. 2002;132:169–176. doi: 10.1016/s1095-6433(01)00544-x. [DOI] [PubMed] [Google Scholar]
- Golub AS, Pittman RN. PO2 measurements in the microcirculation using phosphorescence quenching microscopy at high magnification. Am J Physiol Heart Circ Physiol. 2008;294:H2905–H2916. doi: 10.1152/ajpheart.01347.2007. [DOI] [PubMed] [Google Scholar]
- Golub AS, Barker MC, Pittman RN. PO2 profiles near arterioles and tissue oxygen consumption in the rat mesentery. Am J Physiol Heart Circ Physiol. 2007;293:H1097–H1106. doi: 10.1152/ajpheart.00077.2007. [DOI] [PubMed] [Google Scholar]
- Golub AS, Popel AS, Zheng L, Pittman RN. Analysis of phosphorescence decay in heterogeneous systems: consequences of finite excitation flash duration. Photochem Photobiol. 1999;69:624–632. [PubMed] [Google Scholar]
- Golub AS, Popel AS, Zheng L, Pittman RN. Analysis of phosphorescence in heterogeneous systems using distributions of quencher concentration. Biophys J. 1997;73:452–465. doi: 10.1016/S0006-3495(97)78084-6. [DOI] [PMC free article] [PubMed] [Google Scholar]
- Golub AS, Tevald MA, Pittman RN. Phosphorescence quenching micro-respirometry of skeletal muscle in situ. Am J Physiol Heart Circ Physiol. 2011;300:H–H. doi: 10.1152/ajpheart.00626.2010. [DOI] [PMC free article] [PubMed] [Google Scholar]
- Hellums JD. The resistance to oxygen transport in the capillaries relative to that in the surrounding tissue. Microvasc Res. 1977;13:131–136. doi: 10.1016/0026-2862(77)90122-4. [DOI] [PubMed] [Google Scholar]
- Hellums JD, Nair PK, Huang NS, Ohshima N. Simulation of intraluminal gas transport processes in the microcirculation. Ann Biomed Eng. 1996;24:1–24. doi: 10.1007/BF02770991. [DOI] [PubMed] [Google Scholar]
- Hill AV. The diffusion of oxygen and lactic acid through tissues. Proc Roy Soc Ser B. 1928;104:39–96. [Google Scholar]
- Honig CR, Gayeski TE. Comparison of intracellular PO2 and conditions for blood-tissue O2 transport in heart and working red skeletal muscle. Adv Exp Med Biol. 1987;215:309–321. doi: 10.1007/978-1-4684-7433-6_36. [DOI] [PubMed] [Google Scholar]
- Ivanov KP, Derry AN, Vovenko EP, Samoilov MO, Semionov DG. Direct measurements of oxygen tension at the surface of arterioles, capillaries and venules of the cerebral cortex. Pflugers Arch. 1982;393:118–120. doi: 10.1007/BF00582403. [DOI] [PubMed] [Google Scholar]
- Japee SA, Pittman RN, Ellis CG. A new video image analysis system to study red blood cell dynamics and oxygenation in capillary networks. Microcirculation. 2005a;12:489–506. doi: 10.1080/10739680591003332. [DOI] [PubMed] [Google Scholar]
- Japee SA, Pittman RN, Ellis CG. Automated method for tracking individual red blood cells within capillaries to compute velocity and oxygen saturation. Microcirculation. 2005b;12:507–515. doi: 10.1080/10739680591003341. [DOI] [PubMed] [Google Scholar]
- Kindig CA, Richardson TE, Poole DC. Skeletal muscle capillary hemodynamics from rest to contractions: implications for oxygen transfer. J Appl Physiol. 2002;92:2513–2520. doi: 10.1152/japplphysiol.01222.2001. [DOI] [PubMed] [Google Scholar]
- Kobayashi H, Takizawa N. Imaging of oxygen transfer among microvessels of rat cremaster muscle. Circulation. 2002;105:1713–1719. doi: 10.1161/01.cir.0000013783.63773.8f. [DOI] [PubMed] [Google Scholar]
- Krogh A. The Anatomy and Physiology of Capillaries. Hafner Publishing; New York: 1959. [Google Scholar]
- Krogh A. The rate of diffusion of gases through animal tissues with some remarks on the coefficient of invasion. J Physiol. 1919a;52:391–408. doi: 10.1113/jphysiol.1919.sp001838. [DOI] [PMC free article] [PubMed] [Google Scholar]
- Krogh A. The number and distribution of capillaries in muscles with calculations of the oxygen pressure head necessary for supplying the tissue. J Physiol. 1919b;52:409–415. doi: 10.1113/jphysiol.1919.sp001839. [DOI] [PMC free article] [PubMed] [Google Scholar]
- Kuo L, Pittman RN. Effect of hemodilution on oxygen transport in arteriolar networks of hamster striated muscle. Am J Physiol. 1988;254:H331–339. doi: 10.1152/ajpheart.1988.254.2.H331. [DOI] [PubMed] [Google Scholar]
- Kuo L, Pittman RN. Influence of hemoconcentration on arteriolar oxygen transport in hamster striated muscle. Am J Physiol. 1990;259:H1694–1702. doi: 10.1152/ajpheart.1990.259.6.H1694. [DOI] [PubMed] [Google Scholar]
- Lash JM, Bohlen HG. Perivascular and tissue PO2 in contracting rat spinotrapezius muscle. Am J Physiol. 1987;252:H1192–1202. doi: 10.1152/ajpheart.1987.252.6.H1192. [DOI] [PubMed] [Google Scholar]
- Lash JM, Bohlen HG. Excess oxygen delivery during muscle contractions in spontaneously hypertensive rats. J Appl Physiol. 1995;78:101–111. doi: 10.1152/jappl.1995.78.1.101. [DOI] [PubMed] [Google Scholar]
- Lipowsky HH, Usami S, Chien S, Pittman RN. Hematocrit determination in small bore tubes by differential spectrophotometry. Microvasc Res. 1982;24:42–55. doi: 10.1016/0026-2862(82)90041-3. [DOI] [PubMed] [Google Scholar]
- Molé PA, Chung Y, Tran TK, Sailasuta N, Hurd R, Jue T. Myoglobin desaturation with exercise intensity in human gastrocnemius muscle. Am J Physiol Reg Integ Comp Physiol. 1999;277:R173–R180. doi: 10.1152/ajpregu.1999.277.1.R173. [DOI] [PubMed] [Google Scholar]
- Pittman RN. Influence of microvascular architecture on oxygen exchange in skeletal muscle. Microcirculation. 1995;2:1–18. doi: 10.3109/10739689509146755. [DOI] [PubMed] [Google Scholar]
- Pittman RN, Duling BR. A new method for the measurement of percent oxyhemoglobin. J Appl Physiol. 1975a;38:315–320. doi: 10.1152/jappl.1975.38.2.315. [DOI] [PubMed] [Google Scholar]
- Pittman RN, Duling BR. Measurement of percent oxyhemoglobin in the microvasculature. J Appl Physiol. 1975b;38:321–327. doi: 10.1152/jappl.1975.38.2.321. [DOI] [PubMed] [Google Scholar]
- Pittman RN, Duling BR. Effects of altered carbon dioxide tension on hemoglobin oxygenation in hamster cheek pouch microvessels. Microvasc Res. 1977;13:211–224. doi: 10.1016/0026-2862(77)90086-3. [DOI] [PubMed] [Google Scholar]
- Pittman RN, Golub AS, Popel AS, Zheng L. Interpretation of phosphorescence quenching measurements made in the presence of oxygen gradients. Adv Exp Med Biol. 1998;454:375–383. doi: 10.1007/978-1-4615-4863-8_45. [DOI] [PubMed] [Google Scholar]
- Popel AS. Theory of oxygen transport to tissue. Crit Rev Biomed Eng. 1989;17:257–321. [PMC free article] [PubMed] [Google Scholar]
- Popel AS, Goldman D, Vadapalli A. Modeling of oxygen diffusion from the blood vessels to intracellular organelles. Adv Exp Med Biol. 2003;530:485–495. doi: 10.1007/978-1-4615-0075-9_46. [DOI] [PubMed] [Google Scholar]
- Popel AS, Pittman RN, Ellsworth ML. Rate of oxygen loss from arterioles is an order of magnitude higher than expected. Am J Physiol. 1989;256:H921–924. doi: 10.1152/ajpheart.1989.256.3.H921. [DOI] [PubMed] [Google Scholar]
- Richardson RS, Noyszewski EA, Kendrick KF, Leigh JS, Wagner PD. Myoglobin O2 desaturation during exercise. Evidence of limited O2 transport. J Clin Invest. 1995;96:1916–1926. doi: 10.1172/JCI118237. [DOI] [PMC free article] [PubMed] [Google Scholar]
- Secomb TW, Hsu R. Simulation of O2 transport in skeletal muscle: diffusive exchange between arterioles and capillaries. Am J Physiol. 1994;267:H1214–H1221. doi: 10.1152/ajpheart.1994.267.3.H1214. [DOI] [PubMed] [Google Scholar]
- Sharan M, Vovenko EP, Vadapalli A, Popel AS, Pittman RN. Experimental and theoretical studies of oxygen gradients in rat pial microvessels. J. Cereb. Blood Flow Metab. 2008;28:1597–1604. doi: 10.1038/jcbfm.2008.51. [DOI] [PMC free article] [PubMed] [Google Scholar]
- Shibata M, Ichioka S, Ando J, Kamiya A. Microvascular and interstitial PO(2) measurements in rat skeletal muscle by phosphorescence quenching. J Appl Physiol. 2001;91:321–327. doi: 10.1152/jappl.2001.91.1.321. [DOI] [PubMed] [Google Scholar]
- Smith LM, Barbee RW, Ward KR, Pittman RN. Prolonged tissue PO2 reduction after contraction in spinotrapezius muscle of spontaneously hypertensive rats. Am J Physiol Heart Circ Physiol. 2004;287:H401–H407. doi: 10.1152/ajpheart.00980.2002. [DOI] [PubMed] [Google Scholar]
- Stainsby WN, Otis AB. Blood flow, blood oxygen tension, oxygen uptake, and oxygen transport in skeletal muscle. Am J Physiol. 1964;206:858–866. doi: 10.1152/ajplegacy.1964.206.4.858. [DOI] [PubMed] [Google Scholar]
- Sullivan SM, Pittman RN. In vitro O2 uptake and histochemical fiber type of resting hamster muscles. J Appl Physiol. 1984;57:246–253. doi: 10.1152/jappl.1984.57.1.246. [DOI] [PubMed] [Google Scholar]
- Swain DP, Pittman RN. Oxygen exchange in the microcirculation of hamster retractor muscle. Am J Physiol. 1989;256:H247–H255. doi: 10.1152/ajpheart.1989.256.1.H247. [DOI] [PubMed] [Google Scholar]
- Tateishi N, Suzuki Y, Tanaka J, Maeda N. Imaging of oxygen saturation and distribution of erythrocytes in microvessels. Microcirculation. 1997;4:403–412. doi: 10.3109/10739689709146804. [DOI] [PubMed] [Google Scholar]
- Torres Filho IP, Intaglietta M. Microvessel PO2 measurements by phosphorescence decay method. Am J Physiol. 1993;265:H1434–H1438. doi: 10.1152/ajpheart.1993.265.4.H1434. [DOI] [PubMed] [Google Scholar]
- Torres Filho IP, Kerger H, Intaglietta M. pO2 measurements in arteriolar networks. Microvasc Res. 1996;51:202–212. doi: 10.1006/mvre.1996.0021. [DOI] [PubMed] [Google Scholar]
- Tsai AG, Friesenecker B, Mazzoni MC, Kerger H, Buerk DG, Johnson PC, Intaglietta M. Microvascular and tissue oxygen gradients in the rat mesentery. Proc Natl Acad Sci U S A. 1998;95:6590–6595. doi: 10.1073/pnas.95.12.6590. [DOI] [PMC free article] [PubMed] [Google Scholar]
- Tsai AG, Johnson PC, Intaglietta M. Oxygen gradients in the microcirculation. Physiol Rev. 2003;83:933–963. doi: 10.1152/physrev.00034.2002. [DOI] [PubMed] [Google Scholar]
- Tsai AG, Cabrales P, Johnson PC, Intaglietta M, Golub AS, Pittman RN. Effect of oxygen consumption by measuring method on PO2 transients associated with the passage of erythrocytes in capillaries of rat mesentery. Am. J. Physiol. Heart Circ. Physiol. 2005;289:H1777–H1779. doi: 10.1152/ajpheart.00503.2005. [DOI] [PubMed] [Google Scholar]
- Vadapalli A, Pittman RN, Popel AS. Estimating oxygen transport resistance of the microvascular wall. Am J Physiol Heart Circ Physiol. 2000;279:H657–H671. doi: 10.1152/ajpheart.2000.279.2.H657. [DOI] [PubMed] [Google Scholar]
- Vanderkooi JM, Maniara G, Green TJ, Wilson DF. An optical method for measurement of dioxygen concentration based upon quenching of phosphorescence. J Biol Chem. 1987;262:5476–5482. [PubMed] [Google Scholar]
- Voter WA, Gayeski TE. Determination of myoglobin saturation of frozen specimens using a reflecting cryospectrophotometer. Am J Physiol. 1995;269:H1328–H1341. doi: 10.1152/ajpheart.1995.269.4.H1328. [DOI] [PubMed] [Google Scholar]
- Whalen WJ, Riley J, Nair P. A microelectrode for measuring intracellular PO2. J Appl Physiol. 1967;23:798–801. doi: 10.1152/jappl.1967.23.5.798. [DOI] [PubMed] [Google Scholar]
- Wiederhielm CA. Continuous recording of arteriolar dimensions with a television microscope. J Appl Physiol. 1963;18:1041–1042. doi: 10.1152/jappl.1963.18.5.1041. [DOI] [PubMed] [Google Scholar]
- Wittenberg JB. Myoglobin-facilitated oxygen diffusion: role of myoglobin in oxygen entry into muscle. Physiol Rev. 1970;50:559–636. doi: 10.1152/physrev.1970.50.4.559. [DOI] [PubMed] [Google Scholar]
- Wittenberg JB, Wittenberg BA. Myoglobin function reassessed. J Exp Biol. 2003;206:2011–2020. doi: 10.1242/jeb.00243. [DOI] [PubMed] [Google Scholar]