

Summary
CsrA protein regulates important cellular processes by binding to target mRNAs and altering their translation and/or stability. In Escherichia coli, CsrA binds to sRNAs, CsrB and CsrC, which sequester CsrA and antagonize its activity. Here, mRNAs for relA, spoT and dksA of the stringent response system were found among 721 different transcripts that copurified with CsrA. Many of the transcripts that copurified with CsrA were previously determined to respond to ppGpp and/or DksA. We examined multiple regulatory interactions between the Csr and stringent response systems. Most importantly, DksA and ppGpp robustly activated csrB/C transcription (10-fold), while they modestly activated csrA expression. We propose that CsrA-mediated regulation is relieved during the stringent response. Gel shift assays confirmed high affinity binding of CsrA to relA mRNA leader and weaker interactions with dksA and spoT. Reporter fusions, qRT-PCR, and immunoblotting showed that CsrA repressed relA expression, and (p)ppGpp accumulation during stringent response was enhanced in a csrA mutant. CsrA had modest to negligible effects on dksA and spoT expression. Transcription of dksA was negatively autoregulated via a feedback loop that tended to mask CsrA effects. We propose that the Csr system fine-tunes the stringent response and discuss biological implications of the composite circuitry.
Keywords: CsrA, stringent response, ppGpp, global networks, regulatory systems
Introduction
Bacteria utilize genetic regulatory mechanisms to adapt, compete and survive in response to changing environmental and physiological conditions. Moreover, global regulatory networks permit bacteria to coordinate expression of large sets of genes in multiple operons (Gottesman, 1984; Beisel and Storz, 2010). Two global regulatory networks, Csr (carbon storage regulator) and stringent response, provide mechanisms for sensing end products of carbon metabolism and nutrient availability, and regulating translation and transcription, respectively (Babitzke and Romeo, 2007; Chavez et al., 2010; Potrykus and Cashel, 2008).
CsrA (and its orthologs, RsmA/E) is a small, dimeric RNA binding protein that post-transcriptionally coordinates expression of a diverse set of genes by positively or negatively regulating the translation and/or stability of target transcripts. In this way, CsrA activates exponential phase processes while repressing several stationary phase functions (Babitzke and Romeo, 2007). CsrA is widely distributed among eubacteria (White et al., 1996; Mercante et al., 2006) and regulates expression of genes for virulence factors (Fortune et al., 2006; Bhatt et al., 2009), quorum sensing (Cui et al., 1995; Lenz et al., 2005), motility (Wei et al., 2001; Yakhnin et al., 2007), carbon metabolism (Romeo et al., 1993; Sabnis et al., 1995; Yang et al., 1996), biofilm formation (Jackson et al., 2002; Wang et al., 2005), cyclic di-GMP synthesis (Jonas et al., 2008) and peptide uptake (Dubey et al., 2003).
CsrA directly regulates gene expression by interacting with the 5’ untranslated leaders of target mRNAs at sites characterized by a GGA sequence, which is often located within the loop of a short stem-loop structure (Liu et al., 1997; Dubey et al., 2005; Schubert et al., 2007). CsrA typically represses translation initiation by binding to sites that overlap the Shine-Dalgarno sequence (SD), thus competing with the 30S ribosomal subunit and accelerating mRNA degradation (Liu and Romeo, 1997; Baker et al., 2002; Dubey et al., 2003; Babitzke et al., 2009). CsrA can also activate gene expression by stabilizing a bound transcript, as exemplified by the E. coli flhDC mRNA (Wei et al., 2001).
The E. coli Csr system includes other important regulatory components. CsrB and CsrC are noncoding RNAs that contain multiple CsrA binding sites, which permit them to sequester and antagonize CsrA (Liu et al., 1997; Weilbacher et al., 2003). In a negative feedback loop, CsrA is indirectly required for transcription of these sRNAs, which are directly activated by the two-component signal transduction system (TCS), BarA-UvrY (Suzuki et al., 2002; Weilbacher et al., 2003). Recently, acetate was identified as a physiological stimulus for BarA-dependent signaling (Chavez et al., 2010). Because CsrA activates glycolysis (Sabnis et al., 1995), a major source of acetate, this metabolic pathway was hypothesized to be a possible link for CsrA effects on csrB/C transcription. However, results from the present study do not support this hypothesis. CsrA represses csrD, encoding a GGDEF-EAL domain protein, which functions along with RNase E and PNPase to mediate CsrB/C turnover (Suzuki et al., 2006).
The stringent response defines another global regulatory network of eubacteria. It is characterized by a rapid downshift in synthesis of stable RNAs, such as rRNA and tRNA, and the upregulation of a number of operons, such as those for amino acid biosynthesis, in response to starvation for amino acids or other nutrients (Potrykus and Cashel, 2008). The effector of this response is the nucleotide secondary messenger guanosine tetraphosphate (ppGpp) (Cashel and Gallant, 1969), which binds to RNA polymerase and positively or negatively affects transcription, depending upon promoter characteristics (Barker et al., 2001). In E. coli, ppGpp levels are regulated by two enzymes: RelA and SpoT. In response to the presence of uncharged tRNA in the ribosomal A-site, RelA synthesizes pppGpp, which is converted to ppGpp, collectively referred to as (p)ppGpp (Wendrich et al., 2002). SpoT is a bifunctional synthetase/hydrolase, which exhibits weak ppGpp synthetase activity and serves primarily to degrade ppGpp (Cashel et al., 1996). However, SpoT synthesizes ppGpp in response to carbon starvation (Cashel et al., 1996), fatty acid starvation (Seyfzadeh et al., 1993; Gong et al., 2002) and other stresses, such as iron limitation (Vinella et al., 2005).
In most cases, regulation by ppGpp requires the transcription factor DksA (Paul et al., 2004; Paul et al., 2005), which interacts with the secondary channel of RNA polymerase (Paul et al., 2004; Perederina et al., 2004). Together, ppGpp and DksA regulate the expression or activity of a number of global regulators, including the stationary phase sigma factor RpoS (Brown et al., 2002), the extracytoplasmic sigma factor RpoE (Costanzo et al., 2008) and the master regulator of the motility cascade, FlhD4C2 (Lemke et al., 2009).
Here, we used a high throughput sequencing approach to screen for novel, direct targets of CsrA regulation. Our results suggest a greatly expanded global regulatory role for CsrA. Among the transcripts identified were relA, spoT and dksA, which encode proteins involved in the stringent response, along with numerous RNAs for ppGpp-responsive genes. A reporter system designed to monitor post-transcriptional regulation and other approaches revealed complex regulatory interactions between the Csr and stringent response systems. The strong positive effects of ppGpp and DksA on csrB/C transcription and negative effects of CsrA on relA expression and (p)ppGpp accumulation during stringent response were notable. We present and discuss a model for this composite circuitry and its biological implications.
Results
Screening for novel targets of CsrA binding
Several studies suggest that CsrA orthologs regulate expression of a large number of transcripts (Lawhon et al., 2003; Burrowes et al., 2006; Brencic and Lory, 2009). Data from these studies were primarily derived from transcriptome analyses, which in large part, did not exclude effects of indirect regulation or examine expression from intergenic regions. To screen for putative direct targets of CsrA binding, recombinant His-tagged CsrA (CsrA-His6) was ectopically expressed and purified from a csrA csrB csrC triple mutant. RNA that was noncovalently bound to CsrA-His6 was isolated, converted to cDNA, and analyzed by 454 sequencing (Margulies et al., 2005). The methods, results, and validation studies for this screen are provided in the online Supporting Information. While our screen was not saturated, this analysis suggested that CsrA binds to the RNAs of at least 721 genes (Tables S1, S2), representing many fundamental physiological and regulatory processes, including the stringent response. An additional screen for targets of CsrA regulation compared proteins from csrA mutant and wild-type strains, harvested from four growth conditions, and analyzed by two-dimensional PAGE and MALDI-ToF/ToF mass spectrometry (Table S3). Several of the abundant proteins that varied among the csrA mutant and wild type strains were expressed from mRNAs that copurified with CsrA (Table S4), suggesting the directionality of CsrA-mediated regulation for these genes.
Analysis of csrA binding to relA and dksA mRNA leaders
Because CsrA-His6 copurified with relA, spoT, and dksA mRNAs, we began by testing these binding interactions in vitro. The relA leader contains six putative CsrA binding sites, while dksA contains two (Fig. 1A). Gel shift assays with CsrA protein and in vitro synthesized transcripts containing the 5’ untranslated region and part of the coding region of relA (−178 nt to +22 relative to the start of translation) or dksA (−54 nt to +10 nt relative to the start of translation) revealed initial binding at 5 to 10 nM CsrA for relA and at 10 nM CsrA for dksA (Fig. 1C, E). As the CsrA concentration was increased, additional shifted species were observed for the CsrA-relA interaction, suggesting that multiple CsrA proteins were bound to each relA transcript. A nonlinear least-squares analysis of these data yielded apparent Kd values of 17 ± 1 nM CsrA for relA and 66 ± 4 nM CsrA for dksA.
Fig. 1.
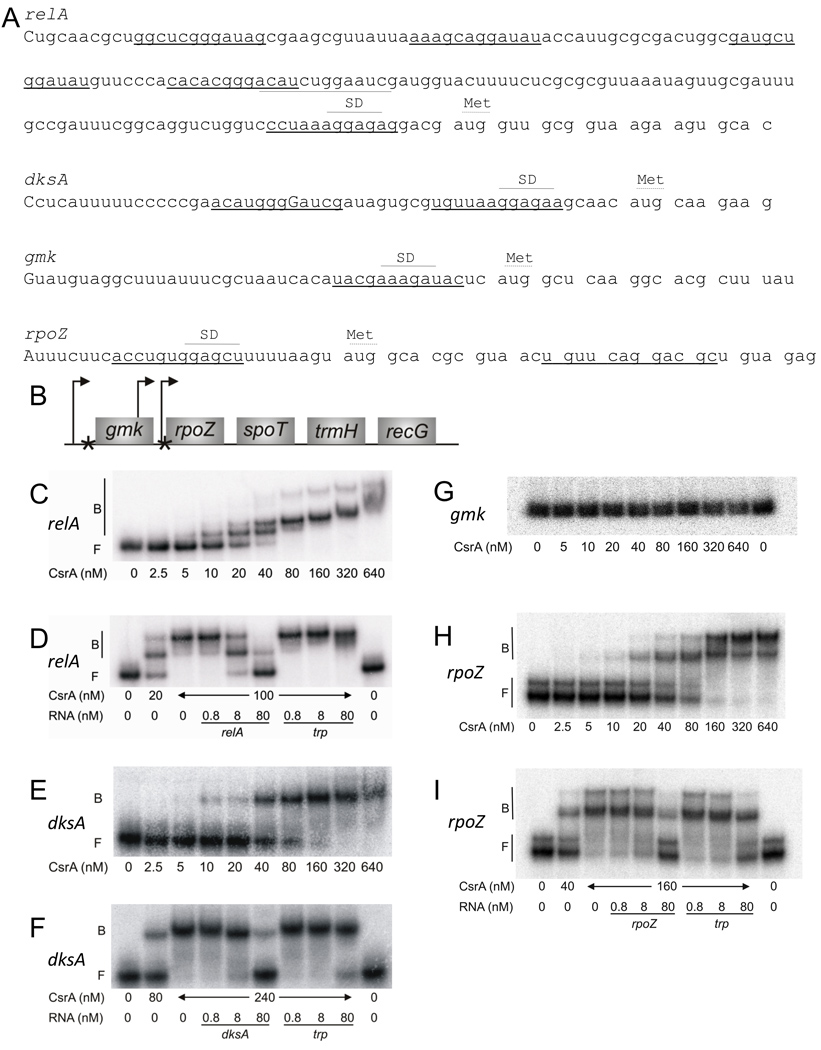
Gel shift analyses of CsrA binding to mRNA leaders of relA, dksA, gmk and rpoZ. (A) The nucleotide sequences of relA, gmk, rpoZ and dksA mRNA leaders are shown with putative CsrA binding sites underlined. Positions of the experimentally determined transcriptional starts are depicted as capital letters, and positions of the Shine-Dalgarno (SD) sequences and initiation codons (Met) are shown. (B) The structure of the spo operon; arrows denote promoters while asterisks indicate potential CsrA binding sites. (C-I) RNA gel shifts: 5’-end-labeled transcripts (80 pM) were incubated with CsrA at the concentration indicated below each lane. Reactions were performed in the absence (C, E, G and H) or presence (D, F and I) of specific or nonspecific (trp from B. subtilis) unlabeled RNA competitors, at the concentrations shown. The positions of free (F) and bound (B) RNA are shown. (C, D) CsrA-relA interactions. (E, F) CsrA-dksA interactions. (G) CsrA-gmk interaction. (H, I) CsrA-rpoZ interaction.
Competition experiments with specific (relA and dksA) and nonspecific (Bacillus subtilis trp leader) unlabeled RNAs confirmed that CsrA binds to the relA mRNA leader with high affinity and specificity (Fig. 1D), while dksA RNA binding exhibited weak competition by the B. subtilis trp leader RNA (Fig. 1F). Thus, the binding affinity and specificity of the CsrA-dksA RNA interaction are not as strong.
Analyses of csrA binding to gmk and rpoZ mRNA leaders
spoT is located within the five gene spo operon, gmk-rpoZ-spoT-trmH-recG, which is transcribed by three mapped promoters (Gentry et al., 1993; Fig. 1B). A possible CsrA binding site, with modest sequence similarity to consensus, overlaps the gmk SD sequence, and two putative CsrA binding sites are present in rpoZ, one of which overlaps the SD sequence (Fig. 1A, B). RNA gel shift assays with 5’ untranslated leader and part of the coding region of gmk (−42 nt to +25 nt relative to the start of translation) or rpoZ (−28 nt to +33 nt relative to the start of translation) revealed that CsrA did not interact with the gmk transcript (Fig. 1G) but bound to the rpoZ transcript, beginning at 5 to 10 nM CsrA and resulting in an apparent Kd value of 66 ± 4 nM (Fig. 1H). Unlabeled rpoZ RNA competed effectively for the CsrA-rpoZ interaction (Fig. 1I). trp leader RNA was also able to compete, although not as effectively as rpoZ RNA (Fig. 1I), implying that CsrA interacts with modest specificity to the rpoZ transcript.
Effects of csrA on relA expression
To examine relA expression, β-galactosidase specific activity from a chromosomal relA’-‘lacZ translational fusion containing the upstream non-coding region through the first three codons (−880 nt to +11 nt relative to the start of translation) was monitored in wild-type and csrA mutant strains. Disruption of csrA increased expression ~40%, which was reversed by ectopic complementation (Fig. 2A). Two promoters driving relA transcription (P1 from −178 nt; P2 from −626 nt) have been mapped (Metzger et al., 1988; Nakagawa et al., 2006). In contrast to the translational fusion, expression from a transcriptional fusion containing the upstream non-coding region through the upstream transcriptional start of relA (−880 nt to −626 nt) was unaltered by the csrA mutation (Fig. 2B). We also constructed post-transcriptional reporter fusions for relA, in which the constitutive lacUV5 promoter replaced the native promoters (P1, −178 nt to +11 nt; P2, −626 nt to +11 nt). Expression from both fusions, including the P1 replacement, which did not contain relA promoter DNA, was increased ~30% in the csrA mutant versus the wild-type strain as the cultures approached the stationary phase of growth (Fig. 2C). These data indicate that CsrA represses relA expression post-transcriptionally via the 5’ untranslated segment of the relA mRNA.
Fig. 2.
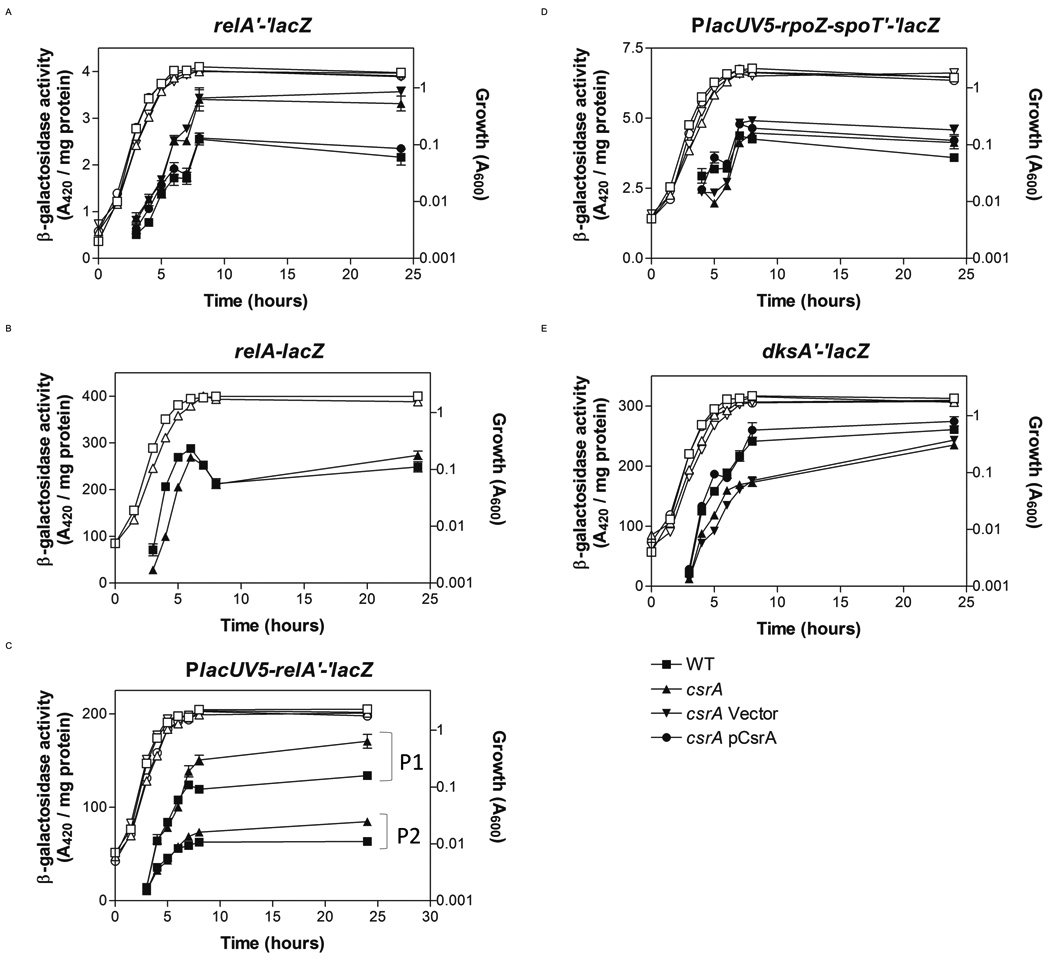
Effects of csrA on expression of relA, spoT and dksA reporter fusions. Cells were harvested at various times throughout growth and assayed for β-galactosidase specific activity (A420 / mg protein). The values represent the average of two independent experiments. Error bars depict standard error of the mean. (A–E) Activity of indicated fusions in wild-type, ■; csrA, ▲; csrA pGB2 (empty vector), ▼; and csrA pCsrA (csrA+), ●. (E) Strain identities were identical, except pBR322 (empty vector, ▼) and pCRA16 (csrA+, ●) were used for complementation. Growth curves are represented by corresponding open symbols.
Effects of csrA on spoT and dksA expression
In contrast, CsrA had little to no effect on the expression of a PlacUV5-rpoZ-spoT’-‘lacZ leader fusion (Fig. 2D). Translational fusions for gmk, rpoZ or spoT, containing the native promoters and ribosome binding sites, produced extremely low levels of β-galactosidase and were not quantified. Finally, expression of the dksA’-‘lacZ fusion was slightly decreased in the csrA mutant (up to ~30% at the transition to stationary phase), and was complemented by ectopic expression of csrA (Fig. 2E), suggesting that CsrA activates dksA expression. This effect is examined in more detail below.
Effects of csrA on relA, spoT and dksA steady-state transcript levels
Because CsrA frequently affects the stability and steady-state levels of its target RNAs (Liu et al., 1995; Wei et al., 2001; Wang et al., 2005), quantitative real-time reverse transcription polymerase chain reactions (rt-qRT-PCR) were performed on relA, spoT and dksA transcripts. In the csrA mutant, relA mRNA was increased 1.4-fold in exponential phase (OD600 = ~0.5), and 2.0-fold in stationary phase (Fig. 3A), suggesting that repression of relA involves an alteration in mRNA levels. While the spoT leader fusion showed no change (Fig. 2D), steady-state transcript levels of spoT RNA in the csrA mutant were increased 1.5-fold in exponential phase and 1.8-fold in stationary phase (Fig. 3A). Because CsrA did not affect expression of the spoT leader fusion, its effects on spoT transcript levels may be mediated indirectly. dksA transcript levels remained unchanged between the csrA mutant and wild type strains (Fig. 3A).
Fig. 3.
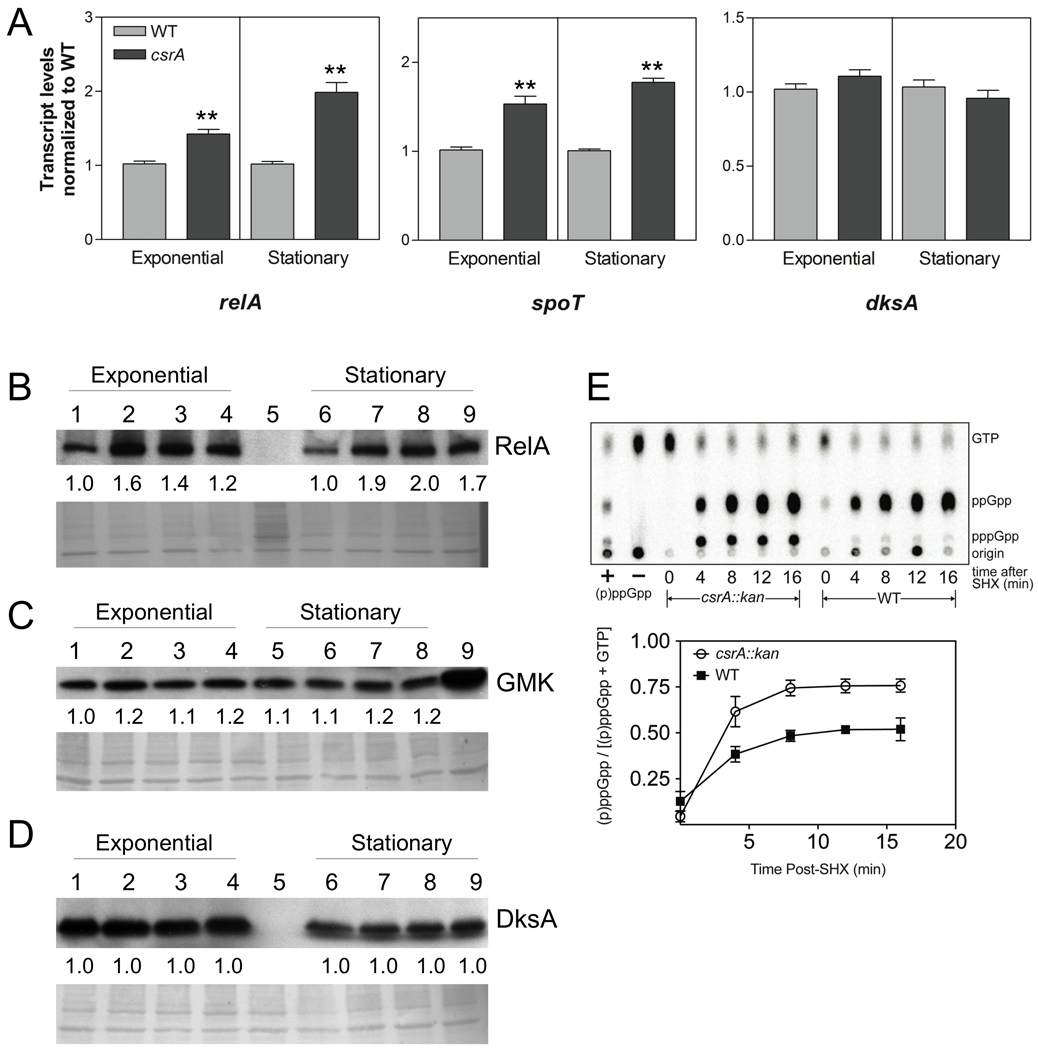
Effects of csrA on relA, spoT and dksA transcripts, gene products, and (p)ppGpp levels during stringent response. (A) Samples of MG1655 (WT) and TRMG1655 (csrA::kan) were taken for RNA isolation at exponential phase (OD600 = 0.5) and stationary phase (at 8 hours of growth), and RNA samples were analyzed by rt-qRT-PCR. The values represent the average of two independent experiments. Error bars depict standard error of the mean (** P < 0.001). (B–D) Effects of csrA disruption and complementation on RelA, GMK and DksA protein levels by Western blotting. Shown below each representative blot, the PVDF membrane was stained using the MemCode™ Reversible Protein Stain Kit (Pierce Biotechnology, Rockford, IL) and imaged as a loading control. Protein was harvested at exponential (OD600 = 0.5) and stationary phases (after 8 hours of growth). (B) RelA; Lane 1,6 MG1655; Lane 2,7 csrA::kan; Lane 3,8 csrA::kan pGB2; Lane 4,9 csrA::kan pCsrA; Lane 5, relA::kan spoT::cat. (C) GMK; Lane 1,5 MG1655; Lane 2,6 csrA::kan; Lane 3,7 csrA::kan pGB2; Lane 4,8 csrA::kan pCsrA; and Lane 9, CF80005 (pGMK). (D) DksA; Lane 1,6 MG1655; Lane 2,7 csrA::kan; Lane 3,8 csrA::kan pGB2; Lane 4,9 csrA::kan pCsrA; Lane 5, dksA::kan. Fold differences in protein levels (relative to wild-type) represent the average of three independent experiments. The standard deviation for all values was less than 10% from the mean. (E) Determination of CsrA effects on (p)ppGpp accumulation during stringent response. MG1655 (wild-type) and csrA::kan strains were grown to mid-logarithmic phase, treated with serine hydroxamate (SHX) (200 µg ml−1) to induce the stringent response, and nucleotides were labeled and analyzed by thin-layer chromatography (TLC) as described in Experimental Procedures. The upper panel depicts phosphorimaging of the TLC plate, the lower panel depicts the ratio of (p)ppGpp to guanine nucleotides [(p)ppGpp and GTP)] for the wild-type and csrA mutant strains. These values represent the averages of three independent experiments. Error bars depict the standard errors of the means.
RelA protein accumulates in a csrA mutant while GMK and DksA remain unchanged
Western blotting (Fig. 3B) revealed that RelA was increased by the csrA mutation in mid-exponential (1.6-fold) and stationary phases (1.9-fold), similar to effects obtained with the reporter fusions (Fig. 2A, C) and the rt-qRT-PCR analysis (Fig. 3A). GMK, the product of the first gene of the spoT operon, and DksA were unchanged in the csrA mutant (Fig. 3C and D). A possible explanation for this result is that while CsrA binds to dksA mRNA and modestly activates dksA expression, other factor(s) might compensate for these effects. Western analyses of SpoT protein levels were inconclusive, due to technical problems caused by a cross reacting product (data not shown).
csrA represses (p)ppGpp accumulation during stringent response
CsrA bound specifically to the relA mRNA leader and repressed relA expression (Figs. 1C, D, 2A–C, 3A, B). To assess the biological relevance of these effects, we monitored (p)ppGpp levels in csrA mutant and wild-type strains during induction of the stringent response by serine hydroxamate (SHX) treatment (Fig. 3E). The levels of (p)ppGpp upon SHX treatment were elevated ~1.5-fold in the csrA mutant relative to the wild-type strain, indicating that negative regulation of relA expression by CsrA downregulates the stringent response.
DksA regulates its own transcription
Because CsrA bound to dksA mRNA and a dksA’-‘lacZ fusion responded modestly to CsrA, yet dksA transcript and protein levels were similar in the csrA mutant and wild-type strains, we sought to more carefully monitor the influence of CsrA on dksA expression. We reasoned that many global regulators are autoregulatory, which might have complicated these analyses. Expression of a dksA’-‘lacZ translational fusion was increased ~2.5-fold in a dksA mutant, suggesting that DksA negatively regulates its own expression (Fig. 4A). This was confirmed by ectopic expression of dksA (Fig. 4A).
Fig. 4.
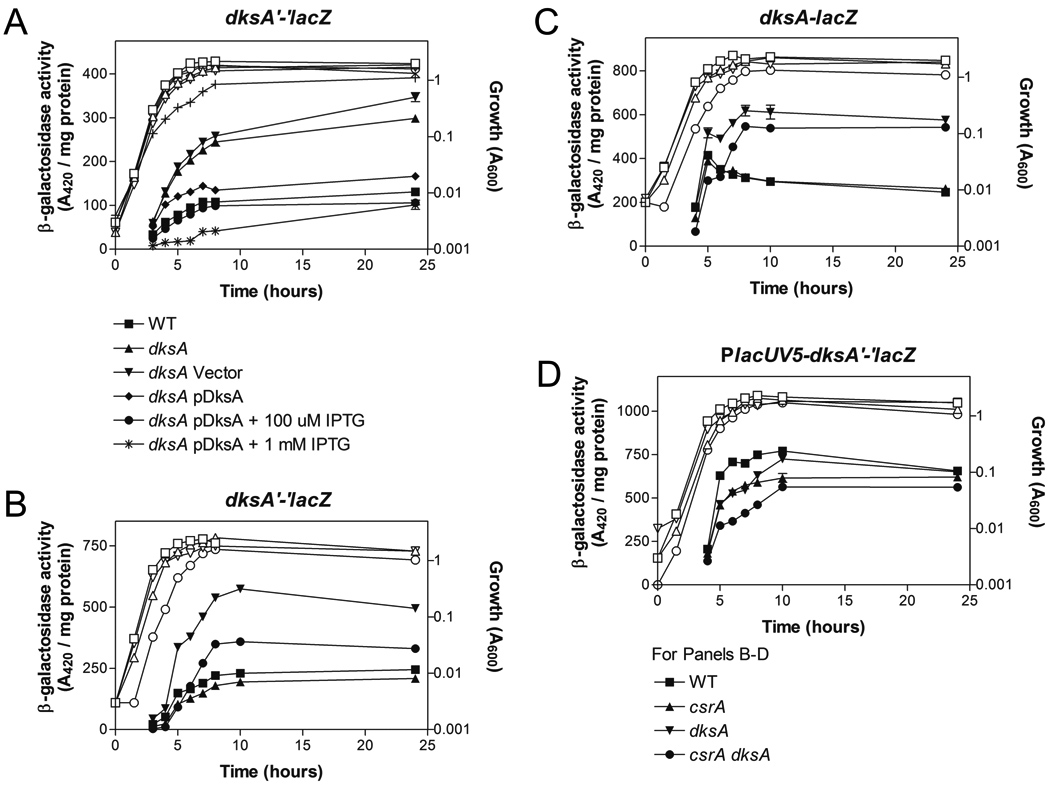
Effects of dksA and csrA on expression of chromosomally-encoded dksA translational, transcriptional, and leader fusions. (A–D) Cells were harvested at various times throughout growth and assayed for β-galactosidase specific activity (A420 / mg protein). Values represent the average of two independent experiments. Error bars depict standard error of the mean. Error bars smaller than the symbols are not shown. (A) Activity from a chromosomal dksA’-‘lacZ translational fusion. Growth curves are represented by corresponding open symbols except for dksA pHM1506 + 1 mM IPTG (+). (B–D) Activity from chromosomal dksA’-‘lacZ, dksA-lacZ, and PlacUV5dksA’-‘lacZ fusions. Growth curves are represented by corresponding open symbols. Where error bars are not visible, they are obscured by the symbols.
To determine if DksA negative autoregulation influences the effect of CsrA on dksA expression, dksA’-‘lacZ expression was compared in isogenic wild-type, dksA, csrA and dksA csrA strains. The dksA csrA double mutant expressed ~50% less β-galactosidase activity than the dksA single mutant (Fig. 4B), confirming that CsrA activates DksA expression and suggesting that DksA autoregulation tends to mask this effect. The dksA csrA double mutant exhibited an increase in β-galactosidase activity compared to the csrA single mutant (Fig. 4B), showing that DksA negative autoregulation occurs independently of CsrA regulation.
To assess the levels at which DksA and CsrA regulate dksA expression, a dksA-lacZ transcriptional fusion and a PlacUV5-dksA’-‘lacZ leader fusion were examined. Expression from the transcriptional fusion was increased ~2.5-fold in the dksA mutant, similar to the translational fusion (compare Fig. 4C to 4B), and was restored by ectopic expression of dksA (Fig. S1A). This revealed that the promoter DNA present in the transcriptional fusion mediates transcriptional autoregulation. In contrast, CsrA did not regulate the dksA-lacZ transcriptional fusion, suggesting that CsrA regulates dksA post-transcriptionally (Fig. 4C). This was confirmed by the finding that β-galactosidase activity from the PlacUV5-dksA’-‘lacZ was decreased (~30%) in a csrA mutant (Fig. 4D). A slight decrease in β-galactosidase activity from the PlacUV5-dksA’-‘lacZ leader fusion in the dksA mutant (Fig. 4D) from 5 to 8 h, and no effect at 10 h, revealed that the 5’ leader of dksA mRNA does not support negative autoregulation. Furthermore, ectopic expression of dksA did not substantially alter expression from the PlacUV5-dksA’-‘lacZ fusion (Fig. S1B).
To further examine DksA autoregulation, primer extension analysis of dksA mRNA was conducted (Fig. 5). Transcription of dksA from the chromosome was below the level of detection in our hands, even after long exposures (Fig. 5B). Using a dksA mutant, we examined ectopic expression of dksA transcripts from strains containing plasmids that expressed either the wild-type dksA allele or a dksA allele that contained amino acid substitutions in the two aspartic acid residues (D71N D74N) that are critical for DksA activity (Perederina et al., 2004). Both alleles were expressed from the native dksA promoters present in these plasmids. The wild-type dksA allele produced two transcripts, P1 and P2, in low abundance (Fig. 5B, Lane 3, see inset), which increased in the strain expressing the defective dksA D71N D74N allele (Fig. 5B, Lane 2). This finding revealed that a functional DksA protein is required for negative autoregulation and that the P1 and P2 transcripts are both subject to this regulation. The P1 promoter has been characterized previously (Kang and Craig, 1990), and in vitro transcription analysis resulted in two identically mapped transcripts (data not shown).
Fig. 5.
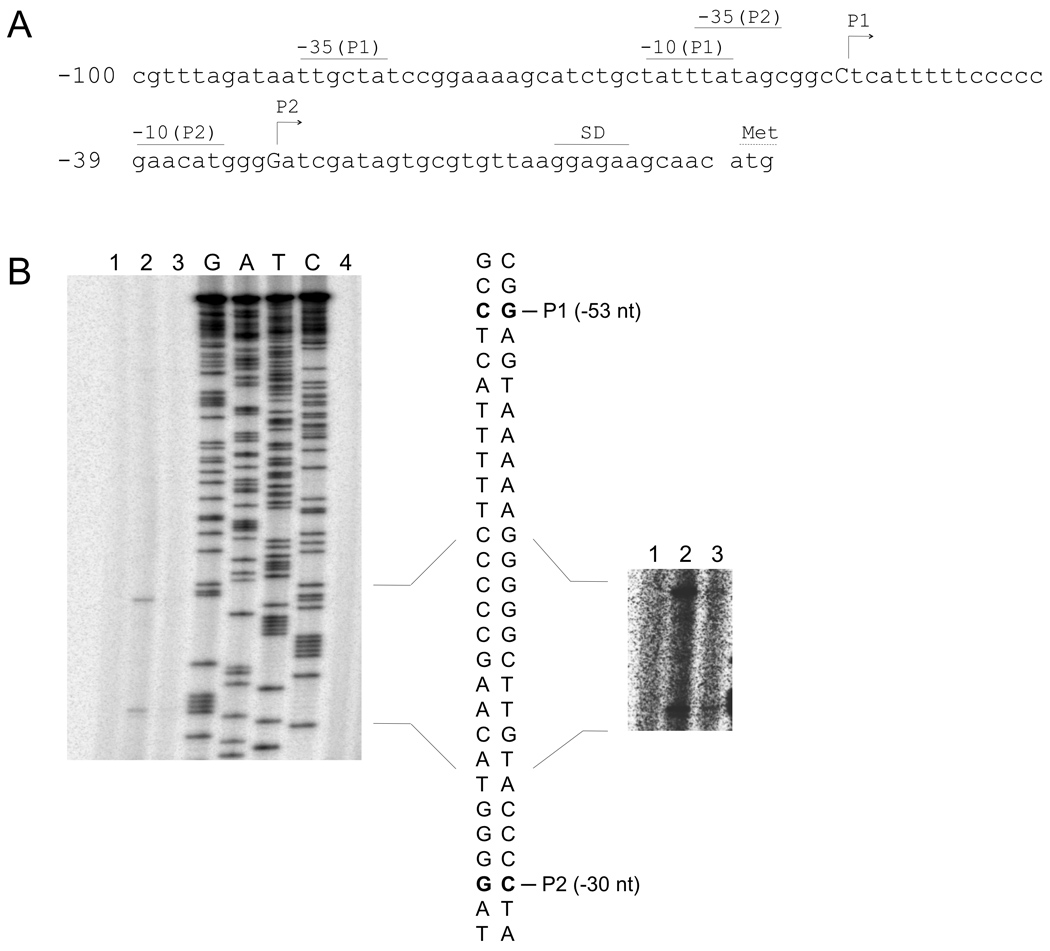
Effect of DksA on dksA transcription. (A) Nucleotide sequence of the dksA promoters. Positions of the mapped P1 and putative P2 transcriptional starts are depicted as capital letters, and predicted −35 and −10 promoter elements are shown. Numbering is with respect to the start of dksA translation. (B) Primer extension analysis of the dksA 5’ end. Lane 1, dksA (disrupted with kan); Lane 2, dksA pHM1684 (plasmid containing dksA with the D71N and D74N mutations); Lane 3, dksA pJK537 (wild-type dksA); Lane 4, wild-type. The dideoxynucleotide sequencing ladder (G, A, T and C) was generated with the same primer (pdksA2) used for the primer extension analysis. The image to the right shows an enhanced exposure to accentuate the extension products present in lane 3.
To confirm that DksA directly repressed transcription from the putative P1 and P2 promoters, we attempted in vitro transcription using a linear template and purified DksA and/or ppGpp, but were unable to demonstrate DksA-mediated inhibition (data not shown). This result may suggest that an additional factor or condition is required or that this effect is indirect.
Effects of dksA and ppGpp on csrA expression
The Csr and stringent response systems share a number of regulatory targets, e.g. glgCAP (Romeo and Preiss, 1989; Romeo et al., 1990; Liu and Romeo, 1997) and flhDC (Wei et al., 2001; Lemke et al., 2009). Furthermore, the Csr system possesses feedback loops in which its components both control and are controlled by other factors. Thus, we reasoned that the stringent response components might regulate expression of the genes of the Csr system. Western blotting demonstrated that CsrA protein levels were modestly reduced ~50% in the dksA mutant as well as the relA spoT (ppGpp0) mutant (Fig. 6A). CsrA protein levels in the dksA mutant were restored to wild-type or higher levels by ectopic expression of dksA. β-galactosidase activity from a csrA’-‘lacZ translational fusion was also reduced in the dksA and ppGpp0 mutants and complemented by ectopic expression of dksA (Fig. 6B). These observations indicate that DksA and ppGpp activate csrA expression.
Fig. 6.
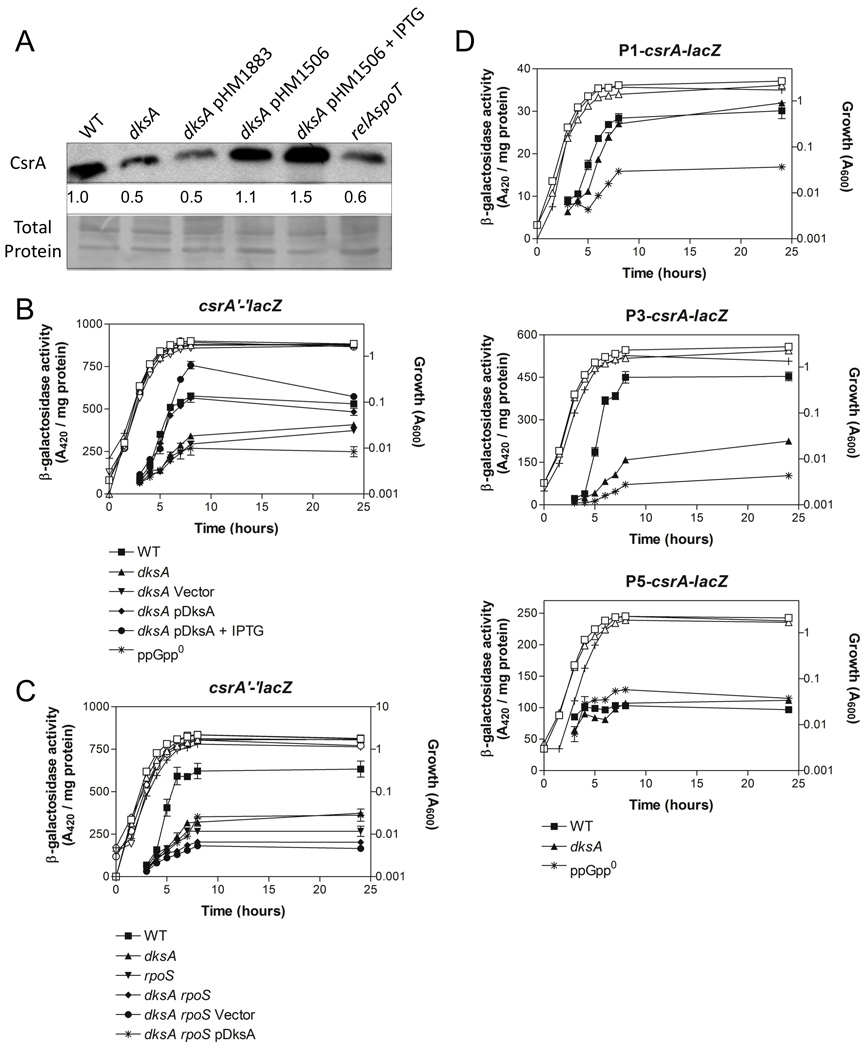
Effects of dksA, ppGpp and rpoS on csrA expression. (A) Western blot of CsrA protein levels in MG1655 (wild-type) and dksA mutant strains (upper panel) and PVDF membrane stained with the MemCode™ Reversible Protein Stain Kit (Pierce Biotechnology, Rockford, IL) and imaged as an internal loading control (lower panel). Cells were harvested at exponential phase (OD600 = 0.5) and stationary phase (at 8 hours of growth). Lane 1, MG1655; Lane 2, dksA::kan; Lane 3, dksA::kan pHM1883 (empty vector); Lane 4, dksA::kan pHM1506 (dksA+); Lane 5, dksA::kan pHM1506 + 0.1 mM IPTG; Lane 6, relA spoT (ppGpp0). Fold differences in protein levels (relative to wild-type) are indicated and represent an average of three independent experiments. The standard deviation for these values was < 10% from the mean. (B–F) Cells were harvested at various times throughout growth and assayed for β-galactosidase specific activity (A420 / mg protein). The values represent the average of two independent experiments. Error bars depict standard error of the mean. (B, C) Activity from a chromosomal csrA’-‘lacZ translational fusion. (D) Activity from chromosomal P1-csrA-lacZ, P3-csrA-lacZ and P5-csrA-lacZ transcriptional fusions. Growth curves are represented by open symbols, except for dksA rpoS pHM1506 + 1 mM IPTG (+) in panel C.
We recently found that the stationary phase and general stress response sigma factor, RpoS (σS), directly regulates csrA transcription (H. Yakhnin and P. Babitzke, unpublished results). Furthermore, ppGpp and DksA are required for full expression of RpoS (Brown et al., 2002; Hirsch and Elliott, 2002). We therefore asked whether DksA activation of csrA expression requires RpoS. Expression of the csrA’-‘lacZ fusion was reduced ~60% in the rpoS and dksA single mutant strains, while the rpoS dksA double mutant exhibited a further reduction in β-galactosidase activity (Fig. 6C). Ectopic expression of dksA from an IPTG-inducible plasmid partially restored β-galactosidase activity in the double mutant, but not to wild-type levels. These findings indicate that activation of csrA expression by DksA depends in part on RpoS.
Transcription of csrA is driven by at least three promoters (H. Yakhnin and P. Babitzke, unpublished results). RpoS directs csrA transcription from P3, while P1 and P5 are transcribed by the housekeeping sigma factor, σ70. Using transcriptional lacZ fusions for each promoter, we found that the P1-csrA-lacZ and P5-csrA-lacZ fusions were unaffected by the dksA mutation, whereas the P3-csrA-lacZ fusion was decreased (3-fold) in the dksA mutant (Fig. 6D). These data further suggest that DksA activates csrA expression primarily through RpoS-driven transcription of P3. Interestingly, ppGpp was required for full activity of the P1-csrA-lacZ and P3-csrA-lacZ fusions (Fig. 6D), suggesting that ppGpp likely influences csrA expression through additional RpoS-independent pathway(s). Furthermore, expression from the minor promoter P1 was not affected by DksA, but was partly dependent on ppGpp. This exemplifies the finding that DksA and ppGpp independently regulate certain genes (see Discussion).
DksA and ppGpp activate csrB and csrC expression
Further examination of DksA and ppGpp effects on the Csr system by Northern blotting revealed that CsrB and CsrC RNA levels were reduced 10-fold in dksA and ppGpp0 mutant strains (Fig. 7A). Additionally, csrB and csrC transcripts were reduced in the csrA mutant, as previously observed (Fig. 7A; Suzuki et al., 2002; Weilbacher et al., 2003). Ectopic expression of dksA partly or fully complemented the dksA mutation. Expression of csrB-lacZ and csrC-lacZ transcriptional fusions was decreased substantially in the dksA mutant and ppGpp0 strains (Fig. 7B). Furthermore, activity was restored in the dksA mutant strain by ectopic expression of dksA (Fig. 7B). These findings indicate that DksA and ppGpp activate csrB and csrC transcription.
Fig. 7.
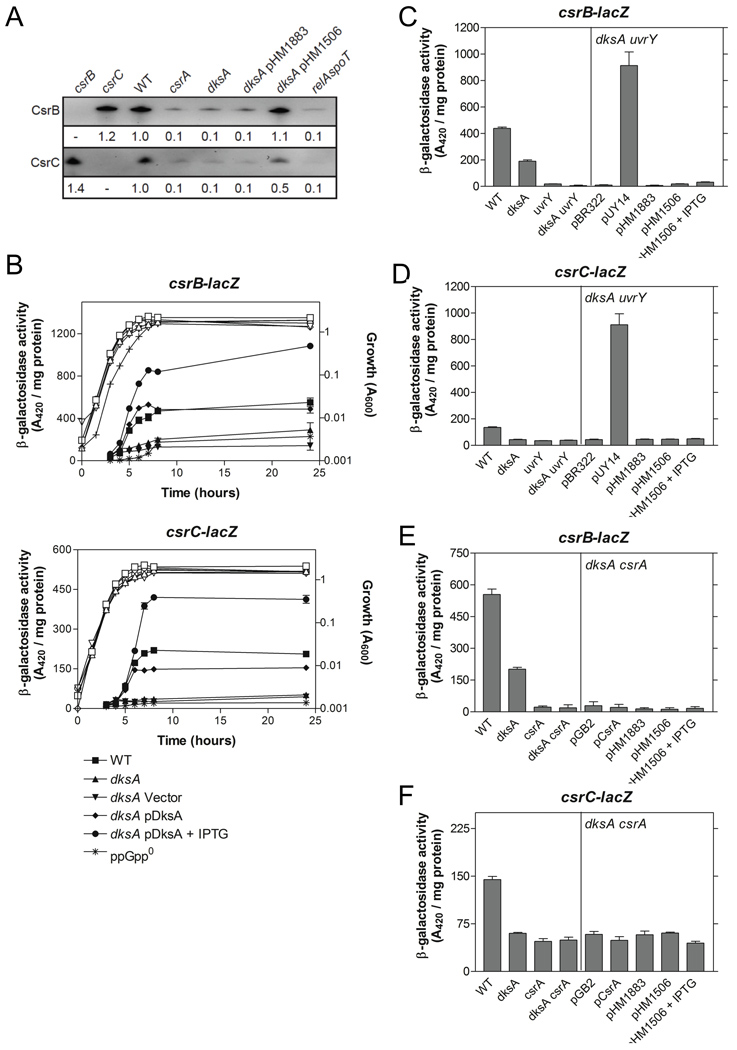
Effects of dksA and ppGpp on CsrB and CsrC RNA levels and gene expression. (A) A representative Northern blot of RNA from MG1655 (WT) and isogenic mutants is shown. A plasmid vector (pHM1883) and a dksA expression plasmid (pHM1506) were used for dksA complementation analysis. Fold differences in RNA levels (relative to wild-type) are indicated and represent an average of three independent experiments. The standard deviation for all values was <10% from the mean. (B) Activity from chromosomal csrB-lacZ and csrC-lacZ transcriptional fusions. Cells were harvested at various times throughout growth and assayed for β-galactosidase specific activity (A420 / mg protein). The values represent the average of two independent experiments, and error bars depict the standard error of the mean. Growth curves are represented by open symbols except for relA spoT (ppGpp0) (+). (C, D) Epistasis studies with csrB-lacZ (C) and csrC-lacZ transcriptional fusions (D) in dksA, uvrY and dksA uvrY backgrounds with ectopic expression of uvrY (pUY14) or dksA (pHM1506) at 8 hours of growth. The vector controls were pBR322 and pHM1883, respectively. (E, F) Epistasis studies with csrB-lacZ (E) and csrC-lacZ transcriptional fusions (F) in dksA, csrA and dksA csrA backgrounds with ectopic expression of csrA (pCsrA) or dksA (pHM1506) at 8 hours of growth. The vector controls were pGB2 and pHM1883, respectively.
CsrA indirectly activates transcription of CsrB and CsrC sRNAs, through the BarA-UvrY TCS (Suzuki et al., 2002; Weilbacher et al., 2003). BarA is a membrane bound tripartite sensor kinase, while UvrY functions as its cognate response regulator (Pernestig et al., 2001). Epistasis studies were conducted to determine whether the effects of DksA on csrB and csrC expression were dependent upon UvrY. Ectopic expression of uvrY restored csrB-lacZ and csrC-lacZ expression in a dksA uvrY double mutant while ectopic expression of dksA did not (Fig. 7C, D). This suggested that dksA might lie upstream of uvrY in this signaling pathway. Furthermore, the promoter sequences of csrB, csrC and uvrY do not contain AT-rich discriminator sequences, as observed for genes that are subject to direct positive regulation by ppGpp (Da Costa and Artz, 1997; Barker et al., 2001). The barA promoter has not been determined. Expression from a uvrY’-‘lacZ translational fusion was unaffected in the dksA mutant strain (Fig. S2), indicating that DksA does not affect uvrY expression, and raising the possibility that it may affect UvrY activity. CsrA is required for normal signaling through the BarA-UvrY TCS (Suzuki et al., 2002), and since DksA activates CsrA, epistasis studies were performed to determine if DksA activated csrB and csrC expression through CsrA. However, neither ectopic expression of csrA nor dksA restored csrB-lacZ or csrC-lacZ expression in a dksA csrA double mutant (Fig. 7E, F). These findings revealed that CsrA and DksA are both necessary for full expression of csrB and csrC, and suggest that their effects in this circuitry are not mediated in series, i.e., sequentially.
DksA, ppGpp and csrA affect acetate production
Because acetate acts as a stimulus for BarA-UvrY signaling (Chavez et al. 2010), we asked whether CsrA, DksA or ppGpp affect csrB and csrC expression via effects on acetate accumulation. Acetate levels were monitored in isogenic wild-type, csrA, dksA, csrA dksA, and ppGpp0 strains. No substantial differences in acetate accumulation were observed in LB medium (Fig. S3A). However, in a medium requiring glycolytic carbon metabolism (Kornberg medium; Fig. S3B), all of the mutant strains accumulated less acetate than the parent strain. Nevertheless, these effects were likely insufficient to account for strong regulation of csrB and csrC expression by these genes. A barA’-‘lacZ translational fusion was constructed to monitor effects of ppGpp, DksA and CsrA on barA expression, but its expression was too low to measure.
Discussion
The motivation for these studies was our observation that the mRNAs for the three stringent response genes, relA, spoT and dksA, copurified with a recombinant CsrA protein. While the Csr and stringent response systems were known to govern a number of the same genes and processes, the present study has revealed novel regulatory interactions within and among the components of these global regulatory systems (summarized in Fig. 8).
Fig. 8.
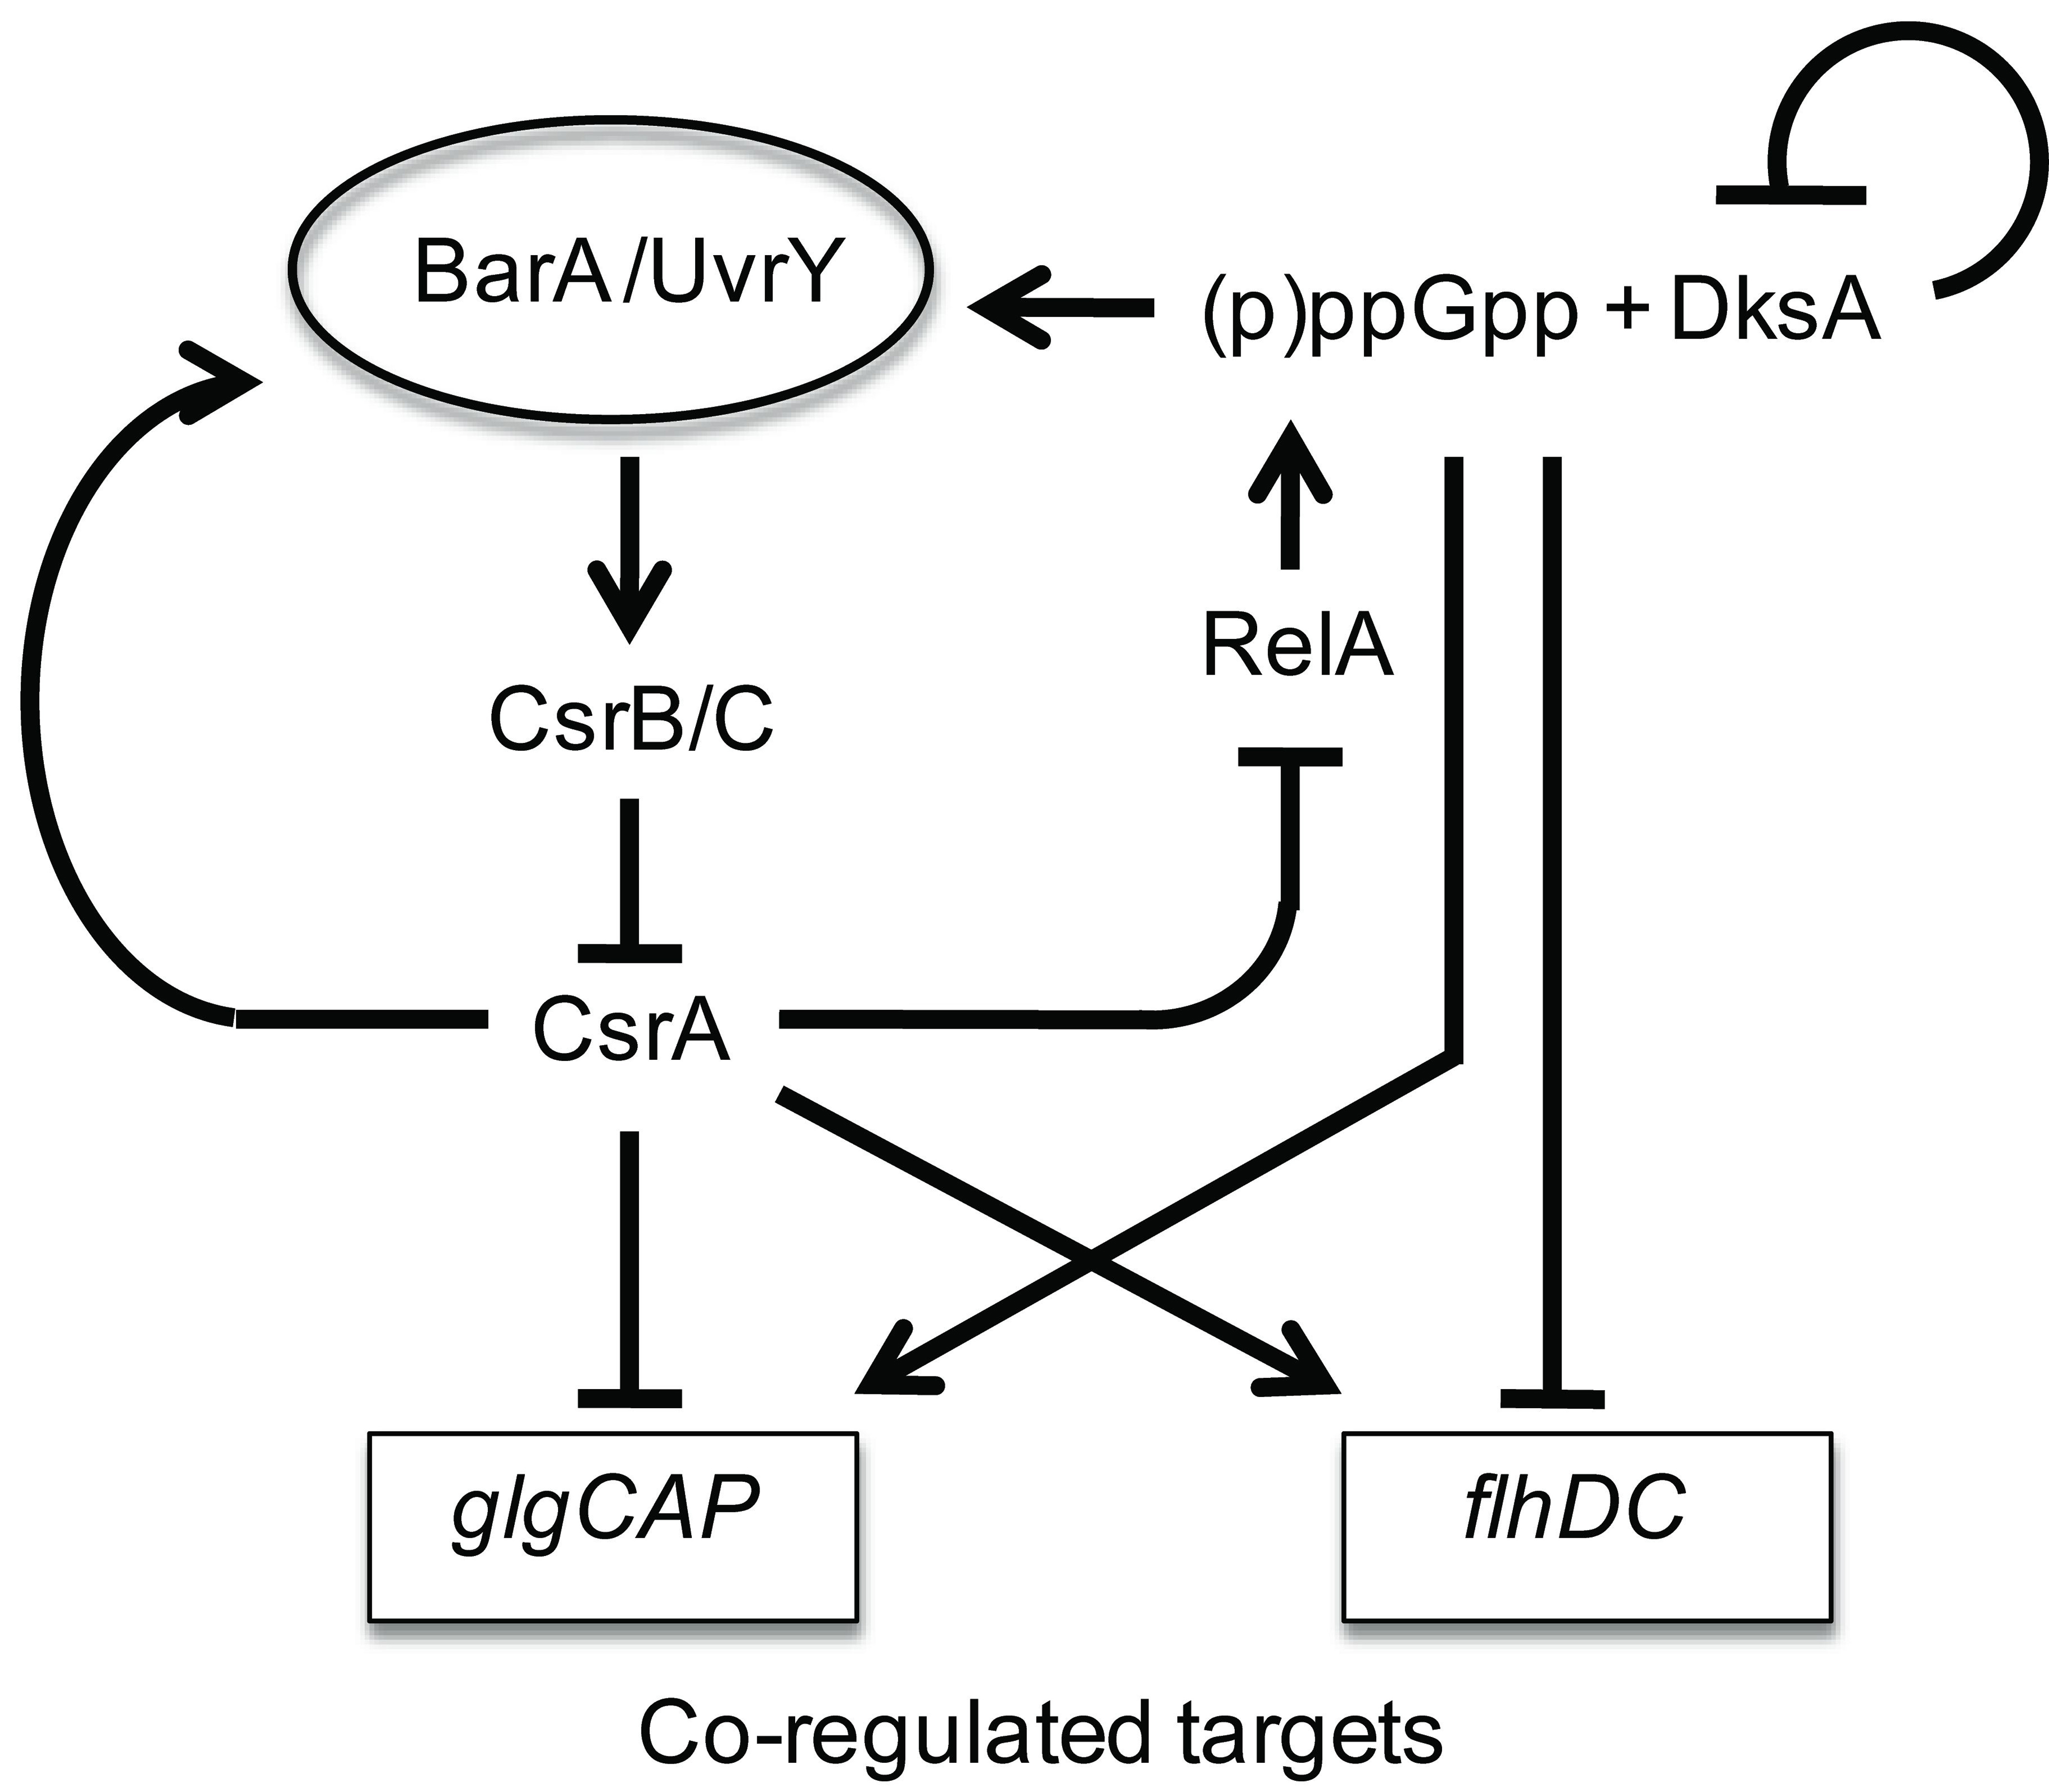
Model for the regulatory circuitry of the Csr and stringent response systems. Composite circuitry depicting feedback loops of the system. CsrA activates csrB and csrC expression via the BarA-UvrY TCS (Suzuki et al., 2002; Weilbacher et al., 2003). In turn, CsrB and CsrC RNAs sequester and antagonize CsrA (Liu et al., 1997; Weilbacher et al, 2003). DksA and ppGpp activate (10-fold) transcription of CsrB/C RNAs. In turn, this should down-regulate CsrA activity during the stringent response. A prediction of this circuitry is that during stringent response, the direct effects of ppGpp on target genes that respond oppositely to ppGpp and CsrA, e.g., glycogen synthesis (glgCAP) genes (Romeo and Preiss, 1989; Romeo et al., 1993; Baker et al., 2002), and motility (flhDC) genes (Wei et al., 2001; Lemke et al., 2009) will be reinforced by the downregulation of CsrA activity. The modest effects of DksA and ppGpp on CsrA are likely overshadowed by their strong effects on CsrB/C, and are not shown in the diagram. Similarly, the modest effect of csrA on dksA’-‘lacZ expression, which is masked by DksA negative autoregulation, is not shown. In another feedback loop (not shown), CsrA represses csrD expression, which is needed for RNase E-dependent turnover of CsrB/C RNAs (Suzuki et al., 2006).
The strongest effects (10-fold) observed in this study were the positive transcriptional effects of ppGpp and DksA on csrB and csrC expression and CsrB/C RNA levels (Fig. 7). The positive effects of DksA and ppGpp on CsrA levels were relatively modest in comparison (Fig. 6). Furthermore, one molecule of CsrB or CsrC RNA is able to sequester ~10 or 5 CsrA dimers, respectively (Babitzke and Romeo, 2007), which further magnifies the inhibitory influence of ppGpp on CsrA activity. The increased ppGpp levels that are generated in response to the stringent response or other metabolic stresses should antagonize CsrA activity during such conditions. This is in keeping with the regulatory roles of CsrA in repressing metabolic pathways and processes that are activated upon the entry into stationary phase growth, while activating central metabolic pathways (Babitzke and Romeo, 2007). Previous studies demonstrated that CsrB and CsrC RNA levels are elevated in minimal media and decline drastically upon amino acid supplementation, while CsrA levels were only modestly affected under these conditions (Jonas and Melefors, 2009). Thus, our present observations point to the genetic circuitry responsible for the effects of amino acids on the Csr system, and the prior physiological studies strengthen our model for the composite system (Fig. 8).
In reciprocal regulatory interactions, CsrA bound with high affinity to relA mRNA and negatively regulated relA expression, relA transcript levels, RelA protein levels, and (p)ppGpp accumulation during the induction of stringent response. Thus, the Csr system plays a negative regulatory role in the stringent response. The effects of CsrA on other genes of the stringent response system were more subtle, and their implications less certain. Despite the strong binding interactions of CsrA with the relA transcript (Fig. 1C, D), its effects on relA expression and RelA protein levels were relatively modest (Figs. 2, 3). These results differed from the much stronger effects of CsrA on various structural genes, whose mRNAs were bound by CsrA with affinities that do not differ greatly from that of relA (Kd = 17 nM CsrA), e.g., glgCAP at 39 nM (Baker et al., 2002), cstA at 40 nM (Dubey et al., 2003), pgaABCD at 22 nM (Wang et al., 2005). While the molecular basis of the distinct effect of CsrA on relA expression remains to be determined, high affinity binding in the context of modest regulation implies that CsrA fine-tunes relA expression, as opposed to functioning as a course-control mechanism or an on-off switch.
As a consequence of CsrA-mediated repression of RelA protein levels, CsrA repressed (p)ppGpp accumulation ~1.5-fold during SHX-induced stringent response (Fig. 3E). Furthermore, CsrA affected the relative accumulation of pppGpp versus ppGpp; the csrA mutant accumulated substantially greater amounts of pppGpp (Fig. 3E). The enzyme responsible for dephosphorylation of pppGpp to form ppGpp is encoded by gpp mRNA (Keasling et al., 1993), which copurified with CsrA protein (Table S2). While the biological role for differential effects on pppGpp and ppGpp remains to be determined, our observations raise the possibility that gpp mRNA may be a target of positive regulation by CsrA.
Our studies also suggest that there is substantial overlap between the stringent response and Csr regulons. Altogether, 40% of the genes whose transcripts copurified with CsrA (Table S1) were found previously to respond to ppGpp and/or DksA (Aberg et al., 2009). Even more striking, 68% of such genes in COG C, encoding proteins involved in energy production and conversion, were found to be common between these two studies (Table S1). These values represent minimum estimates of the regulatory overlap, as only the exact gene matches between the two data sets were tabulated.
Our working model for the composite regulatory network has interesting implications for genes that respond to both regulatory systems (Fig. 8). Presently, two genetic systems have been demonstrated to respond directly to both CsrA and ppGpp: the glycogen biosynthetic operon, glgCAP (Romeo and Preiss, 1989; Romeo et al., 1990; Liu et al., 1997; Baker et al., 2002), and the flhDC operon, which encodes a transcription factor that activates the motility and chemotaxis cascade (Wei et al., 2001;Lemke et al., 2009). In these examples, CsrA and ppGpp have opposite effects on expression, i.e. glgCAP is repressed by CsrA and activated by ppGpp, while flhDC is activated by CsrA and repressed by ppGpp. Because the major effect of ppGpp and DksA on the Csr system is to increase CsrB/C RNA levels and thereby decrease CsrA activity, the stringent response should reinforce its direct effects on glgCAP and flhDC by down-regulating the opposing post-transcriptional effects of CsrA. We caution that although this attractive model is based on established regulatory nodes, additional studies are required to demonstrate the role of cross regulation from ppGpp to CsrA in the full system. In addition, it is not clear that CsrA and ppGpp function antagonistically with respect to other genes of their overlapping regulons.
DksA and ppGpp robustly activated csrB/C transcription in a UvrY-dependent fashion, and in parallel with CsrA (Fig. 7). Because DksA did not affect uvrY expression (Fig. S2), and ectopic expression of uvrY restored csrB and csrC expression in a dksA uvrY mutant background (Fig.7C, D), DksA may affect UvrY activity. In Pseudomonas aeruginosa, the BarA sensor-kinase ortholog (GacS), as well as two other sensors that do not have orthologs in E. coli, RetS (Goodman et al., 2004; Goodman et al., 2009) and LadS (Ventre et al., 2006), have been proposed, based on genetic experiments, to regulate the activity of the UvrY ortholog (GacA). The absence of an AT-rich discriminator sequence (Da Costa and Artz, 1997; Barker et al., 2001) in the csrB and csrC promoters is inconsistent with direct activation of their transcription by ppGpp, although the limited information on transcriptional activation by ppGpp makes such predictions uncertain. Whether BarA alone or other factors in E. coli mediate DksA and ppGpp effects on csrB and csrC expression will require additional investigation.
Previous studies revealed that DksA protein levels remain relatively constant throughout growth (Brown et al., 2002; Paul et al., 2004; Rutherford et al., 2007). A recent stringent response model suggests that since DksA levels are constant, ppGpp levels mediate stringent control upon nutritional stress (Dalebroux et al., 2010). Our results demonstrated that DksA levels are regulated by a negative feedback loop, whereby DksA represses its own transcription. Negative feedback loops tend to promote homeostasis (Becskei and Serrano, 2000), and are not unexpected for a regulatory gene whose product is maintained within a relatively narrow range. Presumably, negative autoregulation permits transcription of dksA to be adjusted in response to DksA protein levels. Autoregulation of dksA tended to mask the opposing and relatively weak effect of CsrA, as observed in epistasis analyses (Fig. 5). Our data do not resolve the apparent discrepancy between the weak positive effects of CsrA on dksA reporter expression (Figs. 2E, 5) versus the absence of effects of CsrA on DksA mRNA and protein levels (Fig. 3A, D). However, CsrA copurified with RNAs representing various factors (e.g., ribonucleases and proteases) capable of differentially influencing DksA mRNA or protein levels versus reporter expression.
We previously demonstrated that the Csr system of E. coli contains multiple negative feedback loops (Suzuki et al., 2002; Weilbacher et al., 2003; Suzuki et al., 2006; Fig. 8), which may provide distinct advantages for this regulatory network. Negative feedback loops produce graded responses, thus reducing cell-cell variability (Nevozhay et al., 2009) and stochastic events and noise (Becskei and Serrano, 2000), and they can also accelerate regulatory responses (Rosenfeld et al., 2002). A central feedback loop of the Csr system involves a multistep pathway from CsrA to csrB and csrC expression via the BarA-UvrY TCS (Fig. 8). The recent finding that acetate and other short-chain fatty acids act as a stimulus for BarA signaling (Chavez et al., 2010), coupled with previous studies showing that CsrA activates glycolysis (Sabnis et al., 1995), suggested that glycolysis might provide the link between CsrA and BarA activity. However, acetate accumulation (Fig. S3) cannot explain the effects of CsrA, DksA or ppGpp on csrB and csrC transcription. Thus, acetate signaling to BarA in E. coli likely allows the Csr system to respond to conditions of the large intestinal lumen (discussed in Chavez et al., 2010), although this remains to be experimentally demonstrated.
An unexpected observation was that CsrA had opposite effects on relA and dksA expression (Fig. 2). Although ppGpp and DksA often potentiate each other’s effects, there have been several reports of independent and even antagonistic effects of ppGpp and DksA (Magnusson et al., 2007; Aberg et al., 2008; Aberg et al., 2009; Lyzen et al., 2009; Merrikh et al., 2009). Indeed, ppGpp0 and dksA mutant strains exhibit multiple, but not identical, amino acid auxotrophies (Brown et al., 2002; Potrykus et al., 2010b), perhaps signifying alternative gene expression roles for ppGpp and DksA. Presently, it is not clear how the modest effect of CsrA on dksA expression might impact differential genetic regulation or whether negative feedback by DksA tends to overshadow the effect of CsrA under most or all physiological conditions.
Given that the stringent response was only one of many transcriptional regulatory systems whose mRNAs copurified with CsrA (Tables S1, S2), the complexity of the regulatory circuitry surrounding the Csr system is undoubtedly vast. Supporting this hypothesis, transcripts for regulatory factors necessary for critical cellular processes were identified, including alternative sigma factors (rpoE and rpoH), universal stress proteins (uspA, uspB and uspD) and the proteins that mediate catabolite repression (crp and cyaA). We expect that the high-throughput sequencing of CsrA-bound transcripts from the present study will spur additional research on the complex circuitry and global regulatory role of Csr system.
Experimental Procedures
Bacterial strains, phage, plasmids and growth conditions
All E. coli K-12 strains, plasmids and bacteriophage used in this study are listed in Table S5. Unless otherwise indicated, bacteria were grown at 37°C, shaking at 250 rpm, in Luria-Bertani (LB) medium (Miller, 1972). Media were supplemented with antibiotics, as needed, at the following concentrations: kanamycin, 100 µg ml−1; ampicillin, 25 µg ml−1; spectinomycin, 25 µg ml−1; chloramphenicol, 25 µg ml−1; and tetracycline, 10 µg ml−1, except that ampicillin was used at 100 µg ml−1 during the construction of lacZ fusion plasmids. P1vir transduction was performed as previously described (Miller, 1972).
Construction of transcriptional, translational and leader fusions and integration into the chromosome
Plasmids pRELZ and pDKSZ were constructed by PCR amplification of an 888 bp fragment containing the upstream regulatory region through the first three codons of relA and 628 bp fragment containing the upstream regulatory region through the first three codons of dksA using the primer pairs relA-F/relA-R and dksA-F/dksA-R. Table S6 lists primer sequences. The products were digested with EcoRI and BamHI and cloned into the same sites of pMLB1034 to create relA’-‘lacZ and dksA’-‘lacZ translational fusions. Both fusions were moved into the E. coli CF7789 chromosome using λInCh1 and confirmed by PCR analysis, as previously described (Boyd et al., 2000).
A series of plasmids using the pAH125 plasmid backbone (Haldimann and Wanner, 2001) were created for the generation of various lacZ fusions. pLFX was generated to replace the kanamycin resistance marker of pAH125 with ampicillin resistance. The bla PCR product was generated using the primer pair AmpRF/AmpRR and plasmid pUC19 DNA as template. Purified PCR product was digested with ClaI and NotI. ClaI/NotI digestion of pAH125 generated three fragments; the 1.2 kb and 3.5 kb DNA fragments were purified from 1X TAE agarose gels and ligated with the bla PCR product to generate the lacZ transcriptional fusion vector, pLFX. pLFX was used to generate a lacZ translational fusion vector. BssHII/EcoRI digestion of pLFX and pMLB1034 liberated 4.3 kb and 1.5 kb fragments, respectively. These fragments were gel purified and ligated to generate the lacZ translation fusion vector, pLFT. pLFT was also used to create a post-transcriptional (or leader) fusion vector containing the constitutive lacUV5 promoter. The lacUV5 promoter was amplified using the primer pair LPF-19/LPF-20 and pUV5moaA (L. M. Patterson-Fortin and T. Romeo, unpublished data) plasmid DNA as template, and the purified PCR product was digested with PstI and EcoRI and cloned into PstI/EcoRI digested pLFT plasmid DNA. The resulting plasmid pUV5 allows construction of lacZ translational fusions expressed from the constitutive lacUV5 promoter.
Plasmid pPFINT was constructed to replace the ampicillin resistance marker of the parent plasmid, pINT-ts (Haldimann and Wanner, 2001), with tetracycline resistance. The tet PCR product was generated using the primer pair LPF-21/LPF-22 and pBR322 plasmid DNA as template, and the purified PCR product was digested with ClaI. pINT-ts was digested with BglI, blunt-ended using DNA polymerase I, and digested with ClaI. The resulting 4 kb fragment was gel purified and ligated with the ClaI-digested tet PCR product to generate pPFINT.
The plasmids pRELZtxn and pDKSZtxn were constructed by PCR amplification of a 255 bp fragment containing the upstream regulatory region of relA from −880 to −625 relative to the translational start and a 66 bp fragment containing the upstream regulatory region of dksA from −118 to −52 relative to the translational start using the primer pairs relA-F-txn/relA-R-txn and dksA-F-txn/dksA-R-txn, respectively. The products were digested with PstI and BamHI and cloned into the same sites of pLFX to create relA-lacZ and dksA-lacZ transcriptional fusions. Plasmids pRELZplacP1, pRELZplacP2, pDKSZplac, pGMKZplac, and pSPOZplac were constructed by PCR amplification of the 5’ untranslated mRNA leaders of relA, dksA, gmk, and rpoZ-spoT using the primer pairs relAP1-F-plac/relA-R, relAP2-F-plac/relA-R, dksA-F-plac/dksA-R, gmk-F-plac/gmk-R-plac, and spoT-F-plac/spoT-R-plac, respectively, to create leader fusions under the control of the lacUV5 promoter. These products were digested with EcoRI and BamHI and cloned into the same sites of pUV5. All fusions were integrated into the CF7789 chromosome as previously described (Haldimann and Wanner, 2001). All oligonucleotide primers used in this study (Table S6) were synthesized by Integrated DNA Technologies Inc., Coralville, Iowa, and all cloned DNA inserts were sequenced to confirm the absence of mutations.
Cloning of the csrA gene
The plasmid pCsrA, encoding the csrA gene including 400 bp upstream from the start of csrA translation through the coding region, was constructed by PCR amplifying the csrA gene with primers csrA-F-pGB2 and csrA-R-pGB2. The PCR product was digested with HindIII and EcoRI and cloned into the same sites of pGB2 (Churchward et al., 1984).
RNA Gel Shift Assays
E. coli CsrA-His6 protein for gel shifts was purified from pCsrH6-19 as described previously (Mercante et al., 2006). This plasmid was also the source of CsrA-His6 in the RNA pull-down experiments (Tables S1, S2). Quantitative gel mobility shift assays followed a previously published procedure (Yakhnin et al., 2000). DNA templates for relA and gmk transcripts were PCR-amplified from MG1655 genomic DNA using the primer pairs relA-F-T7/relA-R-T7 and gmk-F-T7/gmk-R-T7. DNA templates for rpoZ and all dksA transcripts were produced by annealing primer pairs rpoZ-T7/GC-rpoZ-T7, dksA-T7/GC-dksA-T7, dksA-BS1/GC-dksA-BS1, dksA-BS2/GC-dksA-BS2, and dksA-BS1-2/GC-dksA-BS1-2. RNA was synthesized in vitro using the MEGAshortscript kit (Ambion, Austin, TX) and purified PCR products (for relA and rpoZ), annealed DNA primers (gmk and all dksA transcripts) or linearized plasmid pPB77 (for nonspecific trp leader RNA from B. subtilis) (Babitzke et al., 1994) as templates, and RNA was gel purified. Transcripts were 5' end-labeled using T4 polynucleotide kinase and [γ-32P]-ATP. Radiolabeled RNA was gel purified and resuspended in TE (10 mM Tris-HCl pH 8.0, 1 mM EDTA), heated to 85°C and chilled on ice. Increasing concentrations of purified CsrA-His6 recombinant protein were combined with 80 pM radiolabeled RNA in 10µl binding reactions [10 mM Tris-HCl pH 7.5, 10 mM MgCl2, 100 mM KCl, 3.25 ng total yeast RNA, 20 mM DTT, 7.5% glycerol, 4U SUPERasin (Ambion, Austin, TX)] for 30 min at 37°C to allow for CsrA-RNA complex formation. Competition assays were performed in the absence or presence of unlabelled RNA specific and non-specific competitors, and used CsrA concentrations that reflected the direct binding interactions (minimal concentrations required for full shift). Binding reactions were separated using 10% native TBE polyacrylamide gels, and radioactive bands were visualized with a Molecular Dynamics phosphorimager. Free and bound RNA species were quantified with Quantity One (Bio-Rad, Hercules, CA), and an apparent equilibrium binding constant (Kd) was calculated for CsrA-RNA complex formation according to a previously described cooperative binding equation (Mercante et al., 2006).
β-galactosidase and total protein assays
β-galactosidase activity was determined as described previously (Romeo et al., 1990), except that 100 µl chloroform and 50 µl 0.01% SDS were used for cell membrane permeabilization. Total cellular protein was measured by the bicinchoninic acid (BCA) assay with bovine serum albumin as the protein standard (Pierce Biotechnology, Rockford, IL). All analyses compared isogenic strains, derived from CF7789.
rt-qRT-PCR
To measure steady-state levels of relA, spoT and dksA transcripts, wild-type (MG1655) and csrA mutant strains were grown at 37°C in LB medium, and cells were harvested in exponential (OD600 ≈ 0.5) and early stationary phases. Total RNA was isolated using the Ribo-pure Bacteria Kit (Ambion, Austin, TX) according to the manufacturer’s instructions. RNA was quantified by its absorbance at 260 and 280 nM, and rRNA integrity was analyzed on formaldehyde agarose gels. Real-time quantitive reverse-transcription PCR (rt-qRT-PCR) was performed using the iScript one-step RT-PCR Kit (Bio-Rad, Hercules, CA) along with primer pairs for the coding regions (~70 nt) of the mRNAs, specifically, relA-F-taqman and relA-R-taqman, spoT-F-taqman and spoT-R-taqman, and dksA-F-taqman and dksA-R-taqman, and the probes relA-6FAM-BHQ1, spoT-6FAM-BHQ1, and dksA-6FAM-BHQ1, which were 5’-end labeled with 6-carboxyfluorescein (6FAM) and 3’-end labeled with Black Hole Quencher 1(BHQ1). Reactions were conducted using the Lightcyler 480 (Roche Diagnostics) under the following conditions: 50°C for 10 min, 95°C for 5 min, and 40 cycles of 95°C for 15 sec and 60°C for 30 seconds with real time measurements taken at the 60°C step. Each reaction was performed in triplicate in two independent experiments, each time with 100 ng and 10 ng template RNA, and the mean values of the two experiments were determined. A reaction lacking reverse transcriptase was included for each sample, which served as a control for DNA contamination. For normalization of relA, spoT and dksA transcript levels, rt-qRT-PCRs were performed with each sample for 16S rRNA quantitation using the primer pair 16S-Fw and 16S-Rv and the probe 16S-6FAM-BHQ1 (Baker et al., 2007). The reaction conditions for rt-qRT-PCR of 16S rRNA were identical to the other transcripts except that 1 ng and 0.1 ng of RNA were used for each example. The identities of all of the PCR products were confirmed by electrophoresis on 1% agarose gels with ethidium bromide staining. The 2−ΔΔCT method was used to calculate relative transcript levels (Livak and Schmittgen, 2001).
Western blotting
Cultures for western blot analyses were grown at 37°C with shaking, and at indicated time points, cells from 1 ml of culture were concentrated and resuspended in Lysis Buffer A (90 mM Tris-HCl, 2% SDS, pH 6.8). Samples were boiled for 3 min, cell debris was removed by centrifugation, and the supernatant saved and assayed for total protein using the BCA assay with bovine serum albumin as the protein standard (Pierce Biotechnology, Rockford, IL). 10 µg total protein was applied to 8–15% SDS-polyacrylamide gels and transferred to Immunoblot PVDF membrane (Bio-Rad, Hercules, CA) after separation. RelA, DksA and CsrA proteins were detected as previously described (Brown et al., 2002; Gudapaty et al., 2001). GMK antibody was obtained from the Cashel lab and was raised against GMK protein purified as previously described (Gentry et al., 1993). Protein bands were quantified with Quantity One (Bio-Rad, Hercules, CA).
Primer Extension
Primer extension was carried out as previously described (Potrykus et al., 2010a) except that 10 ug of total RNA was used. RNA was isolated from the following strains: CF9239 (MG1655 dksA::kan), CF9239/pJK537 and CF9239/pHM1684.
Northern Blotting
Bacterial cells were grown in LB at 37°C with shaking, and cellular RNA was stabilized by the addition of 2 vol of the RNAprotect Bacteria Reagent (Qiagen). Total cellular RNA was extracted using the RNeasy Mini kit (Qiagen), quantitated by absorbance (260 nm). The resulting RNA (5 µg) was separated on 5% polyacrylamide gels containing 7 M urea, rRNAs were visually examined by ethidium bromide staining, and the RNA was transferred to positively charged nylon membranes (Roche Diagnostics) by electroblotting using the Mini Trans-Blot Cell (Bio-Rad, Hercules, CA) according to the manufacturer’s instructions. RNA was cross-linked to nylon membranes by exposure to UV light (120,000 µJ) followed by baking at 80°C for 30 min. Membranes were then blotted with DIG-labeled anti-sense RNA probes using the DIG Northern Starter Kit (Roche Diagnostics) according to the manufacturer’s instructions. Blots were developed using the ChemiDoc XRS+ system (Bio-Rad, Hercules, CA) and densitometry was performed using Quantity One image analysis software (Bio-Rad, Hercules, CA).
Thin-layer chromatography of (p)ppGpp levels
MG1655 (WT) and csrA::kan strains were grown in MOPS minimal media containing 0.2 % glucose, 0.1 mM serine, and the remaining amino acids and vitamins as described previously (Wanner et al., 1977). Nucleotides were labeled in vivo by the addition of 0.33 mM K2HPO4 and 20 µCi ml−1 of 32Pi (Perkin-Elmer) to the growth medium. Cells were grown to an OD600 of 1.0 at which time 200 µg ml−1 serine hydroxamate (SHX) was added and aliquots were sampled every four minutes up to 16 minutes. Nucleotide extraction was performed by mixing 200 µl of culture with 40 µl of cold formic acid and incubating on ice for approximately 20 minutes. Following centrifugation, 10 µl of supernatant solution was spotted onto PEI-F cellulose TLC plates, and nucleotides were separated using 1.0 M KH2PO4 (pH 3.4) as a solvent. Labeled nucleotides were detected by phosphorimaging and densitometry was performed using Quantity One software (Bio-Rad, Hercules, CA). Cold GTP was detected by UV shadowing.
Supplementary Material
Acknowledgments
This work was supported by NIH grants GM059969 (T.R. and P.B.) and GM066794 (T.R.); FLA-MCS-004949 from University of Florida CRIS project (T.R.); George W. Woodruff Fellowship from Emory University (A.N.E.); NIH grants AI084160 and AI058284 (S.A.T.); by grants IN219709-3 from DGAPA-PAPIIT of UNAM and CRP/MEX08-02 from the International Centre for Genetic Engineering and Biotechnology (ICGEB) (D.G.); and in part by the Eunice Kennedy Shriver National Institute of Child Health and Human Development intramural program of the NIH (M.C.). We also thank Helen Murphy for pHM1684. We would like to express our gratitude to William Farmerie at the University of Florida ICBR for 454 Sequencing of cDNA from CsrA-bound RNA.
References
- Aberg A, Fernandez-Vazquez J, Cabrer-Panes JD, Sanchez A, Balsalobre C. Similar and divergent effects of ppGpp and DksA deficiencies on transcription in Escherichia coli. J Bacteriol. 2009;191:3226–3236. doi: 10.1128/JB.01410-08. [DOI] [PMC free article] [PubMed] [Google Scholar]
- Aberg A, Shingler V, Balsalobre C. Regulation of the fimB promoter: a case of differential regulation by ppGpp and DksA in vivo. Mol Microbiol. 2008;67:1223–1241. doi: 10.1111/j.1365-2958.2008.06115.x. [DOI] [PubMed] [Google Scholar]
- Babitzke P, Baker CS, Romeo T. Regulation of translational initiation by RNA binding proteins. Annu Rev Microbiol. 2009;63:27–44. doi: 10.1146/annurev.micro.091208.073514. [DOI] [PMC free article] [PubMed] [Google Scholar]
- Babitzke P, Romeo T. CsrB sRNA family: sequestration of RNA-binding regulatory proteins. Curr Opin Microbiol. 2007;10:156–163. doi: 10.1016/j.mib.2007.03.007. [DOI] [PubMed] [Google Scholar]
- Babitzke P, Stults JT, Shire SJ, Yanofsky C. TRAP, the trp RNA-binding attenuation protein of Bacillus subtilis, is a multisubunit complex that appears to recognize G/UAG repeats in the trpEDCFBA and trpG transcripts. J Biol Chem. 1994;269:16597–16604. [PubMed] [Google Scholar]
- Baker CS, Eory LA, Yakhnin H, Mercante J, Romeo T, Babitzke P. CsrA inhibits translation initiation of Escherichia coli hfq by binding to a single site overlapping the Shine-Dalgarno sequence. J Bacteriol. 2007;189:5472–5481. doi: 10.1128/JB.00529-07. [DOI] [PMC free article] [PubMed] [Google Scholar]
- Baker CS, Morozov I, Suzuki K, Romeo T, Babitzke P. CsrA regulates glycogen biosynthesis by preventing translation of glgC in Escherichia coli. Mol Microbiol. 2002;44:1599–1610. doi: 10.1046/j.1365-2958.2002.02982.x. [DOI] [PubMed] [Google Scholar]
- Barker MM, Gaal T, Josaitis LA, Gourse RL. Mechanism of regulation of transcription initiation by ppGpp. I. Effects of ppGpp on transcription initiation in vivo and in vitro. J Mol Biol. 2001;305:673–688. doi: 10.1006/jmbi.2000.4327. [DOI] [PubMed] [Google Scholar]
- Becskei A, Serrano L. Engineering stability in gene networks by autoregulation. Nature. 2000;405:590–593. doi: 10.1038/35014651. [DOI] [PubMed] [Google Scholar]
- Beisel CL, Storz G. Base pairing small RNAs and their roles in global regulatory networks. FEMS Microbiol Rev. doi: 10.1111/j.1574-6976.2010.00241.x. [DOI] [PMC free article] [PubMed] [Google Scholar]
- Bhatt S, Edwards AN, Nguyen HT, Merlin D, Romeo T, Kalman D. The RNA binding protein CsrA is a pleiotropic regulator of the locus of enterocyte effacement pathogenicity island of enteropathogenic Escherichia coli. Infect Immun. 2009;77:3552–3568. doi: 10.1128/IAI.00418-09. [DOI] [PMC free article] [PubMed] [Google Scholar]
- Boyd D, Weiss DS, Chen JC, Beckwith J. Towards single-copy gene expression systems making gene cloning physiologically relevant: lambda InCh, a simple Escherichia coli plasmid-chromosome shuttle system. J Bacteriol. 2000;182:842–847. doi: 10.1128/jb.182.3.842-847.2000. [DOI] [PMC free article] [PubMed] [Google Scholar]
- Brencic A, Lory S. Determination of the regulon and identification of novel mRNA targets of Pseudomonas aeruginosa RsmA. Mol Microbiol. 2009;72:612–632. doi: 10.1111/j.1365-2958.2009.06670.x. [DOI] [PMC free article] [PubMed] [Google Scholar]
- Brown L, Gentry D, Elliott T, Cashel M. DksA affects ppGpp induction of RpoS at a translational level. J Bacteriol. 2002;184:4455–4465. doi: 10.1128/JB.184.16.4455-4465.2002. [DOI] [PMC free article] [PubMed] [Google Scholar]
- Burrowes E, Baysse C, Adams C, O'Gara F. Influence of the regulatory protein RsmA on cellular functions in Pseudomonas aeruginosa PAO1, as revealed by transcriptome analysis. Microbiology. 2006;152:405–418. doi: 10.1099/mic.0.28324-0. [DOI] [PubMed] [Google Scholar]
- Cashel M, Gallant J. Two compounds implicated in the function of the RC gene of Escherichia coli. Nature. 1969;221:838–841. doi: 10.1038/221838a0. [DOI] [PubMed] [Google Scholar]
- Cashel M, Gentry D, Hernandez VJ, Vinella D. The stringent response. In: Neidhardt FC, et al., editors. Escherichia coli and Salmonella: Cellular and Molecular Biology. Washington, D.C.: ASM Press; 1996. pp. 1458–1496. [Google Scholar]
- Chavez RG, Alvarez AF, Romeo T, Georgellis D. The physiological stimulus for the BarA sensor kinase. J Bacteriol. 2010;192:2009–2012. doi: 10.1128/JB.01685-09. [DOI] [PMC free article] [PubMed] [Google Scholar]
- Churchward G, Belin D, Nagamine Y. A pSC101-derived plasmid which shows no sequence homology to other commonly used cloning vectors. Gene. 1984;31:165–171. doi: 10.1016/0378-1119(84)90207-5. [DOI] [PubMed] [Google Scholar]
- Costanzo A, Nicoloff H, Barchinger SE, Banta AB, Gourse RL, Ades SE. ppGpp and DksA likely regulate the activity of the extracytoplasmic stress factor sigmaE in Escherichia coli by both direct and indirect mechanisms. Mol Microbiol. 2008;67:619–632. doi: 10.1111/j.1365-2958.2007.06072.x. [DOI] [PubMed] [Google Scholar]
- Cui Y, Chatterjee A, Liu Y, Dumenyo CK, Chatterjee AK. Identification of a global repressor gene, rsmA, of Erwinia carotovora subsp. carotovora that controls extracellular enzymes, N-(3-oxohexanoyl)-L-homoserine lactone, and pathogenicity in soft-rotting Erwinia spp. J Bacteriol. 1995;177:5108–5115. doi: 10.1128/jb.177.17.5108-5115.1995. [DOI] [PMC free article] [PubMed] [Google Scholar]
- Da Costa XJ, Artz SW. Mutations that render the promoter of the histidine operon of Salmonella typhimurium insensitive to nutrient-rich medium repression and amino acid downshift. J Bacteriol. 1997;179:5211–5217. doi: 10.1128/jb.179.16.5211-5217.1997. [DOI] [PMC free article] [PubMed] [Google Scholar]
- Dalebroux ZD, Svensson SL, Gaynor EC, Swanson MS. ppGpp conjures bacterial virulence. Microbiol Mol Biol Rev. 2010;74:171–199. doi: 10.1128/MMBR.00046-09. [DOI] [PMC free article] [PubMed] [Google Scholar]
- Dubey AK, Baker CS, Romeo T, Babitzke P. RNA sequence and secondary structure participate in high-affinity CsrA-RNA interaction. RNA. 2005;11:1579–1587. doi: 10.1261/rna.2990205. [DOI] [PMC free article] [PubMed] [Google Scholar]
- Dubey AK, Baker CS, Suzuki K, Jones AD, Pandit P, Romeo T, Babitzke P. CsrA regulates translation of the Escherichia coli carbon starvation gene, cstA, by blocking ribosome access to the cstA transcript. J Bacteriol. 2003;185:4450–4460. doi: 10.1128/JB.185.15.4450-4460.2003. [DOI] [PMC free article] [PubMed] [Google Scholar]
- Fortune DR, Suyemoto M, Altier C. Identification of CsrC and characterization of its role in epithelial cell invasion in Salmonella enterica serovar Typhimurium. Infect Immun. 2006;74:331–339. doi: 10.1128/IAI.74.1.331-339.2006. [DOI] [PMC free article] [PubMed] [Google Scholar]
- Gentry D, Bengra C, Ikehara K, Cashel M. Guanylate kinase of Escherichia coli K-12. J Biol Chem. 1993;268:14316–14321. [PubMed] [Google Scholar]
- Gong L, Takayama K, Kjelleberg S. Role of spoT-dependent ppGpp accumulation in the survival of light-exposed starved bacteria. Microbiology. 2002;148:559–570. doi: 10.1099/00221287-148-2-559. [DOI] [PubMed] [Google Scholar]
- Goodman AL, Kulasekara B, Rietsch A, Boyd D, Smith RS, Lory S. A signaling network reciprocally regulates genes associated with acute infection and chronic persistence in Pseudomonas aeruginosa. Dev Cell. 2004;7:745–754. doi: 10.1016/j.devcel.2004.08.020. [DOI] [PubMed] [Google Scholar]
- Goodman AL, Merighi M, Hyodo M, Ventre I, Filloux A, Lory S. Direct interaction between sensor kinase proteins mediates acute and chronic disease phenotypes in a bacterial pathogen. Genes Dev. 2009;23:249–259. doi: 10.1101/gad.1739009. [DOI] [PMC free article] [PubMed] [Google Scholar]
- Gottesman S. Bacterial regulation: global regulatory networks. Annu Rev Genet. 1984;18:415–441. doi: 10.1146/annurev.ge.18.120184.002215. [DOI] [PubMed] [Google Scholar]
- Gudapaty S, Suzuki K, Wang X, Babitzke P, Romeo T. Regulatory interactions of Csr components: the RNA binding protein CsrA activates csrB transcription in Escherichia. J Bacteriol. 2001;183:6017–6027. doi: 10.1128/JB.183.20.6017-6027.2001. [DOI] [PMC free article] [PubMed] [Google Scholar]
- Haldimann A, Wanner BL. Conditional-replication, integration, excision, and retrieval plasmid-host systems for gene structure-function studies of bacteria. J Bacteriol. 2001;183:6384–6393. doi: 10.1128/JB.183.21.6384-6393.2001. [DOI] [PMC free article] [PubMed] [Google Scholar]
- Hirsch M, Elliott T. Role of ppGpp in rpoS stationary-phase regulation in Escherichia coli. J Bacteriol. 2002;184:5077–5087. doi: 10.1128/JB.184.18.5077-5087.2002. [DOI] [PMC free article] [PubMed] [Google Scholar]
- Jackson DW, Suzuki K, Oakford L, Simecka JW, Hart ME, Romeo T. Biofilm formation and dispersal under the influence of the global regulator CsrA of Escherichia coli. J Bacteriol. 2002;184:290–301. doi: 10.1128/JB.184.1.290-301.2002. [DOI] [PMC free article] [PubMed] [Google Scholar]
- Jonas K, Edwards AN, Simm R, Romeo T, Romling U, Melefors O. The RNA binding protein CsrA controls cyclic di-GMP metabolism by directly regulating the expression of GGDEF proteins. Mol Microbiol. 2008;70:236–257. doi: 10.1111/j.1365-2958.2008.06411.x. [DOI] [PMC free article] [PubMed] [Google Scholar]
- Jonas K, Melefors O. The Escherichia coli CsrB and CsrC small RNAs are strongly induced during growth in nutrient-poor medium. FEMS Microbiol Lett. 2009;297:80–86. doi: 10.1111/j.1574-6968.2009.01661.x. [DOI] [PubMed] [Google Scholar]
- Kang PJ, Craig EA. Identification and characterization of a new Escherichia coli gene that is a dosage-dependent suppressor of a dnaK deletion mutation. J Bacteriol. 1990;172:2055–2064. doi: 10.1128/jb.172.4.2055-2064.1990. [DOI] [PMC free article] [PubMed] [Google Scholar]
- Keasling JD, Bertsch L, Kornberg A. Guanosine pentaphosphate phosphohydrolase of Escherichia coli is a long-chain exopolyphosphatase. Proc Natl Acad Sci U S A. 1993;90:7029–7033. doi: 10.1073/pnas.90.15.7029. [DOI] [PMC free article] [PubMed] [Google Scholar]
- Lawhon SD, Frye JG, Suyemoto M, Porwollik S, McClelland M, Altier C. Global regulation by CsrA in Salmonella typhimurium. Mol Microbiol. 2003;48:1633–1645. doi: 10.1046/j.1365-2958.2003.03535.x. [DOI] [PubMed] [Google Scholar]
- Lemke JJ, Durfee T, Gourse RL. DksA and ppGpp directly regulate transcription of the Escherichia coli flagellar cascade. Mol Microbiol. 2009;74:1368–1379. doi: 10.1111/j.1365-2958.2009.06939.x. [DOI] [PMC free article] [PubMed] [Google Scholar]
- Lenz DH, Miller MB, Zhu J, Kulkarni RV, Bassler BL. CsrA and three redundant small RNAs regulate quorum sensing in Vibrio cholerae. Mol Microbiol. 2005;58:1186–1202. doi: 10.1111/j.1365-2958.2005.04902.x. [DOI] [PubMed] [Google Scholar]
- Liu MY, Gui G, Wei B, Preston JF, 3rd, Oakford L, Yuksel U, Giedroc DP, Romeo T. The RNA molecule CsrB binds to the global regulatory protein CsrA and antagonizes its activity in Escherichia coli. J Biol Chem. 1997;272:17502–17510. doi: 10.1074/jbc.272.28.17502. [DOI] [PubMed] [Google Scholar]
- Liu MY, Romeo T. The global regulator CsrA of Escherichia coli is a specific mRNA-binding protein. J Bacteriol. 1997;179:4639–4642. doi: 10.1128/jb.179.14.4639-4642.1997. [DOI] [PMC free article] [PubMed] [Google Scholar]
- Liu MY, Yang H, Romeo T. The product of the pleiotropic Escherichia coli gene csrA modulates glycogen biosynthesis via effects on mRNA stability. J Bacteriol. 1995;177:2663–2672. doi: 10.1128/jb.177.10.2663-2672.1995. [DOI] [PMC free article] [PubMed] [Google Scholar]
- Livak KJ, Schmittgen TD. Analysis of relative gene expression data using real-time quantitative PCR and the 2(-Delta Delta C(T)) Method. Methods. 2001;25:402–408. doi: 10.1006/meth.2001.1262. [DOI] [PubMed] [Google Scholar]
- Lyzen R, Kochanowska M, Wegrzyn G, Szalewska-Palasz A. Transcription from bacteriophage lambda pR promoter is regulated independently and antagonistically by DksA and ppGpp. Nucleic Acids Res. 2009;37:6655–6664. doi: 10.1093/nar/gkp676. [DOI] [PMC free article] [PubMed] [Google Scholar]
- Magnusson LU, Gummesson B, Joksimovic P, Farewell A, Nystrom T. Identical, independent, and opposing roles of ppGpp and DksA in Escherichia coli. J Bacteriol. 2007;189:5193–5202. doi: 10.1128/JB.00330-07. [DOI] [PMC free article] [PubMed] [Google Scholar]
- Margulies M, Egholm M, Altman WE, Attiya S, Bader JS, Bemben LA, Berka J, Braverman MS, Chen YJ, Chen Z, Dewell SB, Du L, Fierro JM, Gomes XV, Godwin BC, He W, Helgesen S, Ho CH, Irzyk GP, Jando SC, Alenquer ML, Jarvie TP, Jirage KB, Kim JB, Knight JR, Lanza JR, Leamon JH, Lefkowitz SM, Lei M, Li J, Lohman KL, Lu H, Makhijani VB, McDade KE, McKenna MP, Myers EW, Nickerson E, Nobile JR, Plant R, Puc BP, Ronan MT, Roth GT, Sarkis GJ, Simons JF, Simpson JW, Srinivasan M, Tartaro KR, Tomasz A, Vogt KA, Volkmer GA, Wang SH, Wang Y, Weiner MP, Yu P, Begley RF, Rothberg JM. Genome sequencing in microfabricated high-density picolitre reactors. Nature. 2005;437:376–380. doi: 10.1038/nature03959. [DOI] [PMC free article] [PubMed] [Google Scholar]
- Mercante J, Suzuki K, Cheng X, Babitzke P, Romeo T. Comprehensive alanine-scanning mutagenesis of Escherichia coli CsrA defines two subdomains of critical functional importance. J Biol Chem. 2006;281:31832–31842. doi: 10.1074/jbc.M606057200. [DOI] [PubMed] [Google Scholar]
- Merrikh H, Ferrazzoli AE, Lovett ST. Growth phase and (p)ppGpp control of IraD, a regulator of RpoS stability, in Escherichia coli. J Bacteriol. 2009;191:7436–7446. doi: 10.1128/JB.00412-09. [DOI] [PMC free article] [PubMed] [Google Scholar]
- Metzger S, Dror IB, Aizenman E, Schreiber G, Toone M, Friesen JD, Cashel M, Glaser G. The nucleotide sequence and characterization of the relA gene of Escherichia coli. J Biol Chem. 1988;263:15699–15704. [PubMed] [Google Scholar]
- Miller JJ. Experiments in molecular genetics. Cold Spring Harbor, N.Y: Cold Spring Harbor Laboratory,; 1972. p. 466. p. xvi, [Google Scholar]
- Nakagawa A, Oshima T, Mori H. Identification and characterization of a second, inducible promoter of relA in Escherichia coli. Genes Genet Syst. 2006;81:299–310. doi: 10.1266/ggs.81.299. [DOI] [PubMed] [Google Scholar]
- Nevozhay D, Adams RM, Murphy KF, Josic K, Balazsi G. Negative autoregulation linearizes the dose-response and suppresses the heterogeneity of gene expression. Proc Natl Acad Sci U S A. 2009;106:5123–5128. doi: 10.1073/pnas.0809901106. [DOI] [PMC free article] [PubMed] [Google Scholar]
- Paul BJ, Barker MM, Ross W, Schneider DA, Webb C, Foster JW, RL.Gourse RL. DksA: a critical component of the transcription initiation machinery that potentiates the regulation of rRNA promoters by ppGpp and the initiating NTP. Cell. 2004;118:311–322. doi: 10.1016/j.cell.2004.07.009. [DOI] [PubMed] [Google Scholar]
- Paul BJ, M. B. Berkmen MB, RL.Gourse RL. DksA potentiates direct activation of amino acid promoters by ppGpp. Proc Natl Acad Sci U S A. 2005;102:7823–7828. doi: 10.1073/pnas.0501170102. [DOI] [PMC free article] [PubMed] [Google Scholar]
- Perederina A, V. Svetlov V, M. N. Vassylyeva MN, T. H. Tahirov TH, S. Yokoyama S, I. Artsimovitch I, DG. Vassylyev DG. Regulation through the secondary channel--structural framework for ppGpp-DksA synergism during transcription. Cell. 2004;118:297–309. doi: 10.1016/j.cell.2004.06.030. [DOI] [PubMed] [Google Scholar]
- Pernestig AK, Melefors O, Georgellis D. Identification of UvrY as the cognate response regulator for the BarA sensor kinase in Escherichia coli. J Biol Chem. 2001;276:225–231. doi: 10.1074/jbc.M001550200. [DOI] [PubMed] [Google Scholar]
- Potrykus K, Cashel M. (p)ppGpp: still magical? Annu Rev Microbiol. 2008;62:35–51. doi: 10.1146/annurev.micro.62.081307.162903. [DOI] [PubMed] [Google Scholar]
- Potrykus K, Murphy H, Chen X, Epstein JA, Cashel M. Imprecise transcription termination within Escherichia coli greA leader gives rise to an array of short transcripts, GraL. Nucleic Acids Res. 2010a;38:1636–1651. doi: 10.1093/nar/gkp1150. [DOI] [PMC free article] [PubMed] [Google Scholar]
- Potrykus K, Murphy H, Philippe N, Cashel M. ppGpp is the major source of growth rate control in E. coli. Environ Microbiol. 2010b doi: 10.1111/j.1462-2920.2010.02357.x. [DOI] [PMC free article] [PubMed] [Google Scholar]
- Romeo T, Preiss J. Genetic regulation of glycogen biosynthesis in Escherichia coli: in vitro effects of cyclic AMP and guanosine 5'-diphosphate 3'-diphosphate and analysis of in vivo transcripts. J. Bacteriol. 1989;171:2773–2782. doi: 10.1128/jb.171.5.2773-2782.1989. [DOI] [PMC free article] [PubMed] [Google Scholar]
- Romeo T, Gong M, Liu MY, Brun-Zinkernagel AM. Identification and molecular characterization of csrA, a pleiotropic gene from Escherichia coli that affects glycogen biosynthesis, gluconeogenesis, cell size, and surface properties. J Bacteriol. 1993;175:4744–4755. doi: 10.1128/jb.175.15.4744-4755.1993. [DOI] [PMC free article] [PubMed] [Google Scholar]
- Romeo T, Black J, Preiss J. Genetic regulation of glycogen synthesis in Escherichia coli: in vivo effects of the catabolite repression and stringent response systems in glg gene expression. Curr. Microbiol. 1990;21:131–137. [Google Scholar]
- Rosenfeld N, Elowitz MB, Alon U. Negative autoregulation speeds the response times of transcription networks. J Mol Biol. 2002;323:785–793. doi: 10.1016/s0022-2836(02)00994-4. [DOI] [PubMed] [Google Scholar]
- Rutherford ST, Lemke JJ, Vrentas CE, Gaal T, Ross W, Gourse RL. Effects of DksA, GreA, and GreB on transcription initiation: insights into the mechanisms of factors that bind in the secondary channel of RNA polymerase. J Mol Biol. 2007;366:1243–1257. doi: 10.1016/j.jmb.2006.12.013. [DOI] [PMC free article] [PubMed] [Google Scholar]
- Sabnis NA, Yang H, Romeo T. Pleiotropic regulation of central carbohydrate metabolism in Escherichia coli via the gene csrA. J Biol Chem. 1995;270:29096–29104. doi: 10.1074/jbc.270.49.29096. [DOI] [PubMed] [Google Scholar]
- Schubert M, Lapouge K, Duss O, Oberstrass FC, Jelesarov I, Haas D, Allain FH. Molecular basis of messenger RNA recognition by the specific bacterial repressing clamp RsmA/CsrA. Nat Struct Mol Biol. 2007;14:807–813. doi: 10.1038/nsmb1285. [DOI] [PubMed] [Google Scholar]
- Schultz JE, Matin A. Molecular and functional characterization of a carbon starvation gene of Escherichia coli. J Mol Biol. 1991;218:129–140. doi: 10.1016/0022-2836(91)90879-b. [DOI] [PubMed] [Google Scholar]
- Seyfzadeh M, Keener J, Nomura M. spoT-dependent accumulation of guanosine tetraphosphate in response to fatty acid starvation in Escherichia coli. Proc Natl Acad Sci U S A. 1993;90:11004–11008. doi: 10.1073/pnas.90.23.11004. [DOI] [PMC free article] [PubMed] [Google Scholar]
- Suzuki K, Babitzke P, Kushner SR, Romeo T. Identification of a novel regulatory protein (CsrD) that targets the global regulatory RNAs CsrB and CsrC for degradation by RNase E. Genes Dev. 2006;20:2605–2617. doi: 10.1101/gad.1461606. [DOI] [PMC free article] [PubMed] [Google Scholar]
- Suzuki K, Wang X, Weilbacher T, Pernestig AK, Melefors O, Georgellis D, Babitzke P, Romeo T. Regulatory circuitry of the CsrA/CsrB and BarA/UvrY systems of Escherichia coli. J Bacteriol. 2002;184:5130–5140. doi: 10.1128/JB.184.18.5130-5140.2002. [DOI] [PMC free article] [PubMed] [Google Scholar]
- Ventre I, Goodman AL, Vallet-Gely I, Vasseur P, Soscia C, Molin S, Bleves S, Lazdunski A, Lory S, Filloux A. Multiple sensors control reciprocal expression of Pseudomonas aeruginosa regulatory RNA and virulence genes. Proc Natl Acad Sci U S A. 2006;103:171–176. doi: 10.1073/pnas.0507407103. [DOI] [PMC free article] [PubMed] [Google Scholar]
- Vinella D, Albrecht C, Cashel M, D'Ari R. Iron limitation induces SpoT-dependent accumulation of ppGpp in Escherichia coli. Mol Microbiol. 2005;56:958–970. doi: 10.1111/j.1365-2958.2005.04601.x. [DOI] [PubMed] [Google Scholar]
- Wanner BL, Kodiara R, Neidhardt FC. Physiological regulation of a decontrolled lac operon. J. Bacteriol. 1977;130:212–222. doi: 10.1128/jb.130.1.212-222.1977. [DOI] [PMC free article] [PubMed] [Google Scholar]
- Wang X, Dubey AK, Suzuki K, Baker CS, Babitzke P, Romeo T. CsrA post-transcriptionally represses pgaABCD, responsible for synthesis of a biofilm polysaccharide adhesin of Escherichia coli. Mol Microbiol. 2005;56:1648–1663. doi: 10.1111/j.1365-2958.2005.04648.x. [DOI] [PubMed] [Google Scholar]
- Wei BL, Brun-Zinkernagel AM, Simecka JW, Pruss BM, Babitzke P, Romeo T. Positive regulation of motility and flhDC expression by the RNA-binding protein CsrA of Escherichia coli. Mol Microbiol. 2001;40:245–256. doi: 10.1046/j.1365-2958.2001.02380.x. [DOI] [PubMed] [Google Scholar]
- Weilbacher T, Suzuki K, Dubey AK, Wang X, Gudapaty S, Morozov I, Baker CS, Georgellis D, Babitzke P, Romeo T. A novel sRNA component of the carbon storage regulatory system of Escherichia coli. Mol Microbiol. 2003;48:657–670. doi: 10.1046/j.1365-2958.2003.03459.x. [DOI] [PubMed] [Google Scholar]
- Wendrich TM, Blaha G, Wilson DN, Marahiel MA, Nierhaus KH. Dissection of the mechanism for the stringent factor RelA. Mol Cell. 2002;10:779–788. doi: 10.1016/s1097-2765(02)00656-1. [DOI] [PubMed] [Google Scholar]
- White D, Hart ME, Romeo T. Phylogenetic distribution of the global regulatory gene csrA among eubacteria. Gene. 1996;182:221–223. doi: 10.1016/s0378-1119(96)00547-1. [DOI] [PubMed] [Google Scholar]
- Yakhnin AV, Trimble JJ, Chiaro CR, Babitzke P. Effects of mutations in the L-tryptophan binding pocket of the Trp RNA-binding attenuation protein of Bacillus subtilis. J Biol Chem. 2000;275:4519–4524. doi: 10.1074/jbc.275.6.4519. [DOI] [PubMed] [Google Scholar]
- Yakhnin H, Pandit P, Petty TJ, Baker CS, Romeo T, Babitzke P. CsrA of Bacillus subtilis regulates translation initiation of the gene encoding the flagellin protein (hag) by blocking ribosome binding. Mol Microbiol. 2007;64:1605–1620. doi: 10.1111/j.1365-2958.2007.05765.x. [DOI] [PubMed] [Google Scholar]
- Yang H, Liu MY, Romeo T. Coordinate genetic regulation of glycogen catabolism and biosynthesis in Escherichia coli via the CsrA gene product. J Bacteriol. 1996;178:1012–1017. doi: 10.1128/jb.178.4.1012-1017.1996. [DOI] [PMC free article] [PubMed] [Google Scholar]
Associated Data
This section collects any data citations, data availability statements, or supplementary materials included in this article.