

Abstract
The metabolic stability of a drug is an important property that should be optimized during drug design and development. Nitrogen incorporation is hypothesized to increase the stability by coordination of nitrogen to the heme iron of cytochrome P450, a binding mode that is referred to as type II binding. However, we noticed that the type II binding compound 1 has less metabolic stability at subsaturating conditions than a closely related type I binding compound 3. Three kinetic models will be presented for type II binder metabolism; 1) Dead-end type II binding, 2) a rapid equilibrium between type I and II binding modes before reduction, and 3) a direct reduction of the type II coordinated heme. Data will be presented on reduction rates of iron, the off rates of substrate (using surface plasmon resonance) and the catalytic rate constants. These data argue against the dead-end, and rapid equilibrium models, leaving the direct reduction kinetic mechanism for metabolism of the type II binding compound 1.
Introduction
Cytochrome P450 (CYP) enzymes are heme-containing mono-oxygenases that metabolize endogenous as well as exogenous compounds in plants, bacteria, and mammals. In mammals, P450 enzymes carry out the biotransformation of several biomolecules such as bile acids, biogenic amines, fatty acids, and steroids. This family of enzymes plays a large role in metabolism of drugs, and more importantly can be a major factor in failures in drug development 1. Among the 57 known CYP enzymes in humans, Cytochrome P450 3A4 (CYP3A4) is the most abundantly expressed isoform in liver, and comprises as much as 60% of the total CYP protein found in the liver 2,3. CYP3A4 contributes to the metabolism of more than 50% of marketed drugs and has been implicated in numerous drug-drug interactions.
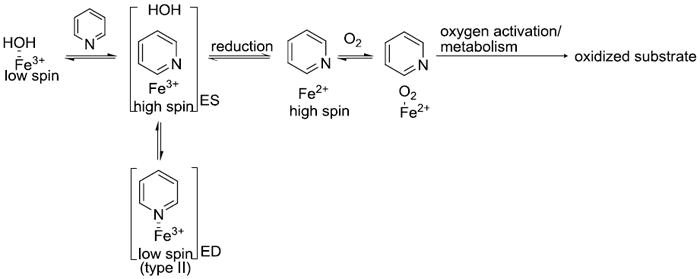
Metabolic instability is a considerable liability in a drug candidate, resulting in low bioavailability and high clearance in vivo. Redesign of molecules to eliminate metabolic hot spots often leads to loss of potency towards the target. However, it has been shown that a relatively minor change, incorporation of an sp2-hybridized nitrogen into an aromatic ring, can lead to greater metabolic stability 4,5. Replacement of a phenyl ring with pyridine, introduces metabolic stability on the ring by decreasing electron density on the aromatic carbons. In addition, incorporation of the sp2 nitrogen is thought to inhibit overall metabolism through coordination of the nitrogen to the heme-iron (type II binding). In wild type CYP enzymes, a water molecule is coordinated to the low-spin ferric heme-iron. Substrate binding to the active site of the enzyme converts low-spin ferric-iron to high-spin ferric-iron. Compounds containing nitrogen in an aromatic ring displace the water molecule and nitrogen-iron (III) coordination takes place (Figure 1). This coordination of low spin ferric iron with aromatic nitrogen is termed type II binding. It is hypothesized that type II binding slows down the catalytic cycle by trapping the ferric iron in low–spin state forming a dead-end complex (Figure 1) which cannot be reduced by CYP reductase to initiate the catalytic cycle 4,5.
Figure 1.
Kinetics Model for Cytochrome P450
Recently, we have developed a number of structurally related quinoline carboxamide compounds to determine the amount of energy associated with nitrogen coordination to the heme iron of P450 6,7. These compounds are related through a common core, varying only in the position of nitrogen in a single aromatic ring. We found that type II binding interactions account for up to a 4,200 fold difference in binding affinity within a structurally related series. In addition, we also found that even high affinity type II binding compounds could be extensively metabolized by CYP3A4 6. Herein we use the tightest binding type II ligand (Compound 1 in Figure 2) from all the analogs used by Peng et al 6 to exclude the rapid equilibrium, and dead-end kinetic model, leaving direct reduction of the type II binding complex as the best kinetic model for metabolism of compound 1.
Figure 2.
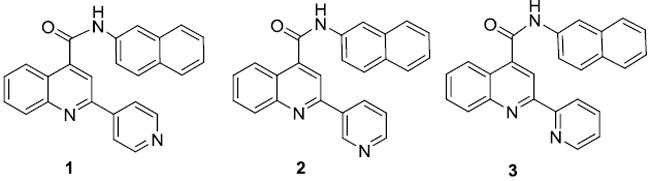
Quiniline-4-carboxamide analogs
Materials and Methods
Solvents and chemicals were purchased from Aldrich (St. Louis, MO), Fisher Scientific (Pittsburgh, PA), EMD (Gibbstown, NJ), and Mallinckrodt Baker (Phillipsburg, NJ) and used without purification. Baculosomes were supplied by Invitrogen (Carlsbad, CA). 1H NMR spectra were obtained on a 300 MHz spectrometer equipped with a quad-detection probe (1H, 13C, 31P, and 19F). 1H-decoupled 13C NMR were obtained at 75 MHz. Mass spectrometry was performed on as ThermoQuest Surveyor coupled to a Thermo-Finnegan LCQ advantage ESI-MS.
SYNTHESIS OF COMPOUNDS 1M1, 2M1, AND 3M1
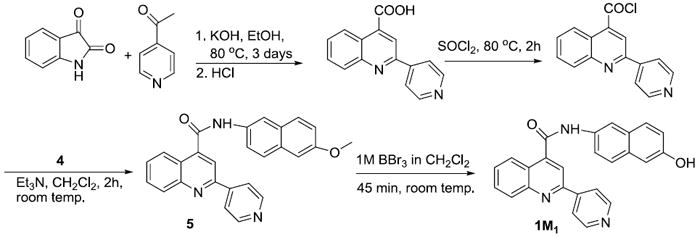
Metabolites for compounds 1, 2, and 3 were synthesized using the procedure developed earlier in our lab 7. A general synthetic procedure for metabolites is shown in Scheme 1 and 2 using 1M1 as an example.
Scheme 1.
Scheme 2.
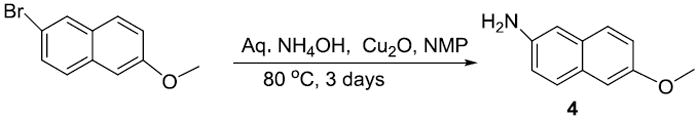
6-methoxynaphthalen-2-amine (4)
A 100 mL reaction vessel was charged with copper (I) oxide (143 mg, 10 mmol), 2-bromo-6-methoxynaphthalene (4.74 g, 20 mmol), 40 mL N-methyl pyrrolidinone (NMP), 13 mL aqueous ammonium hydroxide solution (29% NH3, 200 mmol) and a magnetic stir bar. The vessel was sealed with a Teflon screw cap and immersed in an oil bath (80 ° C) and was stirred until reaction completed. The reaction was monitored by TLC. Upon completion of reaction in three days, the reaction mixture was cooled to room temperature and quenched with 100 mL water and solvent extracted with diethyl ether (3*100 mL). The organic phase was dried over magnesium sulfate and solvent evaporated with a rotary evaporator. The solid obtained was crystallized in 25% ethyl acetate/hexanes to get 3.05 g (88% isolated yield) pure product. 1H NMR (CDCl3) δ 3.73 (s, 2H), 3.88 (s, 3H), 6.92 - 6.97 (m, 2H), 7.04 – 7.09 (m, 2H), 7.51 (d, J = 8.7 Hz, 1H), 7.57 (d, J = 8.4 Hz, 1H); ESI-MS, [M+H]+ = 174.1.
The general procedure for synthesis of quinoline-4-carboxamide analog using compound N-(6-methoxynaphthalen-2-yl)-2-(pyridin-4-yl)quinoline-4-carboxamide (5) as an example: To a 100 mL round-bottom flask equipped with a water condenser and stir bar potassium hydroxide (842 mg, 15 mmol) and ethanol (5 mL) was added. The reaction mixture was stirred at 80 ° C to dissolve the potassium hydroxide. Isatin (736 mg, 5 mmol) was added to the reaction mixture followed by drop wise addition of 4-acetylpyridine (666 mg, 5.5 mmol). The mixture was refluxed at 80 ° C for 3 days. Then the solvent was evaporated using a rotary evaporator. The residue was dissolved in 50 mL water. The aqueous phase was neutralized by drop-wise addition of 1N HCl to pH ~6. The resulting solid was collected by vacuum filtration to get crude 2-phenylquinoline-4-carboxylic acid. Crude 2-(pyridin-4-yl)quinoline-4-carboxylic acid was used to synthesize the acyl chloride. The crude acid and 5 mL neat thionyl chloride was added to a 50 mL round-bottom flask equipped with water condenser and stir bar. The solution was refluxed at 80 ° C. After 2 hrs excess thionyl chloride was evaporated using a stream of argon to isoloate the 2-(pyridin-4-yl)quinoline-4-carbonyl chloride. The resulting solid was dissolved in 5:1 mixture of dichloromethane/triethylamine (10mL) in a 50 mL round-bottom flask and 6-methoxynaphthalen-2-amine(4) (952mg, 5.5 mmol) was added. The reaction mixture was stirred at room temperature. After 2 hrs the solvent was removed by rotary evaporation and the crude product was purified by flash chromatography (30 g silica gel 60, 0.063-0.200 mm) using 70% ethyl acetate in dichloromethane. The product was crystallized in dichloromethane/ethanol to get pure N-(6-methoxynaphthalen-2-yl)-2-(pyridin-4-yl)quinoline-4-carboxamide. The overall isolated yield was 54%. 1H NMR (DMSO) δ 3.87 (s, 3H), 7.17 (dd, J = 9.1, 2.6 Hz, 1H), 7.31 (d, J = 2.4 Hz, 1H), 7.71 - 7.76 (m, 2H), 7.82 - 7.93 (m, 3H), 8.21 - 8.26 (m, 2H), 8.33 (dd, J = 4.7, 1.6 Hz, 2H), 8.47 (d, J = 1.7 Hz, 1H), 8.52 (s, 1H), 8.79 (dd, J = 4.7, 1.6 Hz, 2H), 10.97 (s, 1H); 13C NMR (DMSO) δ 55.86, 106.63, 117.45, 117.63, 119.84, 121.55, 122.06, 124.65, 125.93, 127.98, 129.04, 129.21, 129.76, 130.61, 131.43, 132.12, 135.10, 144.25, 145.69, 148.58, 151.25, 154.22, 157.45, 165.76; ESI-MS, [M+H]+ = 406.3.
N-(6-methoxynaphthalen-2-yl)-2-(pyridin-3-yl)quinoline-4-carboxamide(6)
The reaction conditions were the same as described above for compound 5 but 4-acetylpyridine was substituted by 3-acetylpyridine and 33% EtOAc/CH2Cl2 was used as the flash chromatography solvent. The overall purified yield was 41%. 1H NMR (DMSO) δ 3.89 (s, 3H), 7.19 (dd, J = 8.8, 2.6 Hz, 1H), 7.33 (d, J = 2.4 Hz, 1H), 7.61 - 7.66 (m, 1H), 7.70 – 7.77 (m, 2H), 7.84 – 7.93 (m, 3H), 8.24 (t, J = 8.4 Hz, 2H), 8.49 (d, J = 2.1 Hz, 1H), 8.52 (s, 1H), 8.72 – 8.76 (m, 2H), 9.56 (d, J = 1.2 Hz, 1H), 10.97 (s, 1H); 13C NMR (DMSO) δ 55.86, 106.63, 116.89, 117.43, 117.62, 119.83, 121.57, 124.16, 124.66, 125.91, 127.95, 128.55, 129.21, 129.75, 130.41, 131.27, 132.10, 135.13, 135.42, 144.05, 148.64, 149.24, 151.39, 154.53, 157.44, 165.82; ESI-MS, [M+H]+ = 406.3.
N-(6-methoxynaphthalen-2-yl)-2-(pyridin-2-yl)quinoline-4-carboxamide(7)
The reaction conditions were the same as described above for compound 5 but 4-acetylpyridine was substituted by 2-acetylpyridine and 10% EtOAc/CH2Cl2 followed by 33% EtOAc/CH2Cl2 was used as the flash chromatography solvent. The overall yield was 65%. 1H NMR (DMSO) δ 3.89 (s, 3H), 7.20 (dd, J = 9.1, 2.5 Hz, 1H), 7.34 (d, J = 2.4 Hz, 1H), 7.56 - 7.61 (m, 1H), 7.72- - 7.77 (m, 2H), 7.83-7.94 (m, 3H), 8.08 (td, J = 7.8, 1.8 Hz, 1H), 8.23-8.28 (m, 2H), 8.48 (d, J = 2.0 Hz, 1H), 8.68 (dt, J = 8.2, 1.2 Hz, 1H), 8.75 (s, 1H), 8.80-8.82 (m, 1H) 11.06 (s, 1H); 13C NMR (DMSO) δ 58.18, 108.94, 119.32, 119.89, 122.14, 123.93, 124.20, 127.17, 128.12, 128.34, 130.31, 131.11, 131.53, 132.08, 132.80, 133.55, 134.46, 137.37, 140.67, 146.11, 150.71, 152.48, 157.54, 158.15, 159.76, 168.42; ESI-MS, [M+H]+ = 406.2.
N-(6-hydroxynaphthalen-2-yl)-2-(pyridin-4-yl)quinoline-4-carboxamide (1M1)
To the 10 mL solution of 5 (0.36 mmol) in CH2Cl2, boron tribromide (1M in CH2Cl2, 1.1 mL, 1.1 mmol) was added over 2 min with stirring. The reaction mixture was stirred for 45 min at room temperature. The reaction was quenched by saturated sodium hydrogen carbonate to adjust the solution to adjust to pH 8 and extracted with CH2Cl2 (3*30 mL). The combined organic layer was washed with water. The solvent was removed under reduced pressure, and residue was purified by flash chromatography using 30% acetone/dichloromethane. The isolated yield was 45%. 1H NMR (DMSO) δ 7.08, (m, 2H), 7.64 – 7.77 (m, 4H), 7.90 (t, J = 7.6 Hz, 1H), 8.23 (d, J = 8.5 Hz, 2H), 9.33 (d, J = 5.6 Hz, 2H), 8.40 (s, 1H), 8.51 (s, 1H), 8.79 (d, J =5.7 Hz, 2H), 9.69 (s, 1H), 10.90 (s, 1H); 13C NMR (DMSO) δ 109.39, 117.53, 117.61, 119.89, 121.44, 122.06, 124.67, 127.27, 128.34, 129.02, 129.76, 130.47, 131.41, 132.48, 134.32, 144.31, 145.69, 148.57, 151.26, 154.22, 155.51, 165.65; ESI-MS, [M+H]+ = 392.3.
N-(6-hydroxynaphthalen-2-yl)-2-(pyridin-3-yl)quinoline-4-carboxamide (2M1)
Compound 2M1 was prepared using the same method as of compound 1M1 but starting with 6 and 30% acetone/dichloromethane was used as eluent for flash chromatography. The isolated yield was 38%. 1H NMR (DMSO) δ 7.12 (m, 2H), 7.61 – 7.79 (m, 5H), 7.89 (t, J = 7.3 Hz, 1H), 8.23 (t, J = 8.2 Hz, 2H), 8.43 (s, 1H), 8.51 (s, 1H), 8.74 (d, J = 5.6 Hz, 2H), 9.56 (s, 1H), 9.72 (s, 1H), 10.90 (s, 1H); 13C NMR (DMSO) δ 109.40, 117.54, 117.60, 119.89, 121.47, 124.18, 124.66, 125.93, 127.26, 128.34, 128.52, 129.80, 130.40, 131.25, 132.48, 134.30, 134.34, 135.43, 144.09, 148.65, 149.23, 151.37, 154.53, 155.49, 165.73; ESI-MS, [M+H]+ = 392.3.
N-(6-hydroxynaphthalen-2-yl)-2-(pyridin-2-yl)quinoline-4-carboxamide (3M1)
Compound 3M1 was prepared using the same method as of compound 1M1 but starting with 7 and 30% acetone/dichloromethane was used as eluent for flash chromatography. The isolated yield was 48%. 1H NMR (DMSO) δ 7.07 – 7.11 (m, 2H), 7.54 – 7.59 (m, 1H), 7.63 – 7.76 (m, 4H), 7.86 – 7.92 (m, 1H), 8.06 (td, J = 7.7, 1.8 Hz, 1H), 8.21 – 8.25 (m, 2H), 8.40 (d, J = 1.5 Hz, 1H), 8.65 (d, J = 7.8 Hz, 1H), 8.72 (s, 1H), 8.78 (d, J = 4.1 Hz, 1H), 9.71(s, 1H), 10.97 (s, 1H); 13C NMR (DMSO) δ 109.39, 116.99, 117.65, 119.88, 121.50, 121.87, 124.88, 125.79, 126.06, 127.27, 128.35, 128.76, 129.76, 130.48, 131.20, 132.49, 134.30, 138.32, 143.86, 148.39, 150.17, 155.25, 155.51, 155.82, 165.98; ESI-MS, [M+H]+ = 392.3.
PROTEIN EXPRESSION AND PURIFICATION
The CYP3A4 NF14 construct was purified and expressed from Escherichia coli as described in Roberts et al. 8. The purity was >95% as determined by SDS-PAGE analysis. The CYP3A4 concentration was determined by using the ε 450 of 91 mM-1 cm-1 9 for the carbon-monoxide bound protein. CYP3A4 was stored in 100 mM phosphate (pH 7.4) with 20% glycerol at -80 °C. CYP reductase was expressed and purified by the method of Rock et al. 10.
INHIBITION CONSTANT FOR 3A4
Testosterone was used as a CYP3A4 substrate and Ki values were determined from the formation rate of 6-β-hydroxytestosterone in CYP3A4 baculosomes. Four different final concentrations (20, 40, 60 and 80 μM) of testosterone in 100 mM potassium phosphate buffer at PH 7.4 were used. Three different inhibitor concentrations were added to each different concentration of testosterone and one set was incubated without inhibitor. CYP3A4 baculosomes (4 pmol) were added to the incubation mixtures containing the substrate and the inhibitor. After preincubating the mixture for 5 minutes at 37 ° C, NADPH was added to a final concentration of 1 mM to initiate the reaction. The final volume of all the incubations was 0.5 mL. At the end of 10 minutes incubation the reactions were quenched by adding 200 μL acetonitrile containing internal standard phenacetin (25 μM). The enzyme was removed by centrifugation (Eppendorf centrifuge 5415D) for 10 minutes at 16100 X g and the formation of the product was analyzed by HPLC with UV detection, and compared with the standard 6-β-hydroxytestosterone. The HPLC system used reversed phase chromatography (Alltech, Altima C18 5μm, 150mm length, 3.2 mm id), beginning with 95% mobile phase A: 0.1% trifluoroacetic acid in water and 5% mobile phase B: 0.1 % trifluoroacetic acid in acetonitrile with linear gradient to 65 % mobile phase B over 25 min. Each compounds’ Ki was determined by a nonlinear fit to the competitive inhibition equation using GraphPad Prism 4 (San Diego, CA).
SATURATION KINETICS
Compounds 1, 2, and 3 were used as CYP3A4 substrates at five different concentrations (0.2KM - 5KM). CYP3A4 Baculosomes (5 pmol) were added to the incubation mixtures containing a substrate in 100 mM potassium phosphate buffer at pH 7.4 followed by pre-incubation for 5 minutes at 37 ° C. NADPH was added to a final concentration of 1 mM to initiate the reaction. The final volume of all incubations were 500 μL. Reactions were quenched after 10 minutes by adding 200 μL of acetonitrile containing 25 μM phenacetin as an internal standard. The enzyme was removed by centrifugation (Eppendorf centrifuge 5415D) for 10 minutes at 16100 X g and metabolites were analyzed by LC/MS (Thermo Quest HPLC series coupled with Thermo Finnigan LCQ Advantage). The HPLC system used reverse phase chromatography (Agilent, Eclipse plus C18 5μm, 150 mm length, 3.2 mm id) beginning with 85% of mobile phase A: 0.1% acetic acid in water and 15 % mobile phase B: 0.1% acetic acid in acetonitrile with a linear gradient to 85% of mobile phase B over 25 min. The m/z monitored for the compounds were as follows; internal standard: MS - 180, substrate: MS - 376.3 and metabolite: MS - 392.3. The metabolites were quantified using the standard curves prepared with internal standard and the synthesized metabolites of the substrates. The kinetic constants were determined using nonlinear fits to a hyperbola using GraphPad Prism 4 (San Diego, CA) graphing software. The resulting linear plots of 1/concentration versus 1/rate are shown in the supplemental material (Figures S1-S3) along with fits to the line. For compounds 2 and 3 solubility precluded using concentrations much over the KM values.
MS/MS ANALYSIS of METABOLITES
To identify the position of metabolism LC-MS/MS analysis was carried out in Thermo Quest HPLC coupled with Thermo Finnigan LCQ Advantage. The HPLC system used reverse phase chromatography (Agilent, Eclipse plus C18 5μm, 150 mm length, 3.2 mm id) beginning with 85% of mobile phase A: 0.1% acetic acid in water and 15% mobile phase B: 0.1% acetic acid in acetonitrile with a linear gradient to 85% of mobile phase B over 25 min. The fragments were monitored in the range of 100 to 450 m/z for the metabolite mass of m/z 392.2 [M+H]+ using the electro spray ionization (ESI) mode with collision energy of 40 v. The fragments observed are presented in supplemental material (Figure S6) and correspond to hydroxylation on the naphthalene ring.
REDOX POTENTIAL MEASUREMENTS
Cyclic voltammetry was performed on Faraday Potentiostat (Obbligato Objectives, Toronto, Canada) using an edge-plane pyrolytic graphite (EPG) electrode (Pine Instrument Company, Raleigh, NC), a Pt wire counter, and Ag/AgCl reference electrode. 5 μL of 0.1M stock didecyldimethylammonium bromide (DDAB) in chloroform was added onto the EPG working electrode. The film was allowed to dry at room temperature over 15 minutes. Purified CYP3A4 enzyme (~11μM) in 100 mM potassium phosphate (KPi) buffer, pH 7.4. Before redox measurement, enzyme mixtures were deoxygenated by blowing pure nitrogen gas through the solution. The electrochemical cell contained 1 mL recombinant CYP3A4 enzyme. While the potentiostat was scanning, the enzyme solution was kept deoxygenated under nitrogen gas. Apparent CYP3A4 Fe3+/Fe2+ redox potentials were measured at different scan rates (100, 300, 500, 700, 900, 1000, 1200, 1400 mV/s) in the presence and absence of substrates (testosterone, compound 1) at room temperature. Substrates were mixed with the enzyme solution before the electrode was immersed for redox potential measurement to avoid substrate diffusion problems.
Plots of current peak (Ip) versus scan rate were linear with scan rate. The areas of the voltammetric wave change were found not to vary more than 10%. Thus, we know that the amount of heme, and thus protein bound to the membrane of the electrode are the same, and that substrates binding does not change the amount of P450 bound to the biomembrane on the electrode. Thus we can use Laviron’s equation (Equation1) to calculate electrochemical parameters, where E0 is the formal potential, α is the electron transfer coefficient, ks is the standard rate constant of surface reaction, and v is the scan rate. The E0 can be extrapolated from the plot of Ep vs v at v = 0. The value of α was determined by Equation 2. The ks can be calculated from the intercept of Equation 3. From extrapolating line to v = 0 of Ep vs scan rate, we saw only a slight change for formal redox potential, for three different enzyme systems. The rate constant calculated varies in the three different systems (Table 3). This indicates that the electron transfer rate may be affected by substrate binding, whether the substrate binds in a type I or type II mode. Plots are given in supplemental (Figures S4 and S5).
Table 3.
Electrochemical results.
| 11 μM 3A4 complexed with | E0 (mV)a | ΔEp, ½ (mV) b | α c | ks (s-1) d |
|---|---|---|---|---|
| 200 μM TST | -189 (3) e | 157 (6) | 0.396 | 5.56 |
| - | -194 (8) | 164 (2) | 0.38 | 3.64 |
| 100 μM compound 1 | -218 (5) | 151 (8) | 0.412 | 2.82 |
This value was determined by Equation 1 in methods and is the formal potential.
determined with equation 2.
the electron transfer coefficient.
the rate of electron transfer.
The values in parentheses is the error in the last digit.
| Equation 1 |
| Equation 2 |
| Equation 3 |
SURFACE PLASMON RESONANCE
SPR experiments were conducted on a Biacore 3000 instrument (GE Healthcare) as described previously 11. Briefly, sensor surfaces were pretreated according to published methods and then normalized by standard Biacore protocols. Binding of a drug to purified recombinant CYP3A4 was monitored in running buffer [1% methanol and 100 mM potassium phosphate (pH 7.4)] at a flow rate of 100 μL/min and a temperature of 10 °C. For coupling of CYP3A4 to CM5 sensor surfaces, the surfaces were activated with a 5 min pulse of EDC/NHS (5 μL/min in HBS-EP buffer), followed by injection of the protein, and then deactivated by a 5 min pulse of ethanolamine HCl (pH 8.5, 5 μL/min). Protein injections were done for variable times to produce surfaces of variable protein densities, yielding responses that ranged from 3 to 10 kRU. Immobilization was conducted in HBS-EP buffer with CYP3A4 at a concentration of 400 nM in 10 mM sodium acetate (pH 5.5). Control surfaces consisted of activated and deactivated surfaces without protein. Activation and deactivation were done by the same protocol used above for CYP3A4 surface generation. Drug analytes were dissolved in high-grade methanol and then diluted into either 100 mM potassium phosphate to yield solutions with a final methanol concentration of 1%. Concentrations of analyte samples were verified by LC-MS/MS before and after SPR measurements. SPR data were double-referenced and analyzed with BIAevaluation version 4.1 (GE Healthcare). Sensorgrams were corrected for organic co-solvent effects, but as witnessed by others, the use of methanol as the organic co-solvent and the use of suitable control surfaces made correction factors negligible. Dissociation constants were determined in both BIAevaluation and OriginPro 7.5 (Origin Lab Corp.) software by fitting data to a biphasic decay equation. Data were fit both globally, with each parameter constrained to be constant at every concentration of drug, and “locally”, wherein the parameters varied with drug concentration. In all cases, global fits were better, based on standard statistical criteria.
REDUCTION OF CYP3A4 BY CYP REDUCTASE IN PRESENCE OF TYPE II COMPOUNDS
Reconstitution method developed by Guengerich and coworkers 12 was used with modification to measure the reduction of CYP3A4 by P450 reductase and NADPH. A 5X protein premix consisting of 10μM CYP3A4, 10μM CYP reductase, 0.1mg/mL liposomes(L-α- Dilauroyl-sn-glycero-3-phospocholine, L-α- Diloleoyl-sn-glycero-3-phospocholine, L-α- Dilauroyl-sn-glycero-3-phosposerine (1:1:1,w/w/w), 3 mM glutathione, 0.5 mg chaps/ml, 50 mM KPi buffer pH 7.4 with 20% glycerol and 5X buffer mix consisting of 12 mM glutathione, 150 mM MgCl2, and 50 mM KPi buffer pH 7.4 with 20% glycerol. The reconstituted protein was left in ice bath for 30 min prior to use. The reaction mixture was prepared by mixing reconstituted protein premix, buffer mix, substrate and 50 mM KPi buffer (pH 7.4) in a flask. To remove the dissolved oxygen from the solution the flask was connected to argon line and vacuum line. Argon line (15psi) was opened to the mixture for 3 min while vacuum line was closed. Then argon line was closed and vacuum line (100 Torr) was opened for a minute. The argon/vac cycle was repeated for 10 times and then the flask was detached and sealed by septum in pressure of argon. Dissolved oxygen from NADPH solution was removed using same method. Carbon monoxide was bubbled though both solutions for two minutes (2 bubbles/sec). Protein-substrate mixture was mixed with NADPH solution by transferring both solutions to a cuvette via cannula using the pressure of the carbon monoxide. The cuvette was sealed and flushed with argon prior to transfer. If the seal on the cuvette is removed the carbon monoxide binding spectra disappears in less than one minute, indicated the high affinity of oxygen relative carbon monoxide for the reduced 3A4. This competition for binding means that these measurments are not quantitative. The final concentration of the reaction was 2 μM CYP3A4, 2 μM CYP reductase, 2 mM NADPH and 25 μM substrate. The absorbance was monitored from 400 to 500 nm using a HP 845X UV-Vis spectrometer.
DIFFERENCE SPECTROSCOPY FOR BINDING OF SUBSTRATES TO CYP3A4
Difference binding spectra were collected on a double-beam Olis upgraded Aminco DW-2000 spectrometer (Olis Inc., Borgart, GA). A baseline was recorded with protein in both reference and sample cuvettes before collecting the difference spectra. To correct the absorbance from the substrates two-chambered cuvettes (NSG Precision Cells Inc., Farmingdale, NY) were used. Purified CYP3A4 (0.5 μM) was put in the sample and reference cuvettes and an equal volume of 100 mM KPi buffer pH 7.4 was placed in the other chamber of the both cuvettes. Substrate (50 μM final concentration) was added in protein chamber of sample cuvette and buffer chamber of reference cuvette. To correct for dilution, an equal volume of solvent to that used to add the substrate was also added in protein chamber of reference cuvette and buffer chamber of sample cuvette. Absorbance was recorded from 350 to 500 nm to determine the mode of binding.
Results
Even though compounds 1 and 2 are type II binders (Figure 3), both are metabolized in vitro by CYP3A4. Two hydroxylated metabolites were observed for compounds 1, and 2 (Figure 4). From the results of the fragmentation and masses of the metabolites obtained from LC-MS/MS, we concluded that both metabolic sites for both 1 and 2 were on the naphthalene ring (MS/MS spectra are included in supporting information Figure S6) but the exact position of hydroxylation for second metabolite was not identified.
Figure 3.
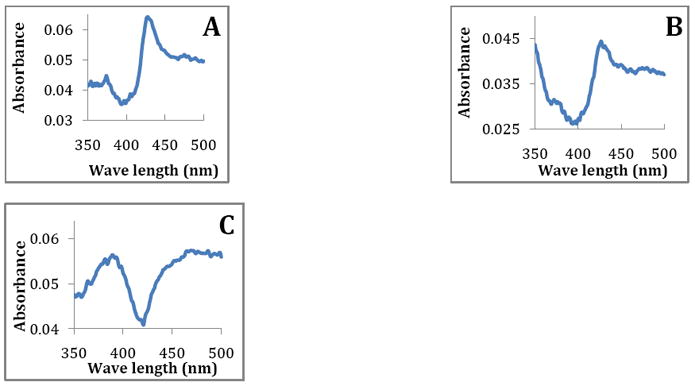
Binding spectra of compounds with CYP 3A4 A) compound 1, B) compound 2, and C) compound 3. Binding spectra was collected in split beam mode in Olis spectrometer using two chambered cuvettes as described in the methods section.
Figure 4.
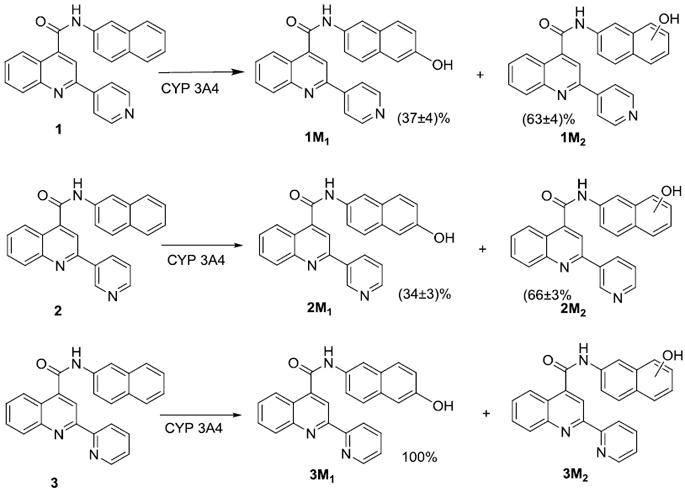
Metabolites of 1, 2, and 3. The percentage of each metabolite was estimated by the average ratio of areas of the metabolites on LCMS analysis with substrate concentrations range of 0.2KM - 5KM. Trace amounts of metabolite 3M2 of compound 3 was detected only at the highest concentration of substrate.
Hydroxylation at the 5-position of the naphthalene ring for all three compounds was confirmed by synthesizing the respective metabolites (1M1, 2M1, and 3M1 in Figure 4) and characterization by LC-MS/MS. The other possible naphthalene ring metabolites were not easily synthetically accessible, so the exact position of the hydroxyl group on the naphthalene ring is not known.
Hydroxylation at the 5-position of the naphthalene ring (metabolite 3M1) was found to be the only measurable metabolite for compound 3. If we assume similar ionization potential and mass spectral response for the two metabolites of 1 LC-MS showed that about 40% was hydroxylated at the 5-position of naphthalene ring (metabolite 1M1) compared to the other uncharacterized metabolite (1M2) on the naphthalene ring, with similar results for compound 2. No metabolites on the pyridine ring were observed for any of the three compounds studied. The approximate percentage of each metabolite formed for each substrate is shown in Figure 4.
From a fit of the kinetic data to a hyperbola (see supplemental data for the plots), the KM values measured for both metabolites of 1 are the same (Table 1) as would be expected for a single enzyme with one common binding site 13. For example 1 forms two products, 1M1 and 1M2, as shown in Figure 3, both of which have statistically indistinguishable KM values of 0.6± 0.1 and 0.6±0.1 μM respectively. The overall catalytic rate constants (kcat) for hydroxylation at the 5-position of the naphthalene ring were measured by LC-MS/MS utilizing the synthesized metabolite standard for each respective compound (1-3). The regioselectivity of metabolite formation did not change with substrate concentration for both Compounds 1 and 2 (data not shown). The measured catalytic rate constants decreased by about 50% for the type II binding compound 1 relative to the type I binding compound 3 (Table 1), but the values for the overall intrinsic clearance (kcat/KM) of the type II binding 1 and 2 are more than 4-fold faster than the type I binding 3.
Table 1.
Affinities and steady-state kinetic values for metabolism of compounds 1, 2, and 3.
| Compound | Kia (μM) | Metabolite | kcatc (min-1) | KMd (μM) | kcat/K (min-1 μM-1) |
|---|---|---|---|---|---|
| 1 | 1M1 + 1M2 | 1.03 (3) | 0.6 (1) | 1.72 | |
| 0.07 (3) b | 1M1 | 0.41 (3) | 0.6 (1) | 0.68 | |
| 1M2 | 0.62 (4) | 0.6 (1) | 1.03 | ||
| 2 | 2M1 + 2M2 | 16.4 (8) | 6.4 (8) | 2.56 | |
| 0.42 (5) | 2M1 | 6.7 (2) | 8.7(7) | 0.77 | |
| 2M2 | 9.8 (6) | 5.3 (9) | 1.85 | ||
| 3 | 94 (21) | 3M1 | 1.8 (2) | 2.5 (6) | 0.4 |
Inhibition constant.
the value in parentheses is the standard deviation in the last significant figure.
Total pseudo-first order rate constant for saturation for two metabolites.
concentration at half-maximal velocity.
The kinetic values indicate that at low substrate concentrations the type II binding compound 1 is metabolized more rapidly than compound 3. This is consistent with our previous substrate disappearance studies at 1.0 μM 6. At saturating substrate concentrations, 1 is metabolized at about a half of the rate of compound 3, but much faster than would be expected for a dead-end complex. Given these unexpected results, further investigation of the kinetics of metabolism of compound 1 was warranted. With this in mind, we determined the kinetics of substrate debinding (off-rates) and the kinetics of the rate of reduction for the compound 1/CYP3A4 complex.
The off rates for bound compound 1 dissociating from CYP3A4 were determined using surface plasmon resonance (SPR) at a concentration range of 0.63 - 10 μM. While 1 yielded concentration dependent response data in this range, we were unable to observe a response with compound 3 due to solubility issues preventing further interrogation of the interactions at concentrations higher than 10 μM. Sensorgrams for 1 were analyzed against three different models using BIAevaluation software: (1) simple 1:1 binding, where compound-CYP3A4 interactions can be described by a single association and dissociation rate; (2) analyte heterogeneity, where compound binding can adopt two parallel binding trajectories (e.g. fast vs. slow off-rates) but must dissociate and rebind to switch orientations; or (3) compound-induced conformational change, wherein the conformational change occurs on the same time scale as compound binding. Dissociation of 1 from immobilized CYP3A4 is clearly biphasic, with model 1 (simple 1:1 binding) yielding very poor fits to the data (χ2 over 30) as expected. When analyzed utilizing models 2 or 3, sensorgrams for 1 gave equivalent fits between the two models with χ2 approximately 10 for both compounds to both models (Figure 5A). Therefore, dissociation kinetics for compound 1 was fit to a biphasic decay model (Table 2) with components simulated from the determined parameters. A number of reasons could explain the biphasic nature of dissociation. The results could be explained by dissociation from the type II (low spin-fast mode) and a type I (high spin-slow mode) as was concluded for this binding model for itraconazole. However, absolute UV spectra do show less high spin heme relative to free enzyme (See supplemental Figure S6). It could be that SPR shows a greater response to the high spin mode than the UV, but the underlying mechanism for this difference is unclear. Furthermore, if the two modes reflect a high spin and low spin mode one would expect the slow component to have higher intensity than the fast component reflecting the difference in populations of the two modes. Interestingly, 2 shows a higher fraction of fast versus slow release (Figure 5C), and this compound appears to have a lower level of type II binding than 1 (Figure 3B). However, the two modes could also represent different conformations of the enzyme or aggregates of the enzyme that allow for fast dissociation, and another that leads to slower dissociation of the type II complex.
Figure 5.
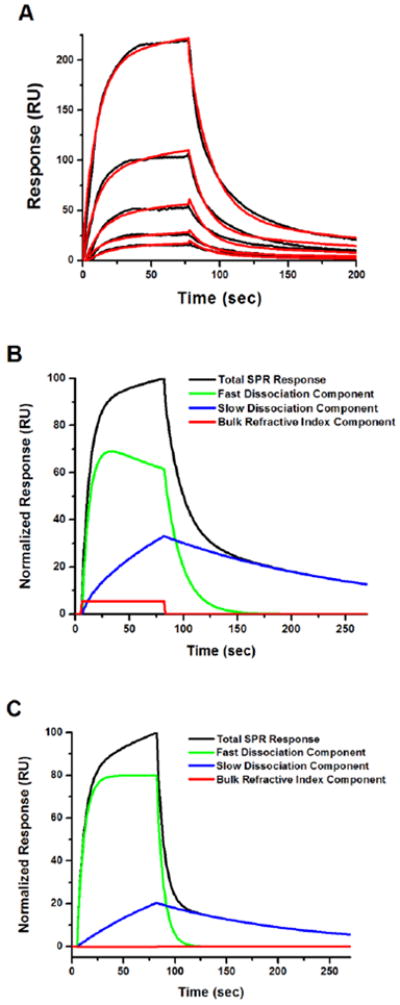
(A) Representative sensorgram (black) for Compound 1 (0.6 - 10 μM) binding to immobilized recombinant CYP3A4 with fits to analyte heterogeneity model (red) found in the BIAevaluation model suite. (B) Component analysis of fit for Compound 1 from (A) showing amount of fast vs. slow dissociation in total SPR response 11. (C) Component analysis of fit for Compound 2 to heterogeneity model showing amount of fast vs. slow dissociation in the total SPR response.
Table 2.
The off-rates for 1 and 2 as measured by SPR.
| Compound | koff fast (s-1) | koff slow (s-1) |
|---|---|---|
| 1 | 0.034 (2)a | 0.006 (2) |
| 2 | 0.07 (2) | 0.0053 (9) |
The number in parenthesis is the error in the last decimal place.
To determine if it is possible to reduce the type II coordinated complex, a direct measure of the reduction potential of 1 was undertaken. Redox potential measurements of CYP3A4 in the absence of ligand, in the presence of the type I ligand testosterone (TST), and in the presence of the type II ligand 1 are presented in Table 3. Testosterone was chosen to validate the method, since values exist in the literature for the reduction rate 14. The 3A4 complex with 1 is harder to reduce than the free or testosterone bound enzyme. To determine if substrate binding has an effect on the kinetics of the electron transfer, we investigated the relationship between potential (Ep) and scan rate (see supplemental data for plots). An Ep shift is observed with increasing scan rate and the degree of the Ep shift is different for testosterone bound, 1 bound and substrate-free enzyme giving rate constants for reduction (ks) of 5.6 s-1, 2.8 s-1 and 3.6 s-1 respectively (Table 3).
Further evidence that 3A4 can be reduced by P450 reductase and NADPH in the presence of compounds 1 and 2 is given in Figure 6. Figure 6 shows that carbon monoxide can bind under anaerobic conditions in the presence of either compound.
Figure 6.
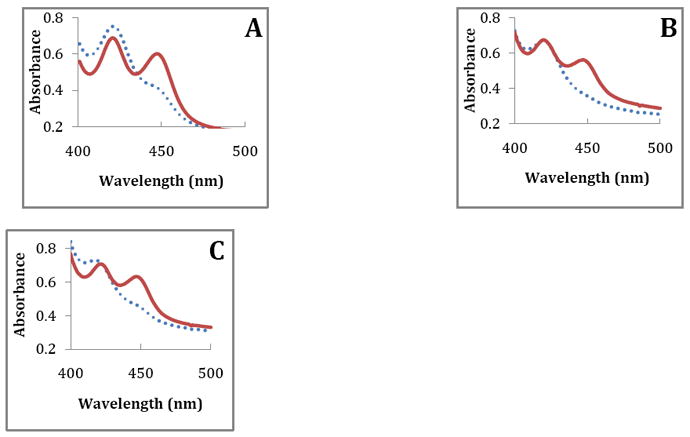
Type II binding compounds get reduced by CYP reductase. Spectra were collected under anaerobic condition using 2 μM purified 3A4, 2 μM CYP reductase, and 25 μM of substrate. Solutions were bubbled with CO before adding NADPH. Dotted lines were recorded immediately after the addition of NADPH solution (2 mM final concentration) and solid lines were recorded after addition of NADPH solution for A) compound 1, B) compound 2, and C) compound 3. Fe(III) was reduced by CYP reductase into Fe(II) and Fe(II) bound with CO to give the absorbance at 450 nm.
Discussion
CYP type II complexes result from heme-iron coordination with nitrogen bearing ligands 15. The direct ligation of a substrate to the heme of CYP enzymes can inhibit metabolism of a co-administered drug and result in drug-drug interactions. Furthermore, drugs designed to inhibit CYP enzymes have been made more potent by adding aromatic nitrogen(s) that enable type II coordination 16,17. It has been shown for some compounds that type II binding can increase metabolic stability 4,5. It is tempting to speculate that this is a general phenomenon that can be used to modulate affinity and metabolic stability for the CYP enzyme families. Contrary to this conclusion, some recent studies have shown type II binding compounds are also substrates of the CYP enzymes 11,18 and are metabolized significantly 6. Although the study of type II binding in liver microsomes was started more than four decades ago 19-22, very little is known about how type II binding compounds get metabolized. Given the importance of type II binding in drug design and development it is essential that we understand the underlying chemistry of type II interactions.
Previously we determined that 1 had a 1,350 fold higher affinity for 3A4 than the almost identical type I binding molecule 3 based on the competitive inhibition of testosterone oxidation. This established that nitrogen coordination is a strong binding interaction, and that the vast majority of 1 is coordinated to the heme-iron. In that study we concluded that formation of a dead-end complex was unlikely given that substrate disappearance was higher for the type II binder, than the type I binder 6. By two indirect measurements, density functional theory (DFT) computation and UV/vis spectroscopy, we reported that direct reduction of the iron with the nitrogen bound was energetically feasible. In an attempt to address the kinetics of the metabolism of these pyridine-containing analogs we have measured the saturation kinetics for the highest affinity series from our previous work 6 (Figure 2). The reduction rate and the off rate for the tightest binding 1 were also measured to determine the kinetic mechanism of metabolism of this compound.
To get the overall rate of metabolism we used saturation kinetics to get the catalytic rate constant for hydroxylation compounds 1, 2, and 3 (Table 1). These rate constants reflect a combination of all of the rate contributing steps in the catalytic process. This measurement indicates that nitrogen coordination by compound 1 slows the overall reaction by about 50% relative to the compound 3 which binds in only a type I fashion as measured by UV/vis spectroscopy (See Figure 3). These results indicate that the metabolism of the type II binding compounds is not significantly slower even when the enzyme is saturated, and that substrate affinity is not the major factor in the rapid metabolism of these compounds. Interestingly the weaker type II binding 2 has a higher overall catalytic rate constant than type I binding 3 by almost 9-fold. It is possible that weaker type II binding mode for 2 indicates a higher fraction of type I binding that results in a slightly higher kcat. Presently, we are trying to look for burst kinetics that might be associated with this type of metabolism. Finally, at sub-saturating concentrations, as reflected in kcat/KM values, both 1 and 2 have more than eight-fold higher rate of metabolism than the type I binding 3. Since most drugs are metabolized at sub-saturating conditions in vivo this is the best estimate of clearance, and the tightest binding type II compound gives the highest overall rate of metabolism.
To determine if the molecules translate or rotate in the active site we used synthetic standards to assess the sites of metabolism. Two of the three compounds gave two metabolites as shown in Figure 4, with metabolism only occurring on the naphthalene ring. These results indicate that the mode of binding is not the determinant of the site of oxidation, and that all three molecules orient in the active site to give the lowest energy products 23. Isotope effects have also indicated this rapid equilibrium in the active site and, as measured by intramolecular isotope effects, that reorientation is rapid relative to the oxidation of the substrate 24,25. (As noted below electron transfer is rate limiting and the observed isotope effects do not mean that the chemistry is rate-limiting. Measured intermolecular isotope effects are small unless they are unmasked by branching to alternate products 26.)
Reduction of CYP enzymes is normally the rate-limiting step in the catalytic cycle 27. As already mentioned, in previous studies we used two thermodynamic measurements; DFT computational methods, and the difference in affinity of the Fe2+ and Fe3+ for type II binding compounds determined by titration 6. Both methods were in close agreement that nitrogen coordination is weaker after reduction by about 1.8 kcal/mol. This result indicates a change in reduction potential of around 72 mV. Herein we made a direct measurement of the reduction potential difference of the enzyme when testosterone, or 1 is bound, and found a mean difference of 29 mV (Table 3). Thus, these results are qualitatively similar. However, the main determinant of the kinetic mechanism is the rate of reduction, not the thermodynamics. To assess differences in rate we looked at the relationship between potential (Ep) and scan rate (Supplemental Figure S4 and S5). The mean rate of reduction of the enzyme with testosterone bound is 5.6 s-1, and with 1 bound it is 2.8 s-1, or approximately 2-fold slower . The enzyme with no substrate bound had a similar rate to CYP3A4 with 1 bound. These results are consistent with reduction of the type II coordinated complex. Our measured reduction rates for testosterone are similar to previous reports 14, where carbon monoxide binding to 3A4 in the presence of testosterone was monitored after reduction by NADPH/P450 reductase. The reported value from this study was 21 s-1 14. One consideration is that scanning the potential could drive reduction, and the rate differences could be larger than the reported values 28. Another caveat to this measurment is that no reductase or membrane is present in the experiment, and the rate-limiting step is not well defined for CYP3A4 1. To confirm that NADPH/CYP reductase could reduce CYP3A4 in the presence of the substrates we looked at carbon monoxide binding under anaerobic conditions. Figure 6 shows that under these conditions CYP3A4 can be reduced in the presence of 1.
The measured off-rates by SPR for 1 are slower or comparable (0.006 s-1 for the slow mode and 0.03 s-1 for the fast mode) to the catalytic rate of 0.02 s-1 (Table 1) or the electron transfer rate of 2.8 s-1. This indicates that once a substrate is bound to the enzyme, it will only very rarely debind. Both the Ki values and the measured off-rates indicate that breaking the nitrogen-iron coordination is rate limiting for debinding of 1. This means that for both binding modes the substrate is committed to catalysis after binding. This is again consistent with measured isotope effects that show a high commitment to catalysis, and low intermolecular isotope effects 27,29-31. Furthermore, the off-rates reported here are consistent with those reported for itraconazole and ketoconazole, both having rates of dissociation from the low-spin complex of 0.002 s-1 11. Itraconazole also has a distinct type I binding mode that leads to product 18, which has an off-rate of 0.04 s-1 similar to the slow off-rate reported herein 11.
Given the data we can now evaluate each of three kinetic models for metabolism of type II binding compound 1 (see Figure 7). The true dead-end complex model (Figure 7A) requires debinding and rebinding to achieve catalysis. The second model is the rapid-equilibrium model (Figure 7B), which requires reorientation of the substrate before reduction, but not total debinding. The third model, which requires direct reduction of the type II bound enzyme-substrate complex followed by rapid reorientation of the substrate for metabolism (Figure 7C).
Figure 7.
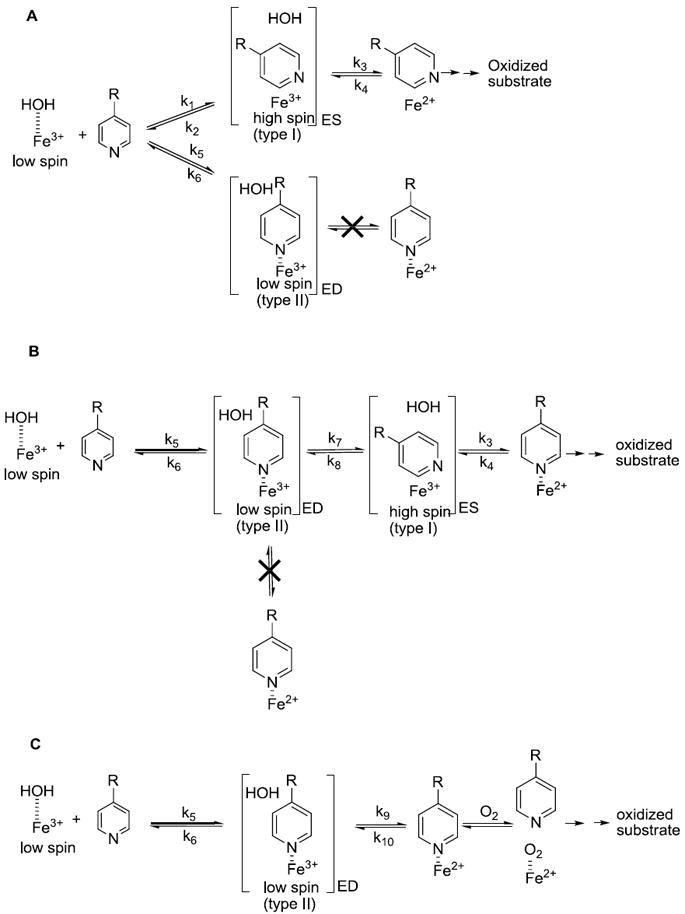
Kinetic models for metabolism of type II binding compounds (A) a debinding-rebinding kinetic model (B) a rapid equilibrium kinetic model (C) a direct reduction kinetic model.
In the dead-end debinding-rebinding model (Figure 7A), compounds bind with different orientations to the CYP, often called a parallel binding trajectory model 11. In this model, the compound binds with a ratio of type I to type II modes. Direct reduction of the type II bound heme-iron (ED complex in Figure 7A) is assumed not to occur. According to this model, type II binding compounds get metabolized by debinding of the substrate to give free enzyme, followed by reorientation and binding of the substrate in the metabolically active (ES complex in Figure 7A) type I binding mode. The dead-end kinetic model, with debinding and rebinding of substrate, would always lead to low ratios of type I to type II binding since nitrogen coordination to iron is strongly favored. This would lead to overall low concentrations of ES complex and a decrease in the overall rates of metabolism for a type II substrate relative to a structurally related type I substrate. The difference in rates would be proportional to the difference in binding affinity. Since 1 binds 1,350 more tightly than 3 one would expect to see a difference in the rates at saturating concentrations of over 1,000, while instead only a modest decrease in kcat is observed. Thus, debinding and rebinding is not consistent with the difference in rate of metabolism of the type II binding 1 relative to the type I binding 3. Finally, debinding is not kinetically feasible given the difference in off-rates, and catalytic rates. These results exclude the dead-end complex kinetic model for these compounds. This is in contrast to itraconazole, which is metabolized slowly (kcat = 0.27 min-1) 18, and has been shown to debind and rebind to give a metabolically active ES complex by Pearson et al 11. It also contrasts with ritonavir which appears to form a very tight complex with 3A4 that cannot be reduced 32. Interestingly, ritonavir was found to have the same affinity for the reduced and oxidized heme using spectral studies 32, while the quinoline carboxamides showed a 25-fold decrease in affinity after reduction 6. In general, it can be stated that if type II binding significantly enhanced binding affinity, rates of metabolism must be significantly slower for type II binding compounds if they follow dead-end kinetics.
In the rapid equilibrium kinetic model (Figure 7B), the (ED) type II complex is in rapid equilibrium with a metabolically active (ES) type I binding either by re-orientation, by translation or rotation in the active site without debinding to give free enzyme, or by rapid-debinding. Similar to dead-end debinding-rebinding model, metabolism in the rapid equilibrium kinetic model only occurs for the type I bound orientation. It requires that the type II complex rapidly dissociate, forming a type I complex faster than reduction of the type II complex. Based on the relatively conservative assumption that both 1 and 3 bind at the same rate the difference in Ki values for 1 and 3 (Table 1) indicate that breaking the iron-nitrogen coordination is at least partially rate limiting in debinding. Since 1 and 3 are competitive inhibitors the Ki value represents the ratio of the debinding to binding. While the measure may reflect the contribution of any free enzyme form, the major contributing species will be the unreduced free enzyme. Given that compounds 1 and 3 only differ by the placement of the nitrogen in the ring the binding rates are unlikely to differ by more than a factor of 10, and probably much less. This means that the debinding rate must be much slower for 1 than 3 based on the Ki differences. While other factors may influence this debinding rate, the most likely reason is that 1 coordinates to the iron while 3 does not. The SPR results for 1 (Table 2) support this assumption. Comparison of 1’s rate of reduction (2.8s-1), or even the overall rate of reaction kcat (0.02 s-1), with the rates of dissociation (0.03 and 0.006 s-1) indicates that the equilibrium is not rapid relative to the rate of catalysis, excluding this model. Obviously the measured off-rates are for the complete debinding process and are a combination of micro rate constants that include breaking the iron-nitrogen bond, conformational changes, and diffusion out of the protein. However the fact that very similar molecules such as 1 and 3 show such differences in Ki values means that the micro rate constant for breaking the nitrogen-iron bond is the slowest component in the debinding process 33. One Caveat to the SPR results is that they are measured without any lipids or cytochrome P450 reductase and this may affect the measured values. The Ki values do not suffer from this same problem.
The final kinetic model involves the direct reduction of the ED complex to give a Fe2+ nitrogen-coordinated complex, followed by breaking of the nitrogen-iron coordination (due to the 1.8 kcal/mol lower affinity of our quinoline carboxamides to the reduced iron,6) facilitating oxygen binding and substrate reorientation, as shown in Figure 7C. A comparison of SPR data and the measured rates of reduction indicates that the rate constant for breaking the N-Fe3+ bond (k7 = 0.03-0.006 s-1) is much slower than the measured rate-constant for reduction of the nitrogen coordinated heme (k9 = 2.82 s-1), with the measured rates of reduction being up to 450 times faster than debinding. In addition, the off rates (0.03-0.006 s-1) for type II binding 1 is slower or comparable than the overall rate of reaction (0.02 s-1) indicating direct reduction is likely happening. The direct reduction model is also consistent with the observed higher than expected metabolic rate of type II binding 1 at subsaturating conditions (Table 1). As shown previously, after reduction the nitrogen iron-bond is weakened, and oxygen can compete for coordination to the iron 6 continuing the catalytic cycle.
The main arguments presented here are that debinding, or even reorientation before reduction of the heme iron, is not kinetically competent in that the forward rate is faster than breaking the nitrogen-iron bond. Evaluation of the data used to come to this conclusion indicates a large amount of consistency with what is already known about P450 mediated reactions. That the measured koff is slow for the type II binding orientation is consistent with masked intermolecular isotope effects observed for almost all P450 mediated reactions. Most of the measured isotope effects are for type I binding molecules, which we have shown to be faster than type II debinding, and they still show a high commitment to catalysis meaning that type II binding compounds are even more highly committed to catalysis. The conclusion that breaking of the nitrogen-iron bond is rate limiting for type II binding compounds is supported by the difference in Ki value for compounds 1 and 3. Since the molecular properties of 1 and 3 are very similar, only differing in the position of nitrogen in an aromatic ring, the on-rates can be assumed to be very similar, with the large differences in Ki driven primarily by differences in the rates of dissociation from the bound complex. Unfortunately the off-rate for 3 could not be measured due to the low binding affinity coupled with poor solubility at high concentrations. However, the SPR data presented here is consistent with the previously reported values for ketoconazole and itraconazole, and supports slow nitrogen iron bond breaking relative to the forward rate. These three separate experimental methods (inhibition constants, intermolecular isotope effects, and SPR) all agree that the off-rate is slow relative to the forward rate of reaction presented herein for 1. The slowest forward rate measurement is the measured kcat in baculosomes, while the fastest is the measured rates of reduction of purified enzyme by an electrode. The method used to measure the reduction rate, in an admitted artificial system, give rates similar to those measured for electron transfer from P450 reductase and in microsomes when applied to a common substrate, testosterone 14, and if anything, underestimates the rate of reduction based on this comparison.
In summary, our quinoline carboxamides type II binders have more than a thousand fold increase in affinity relative their type I counterpart. However, even with this tight interaction, our type II binders (1 and 2) get metabolized significantly faster than expected and type II binding does not appear to increase metabolic stability for these compounds. Herein, while we cannot exclude the rapid equilibrium model we propose a new direct reduction kinetic model of the nitrogen-coordinated heme as a more likely explanation. Based on examples like ritonavir, it is obvious that not all type II binding compounds are substrates, and that at times type II binding will lead to dead-complex formation 32. Further study with type II binding nitrogen in different aromatic rings such as pyrazine, pyrimidine, imidazole and triazole is warranted and is currently in progress.
Supplementary Material
Acknowledgments
This work was supported in part by grant GM 84546 to JPJ.
Footnotes
Supporting Information Available. Supplemental includes kinetic fits, electrochemistry plots, and LC-MS/MS data on metabolites.
Publisher's Disclaimer: This is a PDF file of an unedited manuscript that has been accepted for publication. As a service to our customers we are providing this early version of the manuscript. The manuscript will undergo copyediting, typesetting, and review of the resulting proof before it is published in its final citable form. Please note that during the production process errors may be discovered which could affect the content, and all legal disclaimers that apply to the journal pertain.
References
- 1.Ortiz de Montellano PR. Cytochrome P450 Structure Mechanism and Biochemistry. 2. Plenum; New York: 1995. [Google Scholar]
- 2.Shimada T, Yamazaki H, Mimura M, Inui Y, Guengerich FP. Interindividual variations in human liver cytochrome P-450 enzymes involved in the oxidation of drugs, carcinogens and toxic chemicals: studies with liver microsomes of 30 Japanese and 30 Caucasians. J Pharmacol Exp Ther. 1994;270:414–423. [PubMed] [Google Scholar]
- 3.Guengerich FP. Cytochrome P-450 3A4: regulation and role in drug metabolism. Annu Rev Pharmacol Toxicol. 1999;39:1–17. doi: 10.1146/annurev.pharmtox.39.1.1. [DOI] [PubMed] [Google Scholar]
- 4.Chiba M, Tang C, Neway WE, Williams TM, Desolms SJ, Dinsmore CJ, Wai JS, Lin JH. P450 interaction with farnesyl-protein transferase inhibitors. Metabolic stability, inhibitory potency, and P450 binding spectra in human liver microsomes. Biochem Pharmacol. 2001;62:773–776. doi: 10.1016/s0006-2952(01)00724-9. [DOI] [PubMed] [Google Scholar]
- 5.Chiba M, Jin L, Neway W, Vacca JP, Tata JR, Chapman K, Lin JH. P450 interaction with HIV protease inhibitors: relationship between metabolic stability, inhibitory potency, and P450 binding spectra. Drug Metab Dispos. 2001;29:1–3. [PubMed] [Google Scholar]
- 6.Peng CC, Pearson JT, Rock DA, Joswig-Jones CA, Jones JP. The effects of type II binding on metabolic stability and binding affinity in cytochrome P450 CYP3A4. Arch Biochem Biophys. 2010;497:68–81. doi: 10.1016/j.abb.2010.03.011. [DOI] [PMC free article] [PubMed] [Google Scholar]
- 7.Peng CC, Cape JL, Rushmore T, Crouch GJ, Jones JP. Cytochrome P450 2C9 type II binding studies on quinoline-4-carboxamide analogues. J Med Chem. 2008;51:8000–8011. doi: 10.1021/jm8011257. [DOI] [PMC free article] [PubMed] [Google Scholar]
- 8.Roberts AG, Campbell AP, Atkins WM. The thermodynamic landscape of testosterone binding to cytochrome P 450 3A4: Ligand binding and spin state equilibria. Biochemistry. 2005;44:1353–1366. doi: 10.1021/bi0481390. [DOI] [PubMed] [Google Scholar]
- 9.Omura T, Sato R. The Carbon Monoxide-Binding Pigment of Liver Microsomes. I. Evidence For Its Hemoprotein Nature. J Biol Chem. 1964;239:2370–2378. [PubMed] [Google Scholar]
- 10.Rock D, Jones JP. Inexpensive purification of p450 reductase and other proteins using 2’,5’-adenosine diphosphate agarose affinity columns. Protein Expr Purif. 2001;22:82–83. doi: 10.1006/prep.2001.1385. [DOI] [PubMed] [Google Scholar]
- 11.Pearson JT, Hill JJ, Swank J, Isoherranen N, Kunze KL, Atkins WM. Surface plasmon resonance analysis of antifungal azoles binding to CYP3A4 with kinetic resolution of multiple binding orientations. Biochemistry. 2006;45:6341–6353. doi: 10.1021/bi0600042. [DOI] [PMC free article] [PubMed] [Google Scholar]
- 12.Shaw PM, Hosea NA, Thompson DV, Lenius JM, Guengerich FP. Reconstitution premixes for assays using purified recombinant human cytochrome P450, NADPH-cytochrome P450 reductase, and cytochrome b5. Arch Biochem Biophys. 1997;348:107–115. doi: 10.1006/abbi.1997.0378. [DOI] [PubMed] [Google Scholar]
- 13.Porter WR, Branchflower RV, Trager WF. A kinetic method for the determination of multiple forms of microsomal cytochrome P-450. Biochem Pharmacol. 1977;26:549–550. doi: 10.1016/0006-2952(77)90334-3. [DOI] [PubMed] [Google Scholar]
- 14.Guengerich FP, Johnson WW. Kinetics of ferric cytochrome P450 reduction by NADPH-cytochrome P450 reductase: rapid reduction in the absence of substrate and variations among cytochrome P450 systems. Biochemistry. 1997;36:14741–14750. doi: 10.1021/bi9719399. [DOI] [PubMed] [Google Scholar]
- 15.Strickler M, Goldstein BM, Maxfield K, Shireman L, Kim G, Matteson DS, Jones JP. Crystallographic studies on the complex behavior of nicotine binding to P450cam (CYP101) Biochemistry. 2003;42:11943–11950. doi: 10.1021/bi034833o. [DOI] [PubMed] [Google Scholar]
- 16.Hackett JC, Kim YW, Su B, Brueggemeier RW. Synthesis and characterization of azole isoflavone inhibitors of aromatase. Bioorg Med Chem. 2005;13:4063–4070. doi: 10.1016/j.bmc.2005.03.050. [DOI] [PubMed] [Google Scholar]
- 17.Gigon PL, Gram TE, Gillette JR. Effect of drug substrates on the reduction of hepatic microsomal cytochrome P-450 by NADPH. Biochem Biophys Res Commun. 1968;31:558–562. doi: 10.1016/0006-291x(68)90514-7. [DOI] [PubMed] [Google Scholar]
- 18.Isoherranen N, Kunze KL, Allen KE, Nelson WL, Thummel KE. Role of itraconazole metabolites in CYP3A4 inhibition. Drug Metab Dispos. 2004;32:1121–1131. doi: 10.1124/dmd.104.000315. [DOI] [PubMed] [Google Scholar]
- 19.Schenkman JB, Sligar SG, Cinti DL. Substrate interaction with cytochrome P-450. Pharmacol Ther. 1981;12:43–71. doi: 10.1016/0163-7258(81)90075-9. [DOI] [PubMed] [Google Scholar]
- 20.Jefcoate CR. Measurement of substrate and inhibitor binding to microsomal cytochrome P-450 by optical-difference spectroscopy. Methods Enzymol. 1978;52:258–279. doi: 10.1016/s0076-6879(78)52029-6. [DOI] [PubMed] [Google Scholar]
- 21.Schenkman JB. Studies on the nature of the type I and type II spectral changes in liver microsomes. Biochemistry. 1970;9:2081–2091. doi: 10.1021/bi00812a009. [DOI] [PubMed] [Google Scholar]
- 22.Schenkman JB, Remmer H, Estabrook RW. Spectral studies of drug interaction with hepatic microsomal cytochrome. Mol Pharmacol. 1967;3:113–123. [PubMed] [Google Scholar]
- 23.Higgins L, Korzekwa KR, Rao S, Shou M, Jones JP. An assessment of the reaction energetics for cytochrome P450-mediated reactions. Arch Biochem Biophys. 2001;385:220–230. doi: 10.1006/abbi.2000.2147. [DOI] [PubMed] [Google Scholar]
- 24.Audergon C, Iyer KR, Jones JP, Darbyshire JF, Trager WF. Experimental and Theoretical Study of the Effect of Active-Site Constrained Substrate Motion on the Magnitude of the Observed Intramolecular Isotope Effect for the P450 101 Catalyzed Benzylic Hydroxylation of Isomeric Xylenes and 4,4’-Dimethylbiphenyl. J Am Chem Soc. 1999;121:41–47. [Google Scholar]
- 25.Iyer KR, Jones JP, Darbyshire JF, Trager WF. Intramolecular Isotope Effects For Benzylic Hydroxylation Of Isomeric Xylenes and 4,4’-Dimethylbiphenyl By Cytochrome P450 - Relationship Between Distance Of Methyl Groups and Masking Of the Intrinsic Isotope Effect. Biochemistry. 1997;36:7136–7143. doi: 10.1021/bi962810m. [DOI] [PubMed] [Google Scholar]
- 26.Jones JP, Korzekwa KR, Rettie AE, Trager WF. Isotopically sensitive branching and its effect on the observed intramolecular isotope effects in cytochrome P450 catalyzed reactions: a new method for the estimation of intrinsic isotope effects. J Am Chem Soc. 1986;108:7074–7078. [Google Scholar]
- 27.Higgins L, Bennett GA, Shimoji M, Jones JP. Evaluation of Cytochrome P450 Mechanism and Kinetics Using Kinetic Deuterium Isotope Effects. Biochemistry. 1998;37:7039–7046. doi: 10.1021/bi9729864. [DOI] [PubMed] [Google Scholar]
- 28.Johnson DL, Lewis BC, Elliot DJ, Miners JO, Martin LL. Electrochemical characterisation of the human cytochrome P450 CYP2C9. Biochem Pharmacol. 2005;69:1533–1541. doi: 10.1016/j.bcp.2005.02.020. [DOI] [PubMed] [Google Scholar]
- 29.Miwa GT, Garland WA, Hodshon BJ, Lu AY, Northrop DB. Kinetic isotope effects in cytochrome P-450-catalyzed oxidation reactions. Intermolecular and intramolecular deuterium isotope effects during the N-demethylation of N,N-dimethylphentermine. J Biol Chem. 1980;255:6049–6054. [PubMed] [Google Scholar]
- 30.Roberts KM, Jones JP. Anilinic N-oxides support cytochrome P450-mediated N-dealkylation through hydrogen-atom transfer. Chemistry. 2010;16:8096–8107. doi: 10.1002/chem.201000185. [DOI] [PMC free article] [PubMed] [Google Scholar]
- 31.Chandrasena REP, Vatsis KP, Coon MJ, Hollenberg PF, Newcomb M. Hydroxylation by the hydroperoxy-iron species in cytochrome P450 enzymes. J Amer Chem Soc. 2004;126:115–126. doi: 10.1021/ja038237t. [DOI] [PubMed] [Google Scholar]
- 32.Sevrioukova IF, Poulos TL. Structure and mechanism of the complex between cytochrome P4503A4 and ritonavir. Proc Natl Acad Sci U S A. 2010;107:18422–18427. doi: 10.1073/pnas.1010693107. [DOI] [PMC free article] [PubMed] [Google Scholar]
- 33.Ray WJJ. Rate-limiting step: a quantitative definition. Application to steady-state enzymic reactions. Biochemistry. 1983;22:4625–4637. doi: 10.1021/bi00289a003. [DOI] [PubMed] [Google Scholar]
Associated Data
This section collects any data citations, data availability statements, or supplementary materials included in this article.