Abstract
Facilitation of protein transport across biomimetic polymers and carriers used in drug delivery is a subject of major importance in the field of oral delivery. Quantitative immunofluorescence of epithelial tight junctions can be a valuable tool in the evaluation of paracellular permeation enhancement and macromolecular drug absorption. The tight junctional space is composed of transmembrane protein networks that provide both mechanical support and a transport barrier. Both of these may be affected by drug delivery agents that enhance paracytosis. Imaging is the only tool that can tease apart these processes. A confocal microscopy imaging method was developed to determine the effect of microparticulate poly(methacrylic acid) grafted poly(ethylene glycol) (P(MAA-g-EG)) hydrogel drug carriers on the integrity of claudin-1 and E-cadherin networks in Caco-2 monolayers. Z-stack projection images showed the lateral disruption of tight junctions in the presence of drug carriers. Tight junction image fraction measurements showed more significant differences between membranes exposed to microparticles and a control group. Mechanical disruption was much more pronounced in the presence of P(MAA-g-EG) microparticles as compared to the effect of EDTA.
Keywords: Tight Junctions, Paracellular, Hydrogel, Caco-2, Drug Delivery, Claudin, E-cadherin, Absorption, Permeation Enhancement
1. INTRODUCTION
pH-sensitive hydrogels consisting of poly(methacrylic acid) grafted with poly(ethylene glycol) are able to protect proteins from degradation in the stomach [1]. They also can increase the transepithelial paracytosis of these compounds in the intestine. The mechanism behind this activity deserves further investigation due to the relationship between paracellular permeation enhancement and epithelial pathology [2]. It has been postulated that the ability of these biopolymers to chelate calcium leads to disruption in the integrity of the tight junction [3, 4].
The tight junction itself is a network of non-covalently crosslinked transmembrane proteins. These networks are known as adherens junctions, zona occludens, gap junctions, and desmosomes. The most apical network of proteins, the zona occludens, and has been shown to be crucial in maintaining a paracellular transport barrier. The expression of claudin proteins, a family of at least 24 cell-cell adhesion molecules, is key to maintaining this barrier [5-6]. The claudins make up the primary transport barrier but are much less involved in the mechanical stability of the intestinal epithelium. The strength of cell-cell adhesion is mediated by the adherens junctions, composed of the protein E-cadherin [7].
The transepithelial resistance of Caco-2 monolayers is mostly due to the integrity of the tight junction [5]. In transport studies the resistance across a monolayer is commonly used as the primary quantitative measure of paracellular coherence. A common problem with resistance measurements is the large sample variability. Also, the resistance measurement is associated with macroscopic changes in the membrane. Markers for macromolecular permeability through tight junctions include nonpolar tracers such as fluorescent or radioisotope labeled dextran and or poly(ethylene glycol) . Imaging agents are commonly used as a qualitative tool for analyzing physical changes at the cellular level. A quantitative imaging tool could be a useful way to account for protein specific changes at the tight junctions.
To further investigate the type of permeation enhancement associated with P(MAA-g-EG) drug carriers claudin-1 and E-cadherin were chosen to use in this study. The former was chosen as a marker for the biochemical stability of Caco-2 monolayers, the latter for biophysical stability. These states were assessed by analyzing changes in cell-cell adhesion using conventional laser scanning confocal microscopy combined with a simple quantification algorithm.
2. MATERIALS AND METHODS
Methacrylic acid (MAA), tetraethylene glycol dimethacrylate (TEGDMA) and 1-hydroxycyclohexyl phenyl ketone (Irgacure 184™) were obtained from Sigma-Aldrich Co. (St. Louis, MO, USA). Poly(ethylene glycol) monomethyl ether monomethacrylate (PEGMA) (PEG molecular weight of 1000, corresponding to 23 repeating units) was purchased from Polysciences Inc. (Warrington, PA, USA). Fetal bovine serum (FBS), monoclonal mouse anti-E-cadherin, polyclonal rabbit anti-claudin-1 (strong cross reactivity for claudin-3), polyclonal FITC labeled goat anti-mouse and TRITC labeled goat anti-rabbit antibodies were all obtained from Invitrogen Corp. (Carlsbad, California). Dulbecco's modified eagle's media (DMEM), Dulbecco's phosphate buffered saline (DPBS), Hank's balanced salt solution (HBSS), non-essential amino acids, and penicillin/streptomycin were all obtained from Mediatech Inc. (Herndon, VA).
2.1. Synthesis of P(MAA-g-EG) drug carriers
Microparticulate drug carriers were synthesized as previously described (4). P(MAA-g-EG) films were synthesized by a UV-initiated free radical solution polymerization of MAA and PEGMA. MAA was vacuum distilled prior to use to remove the inhibitor hydroquinone. PEGMA was used as received. The two monomers were mixed together at a 1:1 ratio of MAA and ethylene glycol repeats. TEGDMA was added at 1 mol% as a crosslinker. Irgacure 184™ was added at 0.1 wt%. The monomer solution was diluted in a 1:1 water/ethanol solution. Nitrogen gas was bubbled through the mixture for 20 minutes to remove dissolved oxygen. The mixture was then pipetted between two glass slides separated by a 0.7 mm Teflon spacer and exposed to UV light (Dymax R 2000EC Light Curing System) at an intensity of 16 mW/cm2 for 30 minutes. Following polymerization the resultant films were washed in distilled deionized water for 7 days, with water being changed twice daily. The films were then dried in a vacuum oven for 48 hours, crushed with a mortar and pestle and sieved to particles sized <150 μm. Prior to use the particles were suspended in HBSS without calcium or magnesium and homogenized using an ultrasonic homogenizer (Misonix, Inc.; Farmingdale, NY).
Lyophilized particles were imaged with a LEO 1530 (Carl Zeiss AG; Oberkochen, Germany,) scanning electron microscopy. P(MAA-g-EG) microparticles were placed onto double sided conductive tape attached to an aluminum (Ted Pella, Inc.; Redding, CA) SEM stage followed by gold coating.
2.2 Culturing of Caco-2 Monolayers
Caco-2 cells (American Tissue Culture Collection; Rockville, MD) were grown on 75 cm2 tissue culture flasks in DMEM with 4.5 g/L glucose & L-glutamine, without sodium pyruvate, 1% non-essential amino acids, 100 U/mL penicillin, 100 μg/mL streptomycin and 10% FBS with the media replaced every other day. The cells were kept at 37°C in a humidified incubator with 5% CO2. Cells passaged between 60-80 weeks were grown for 21-23 days, until confluent, on polycarbonate transwell inserts with a 3 μm pore size. The monolayers were incubated with HBSS without Ca2+ and Mg2+ an hour before the start of transport experiments. At t=0 the experimental group of membranes were exposed to 10 mg/ml of microparticles in the apical chamber. A positive control group was exposed 2 μM EDTA (Fisher Scientific International Inc., Hampton, NH) in the apical chamber. Transepithelial resistance was monitored until a 40% resistance drop was observed in the positive control group. For immunolabeling the membranes were washed twice with ice cold phosphate buffered saline (PBS), fixed in methanol at -20° C for 5 minutes then dried overnight at room temperature.
2.3. Immunolabeling of Monolayers
All the following steps were conducted at room temperature. Caco-2 monolayers were rehydrated with PBS for 10 minutes followed by blocking in tris-buffered saline with 0.05% Tween 20 (Sigma-Aldrich, St. Louis, MO) and 1% bovine serum albumin (BSA) (Sigma-Aldrich, St. Louis, MO) for 30 minutes. The blocking solution was removed and each membrane was exposed to 3.25 μg of mouse anti-E-cadherin antibody and rabbit anti-claudin-1 in 650 μl of PBS with 1% BSA for an hour. They were each then washed 3 times with PBS before being exposed to 9.75 μg of both FITC labeled goat anti-mouse and TRITC labeled goat anti-rabbit antibody in 650 μl of PBS with 1% BSA for 1 hour. After this they were washed 3 times with PBS, placed on a glass slide, covered with mounting media (Biomeda Corp., Foster City, CA) and covered with a number 1.5 coverslip. Slides were stored in the dark at 4° C.
2.4. Confocal Microscopy and Image Processing
Images were acquired using a Leica SP2 AOBS confocal microscope. Z-stacks through the thickness of each membrane were acquired at ΔZ = 289 nm, with sequential excitation at 488 nm and 543 nm, 3 frame averaging, constant laser power and photomultiplier (PMT) gain at 512×512 or 1024×1024 pixel resolutions. Maximum projection images of each z-stack were obtained using Leica Confocal Software. Following Z-stack projection the resultant images were loaded into MATLAB and passed through Gaussian smoothing filter to remove graininess. Each image was converted to a binary image at intensity thresholds between 10-90% at 10 percent increments. A oneway ANOVA was performed across experimental groups at each threshold to determine of range of feasible threshold values. At a given threshold intensity each binary image matrix was summed and normalized against a summed 512×512 matrix of ones. When comparing between groups an F-test for equal variance and a Students t-test for equal means was used. Statistical significance was concluded for p-values less than 0.05.
3. RESULTS AND DISCUSSION
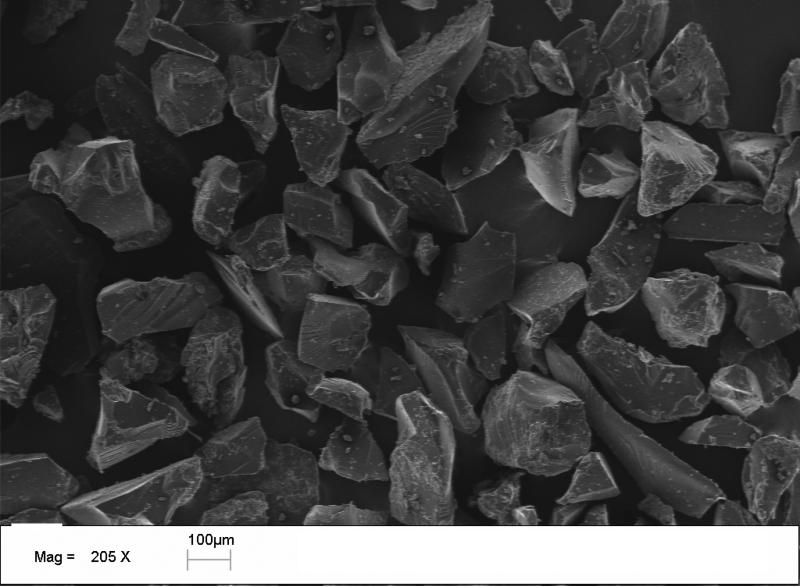
The size effects of P(MAA-g-EG) microparticles on insulin absorption have been analyzed with control for mass but not for surface area (9). The enhanced contact area between carriers and intestinal tissue may account for the increased insulin transport with smaller sized particles. Despite the lack of cytotoxicity (10), these drug carriers may have a pronounced affect on paracytosis due to surface contact between the carriers and enterocytes. The preparation method for the microparticulate drug carriers leads to an irregular morphology as shown on electron micrographs (Figure 1). To rule out any affect of polymer swelling on cell-cell adhesion integrity, polymers were pre-swollen in HBSS w/o Ca2+/Mg2+. They tended to form aggregates if added dry to the apical chamber of polarized Caco-2 cells. Because their morphology and swelling characteristics it is difficult to measure the available contact area between the carriers and monolayers using this fabrication method.
Figure 1.
Scanning electron micrograph of P(MAA-g-EG) microparticles crushed and passed through a 150 μm sieve.
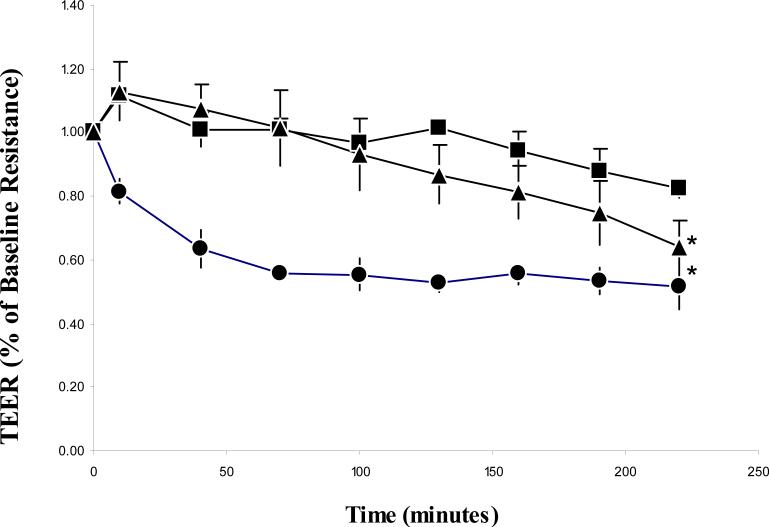
Figure 2 shows the drop in transepithelial resistance measurements over time. The first reading was taken 10 minutes after the addition of P(MAA-g-EG) microparticles and EDTA to apical chambers. The microparticles fell out suspension soon after being applied to monolayers, providing intimate contact with the membranes. Subsequent readings were taken every 30 minutes thereafter. The EDTA treated group achieved a 40% drop in resistance by the 40 minute time point. This drop was sustained throughout the course of the experiment. Both the control and microparticle treated group showed a slight jump in resistance followed by a slow decline over the course of the experiment.
Figure 2.
TEER change over time in Caco-2 monolayers exposed to 10 mg/ml P(MAA-g-EG) microparticles in the apical chamber (n=6) (▲), 2 μM EDTA in the apical chamber(n=3) (●) and a control group (n=3) (■) . Monolayers were grown on 4.71 cm2 membranes with 3 μm pore sizes. All membranes contained HBSS without calcium or magnesium in both the apical and basolateral chambers. Each data point represents ±SD. *p < 0.05, significantly different from control group at all time points.
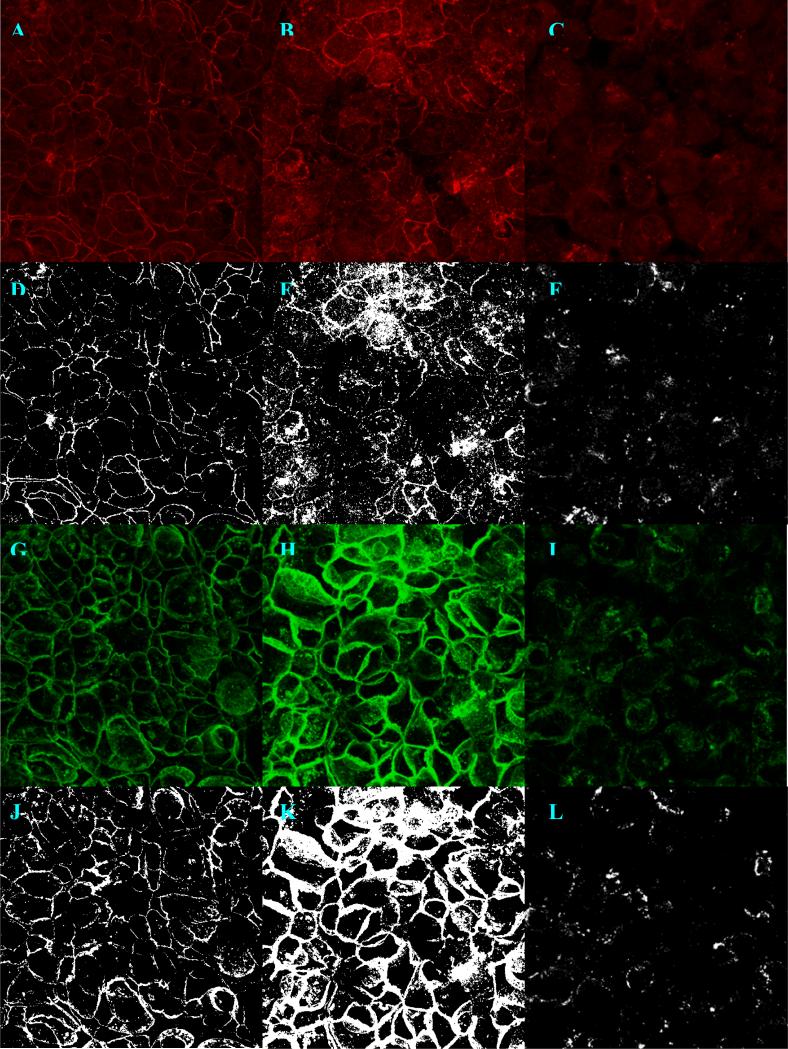
The membranes were stained and imaged within a week of experimentation. The thicknesses in the Z direction of the immunolabeled portion of the membranes varied between 8-13 μm. Visibility of the 3 μm pores in the polycarbonate on the basolateral side of the membrane and the dome like shape the cells on the apical side demarcated the z-stack axial limits. An objective magnification power of 20× was chosen for good tight junction visibility combined with a large area of membrane available for quantification. Optimal pixel resolution, z-stack step size, laser and PMT gain were determined qualitatively. At threshold values between 30-70% there was a significant difference between the groups’ mean image fraction (p<0.05). At a 30-50% threshold the visual morphology of tight junctions was preserved while still maintaining a statistically significant difference in TJ image fraction (Figure 3).
Figure 3.
Maximum projection z-stack images of polarized Caco-2 monolayers double immunolabeled for claudin-1 (a-f) and E-cadherin (g-l) and imaged with 63× objective power at 1024×1024 pixel resolutions. The left column (a, d, g, j) shows a control monolayer, the middle column (b, e, h, k) shows a monolayer exposed to 10 mg/ml P(MAA-g-EG) microparticles and the right (c, f, i, l) shows a monolayer exposed to 2 μm EDTA, both in the apical chamber. The images that result from binary conversion at a 50% intensity threshold (d-f, j-l) are show just below the original.
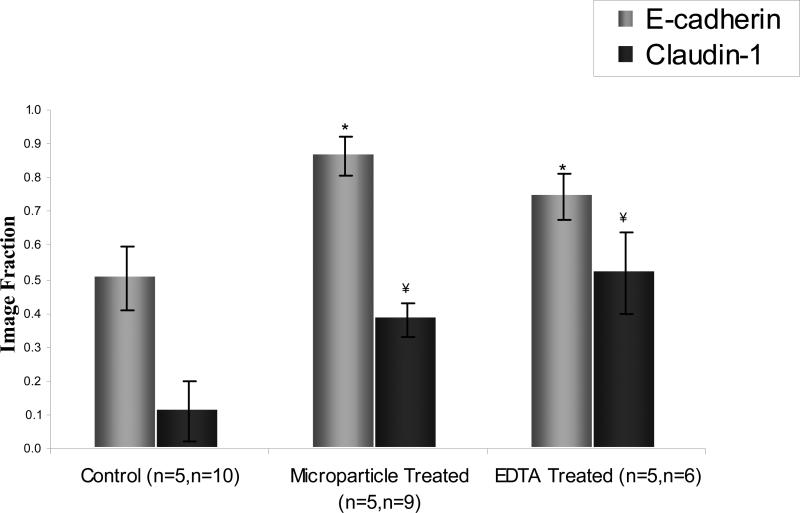
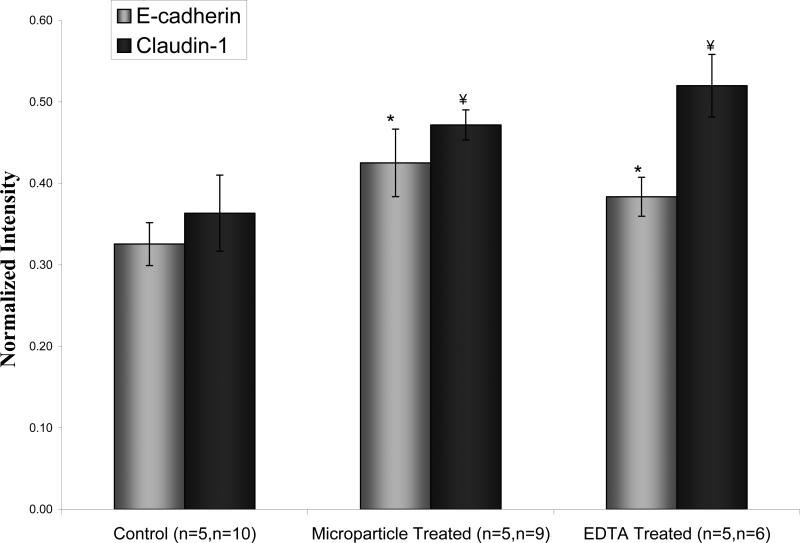
Upon viewing the projection images of immunolabeled control and microparticle exposed monolayers show the similar cobblestone morphology characteristic of Caco-2 monolayers (see Fig. 3). In the EDTA group the network of intercellular junctions was almost completely disrupted, resulting in the rounded out appearance of individual cells. When the projection images are juxtaposed the staining for both claudin and E-cadherin appears more diffuse in the both the microparticle and EDTA treated group. The claudin-1 staining pattern makes the tight junctions appear thinner. This is due to claudin-1 being restricted to the apical most portions of the junctions. E-cadherin staining was more diffuse along the thickness of the membrane, causing the junctions to appear thicker. The images quantified were obtained at 512 × 512 pixel resolutions. Larger pixel resolutions and a smaller ΔZ required much longer acquisition times for each Z-stack. The increased time was at the expense of ease-of-use. Plots of image fraction shows different effects for both microparticles and EDTA on the spread of claudin-1 and E-cadherin (see Fig. 4). The E-cadherin image fraction was greater than claudin-1 in all groups but greatest in microparticle treated monolayers. Claudin-1 spread was greatest in membranes exposed to EDTA. Image fractions were significantly different from control for both experimental groups. But they were not significantly different from each other. The sample sizes used correspond to the number images obtained from an experimental group. The membranes used for imaging were the same as those used for TEER measurements. What is most notable about these results compared to the TEER values is the much larger significance in the differences in image fraction. The central idea behind this attempt to quantify paracellular disruption is that a disruption of tight junction integrity shows as a lateral displacement of fluorescently tagged TJ molecules. This two dimensional approach simplifies other techniques which have tried to reconstruct the three dimensional paracellular space from fluorescent image stacks and account for volume fraction of tagged proteins (8). These results support the efficacy of the 2-dimensional approach. A fluorescence intensity based approach was performed by summing the grey scale values of each projection image and normalizing against a summed maximum intensity matrix (512 × 512 × 256). Increased fluorescence intensity in response to exposure to both hydrogels and drug carriers follow a trend similar to increases image fraction. There is considerable overlap between the intensity of E-cadherin and claudin-1 which does appear. Although there does appear to be a relationship between immunostaining intensity and tight junction disruption, the differences between groups is much less pronounced (see Fig. 5).
Figure 4.
Image fraction of immunolabeled E-cadherin and claudin-1 in Caco-2 monolayers at lowest resistance value. Z-stack images were at 20x objective power and projections were converted to binary images at a 30% intensity threshold. *, ¥ donate statistically significant difference from control for p<0.00001 and p<0.0001 respectively. Data points are mean ±1 SD. The average E-cadherin image fraction increases 1.71 times the control for microparticle treated group and 1.48 times for EDTA. The average claudin-1 image fraction increased 3.34 and 4.57 times for the microparticle and EDTA treated groups, respectively, versus the control.
Figure 5.
Normalized image intensity of immunolabeled E-cadherin and claudin-1 in Caco-2 monolayers at lowest resistance value. Z-stack images were at 20× objective power. *, ¥ donate statistically significant difference from control for p<0.0008 and p<0.005 respectively. Data points are mean ±1 SD.
The usefulness of the drug carriers evaluated here has been proven for delivering proteins orally to the small intestine. Their permeation enhancement properties may result from more than just calcium chelation. Although not significantly higher than that of the EDTA treated group, E-cadherin disruption was slightly higher in the microparticle treated group. The tight junctions, more specifically the claudins, are known have both a ‘fence’ and ‘gate’ function (7). These highly pegylated of P(MAA-g-EG)microparticles may be enhancing the migration of transmembrane membranes, such as E-cadherin, by affecting membrane fluidity. This would be occur synergistically with the abatement of the calcium dependent gate function of tight junctions. Further investigations would be required to tease apart these processes. Also, the local affect of cell contact carrier bound PEG grafts can not be ruled out. Permeation enhancement in an excess of calcium is the most reasonable method for these carriers in vivo. Calcium is at near saturation at the serosal side of the intestinal mucosa, negating the affects of any agent that would require calcium chelation to increase drug transport. Given this fact, the benefit these particles have shown on insulin transport in preclinical studies must result from other factors such as protease inhibition by grafted PEG chains, mechanical effects, or changes in enterocyte plasma membrane fluidity.
Time is among the imaging parameters that should be varied in future work. The intercellular homophilic interaction between tight junction proteins is a dynamic process. Recovery of transepithelial resistance has been shown after administration and removal of these drug carriers in vitro (4). It would be important to consider the state of tight junction integrity with a quantitative imaging approach after TEER recovery. Also, oral drug delivery can be a chronic or acute therapy. Looking at the effects of repeated carrier administration on the fatigability of tight junction contacts would be an important starting point for future work.
4. CONCLUSIONS
In this work we have initiated the first steps in adding another useful technique for the study of oral protein delivery. The lateral displacement of tight junction proteins was more indicative of permeation enhancement than measurements of transepithelial resistance. By quantifying this displacement, the effects the effect of pH-sensitive P(MAA-g-EG) drug carriers on intestinal mucosa become clearer. The long term goal is to use these systems for the control of biomacromolecular transport in the intestine, not just enhancement. In order to achieve this, all the factors involved in how these systems affect absorption must be identified. This work is a step in that direction.
ACKNOWLEDGEMENTS
This investigation was performed with the generous support of the National Science Foundation Integrative Graduate Education and Research Traineeship program and a grant from National Institutes of Health. The authors would like to acknowledge the technical assistance of Lisa Brannon-Peppas, Ph.D. and Krishnendu Roy Ph.D., both of the University of Texas at Austin, Department of Biomedical Engineering. Access to the vital resources of University of Texas at Austin Institute for Cellular and Molecular Biology and the Texas Material Institute were also greatly appreciated.
REFERENCES
- 1.Blanchette J, Kavimandan N, Peppas NA. Principles of transmucosal delivery of therapeutic agents. Biomed Pharmacother. 2004;58:142–51. doi: 10.1016/j.biopha.2004.01.006. [DOI] [PubMed] [Google Scholar]
- 2.Mullin JM, Agostino N, Rendon-Huerta E, Thornton JJ. Keynote review: epithelial and endothelial barriers in human disease. Drug Discov Today. 2005;10:395–408. doi: 10.1016/S1359-6446(05)03379-9. [DOI] [PubMed] [Google Scholar]
- 3.Madsen F, Peppas NA. Complexation graft copolymer networks: swelling properties, calcium binding and proteolytic enzyme inhibition. Biomaterials. 1999;20:1701–1708. doi: 10.1016/s0142-9612(99)00071-x. [DOI] [PubMed] [Google Scholar]
- 4.Ichikawa H, Peppas NA. Novel complexation hydrogels for oral peptide delivery: in vitro evaluation of their cytocompatibility and insulin-transport enhancing effects using Caco-2 cell monolayers. J Biomed Mater Res A. 2003;67:609–617. doi: 10.1002/jbm.a.10128. [DOI] [PMC free article] [PubMed] [Google Scholar]
- 5.Grasset E, Pinto M, Dussaulx E, Zweibaum A, Desjeux JF. Epithelial properties of human colonic carcinoma cell line Caco-2: electrical parameters. Am J Physiol. 1984;247:C260–C267. doi: 10.1152/ajpcell.1984.247.3.C260. [DOI] [PubMed] [Google Scholar]
- 6.Furuse M, Hata M, Furuse K, Yoshida Y, Haratake A, Sugitani Y, Noda T, Kubo A, Tsukita S. Claudin-based tight junctions are crucial for the mammalian epidermal barrier: a lesson from claudin-1-deficient mice. J Cell Biol. 2002;156:1099–1111. doi: 10.1083/jcb.200110122. [DOI] [PMC free article] [PubMed] [Google Scholar]
- 7.Johnson LG. Applications of imaging techniques to studies of epithelial tight junctions. Adv Drug Deliv Rev. 2005;57:111–121. doi: 10.1016/j.addr.2004.08.004. [DOI] [PubMed] [Google Scholar]
- 8.Wan H, Winton HL, Soeller C, Tovey ER, Gruenert DC, Thompson PJ, Stewart GA, Taylor GW, Garrod DR, Cannell MB, Robinson C. Der p 1 facilitates transepithelial allergen delivery by disruption of tight junctions. J Clin Invest. 1999;104:123–133. doi: 10.1172/JCI5844. [DOI] [PMC free article] [PubMed] [Google Scholar]
- 9.Morishita M, Goto T, Peppas NA, Joseph JI, Torjman MC, Munsick C, Nakamura K, Yamagata T, Takayama K, Lowman AM. Mucosal insulin delivery systems based on complexation polymer hydrogels: effect of particle size on insulin enteral absorption. J Control Rel. 2004;97:115–124. doi: 10.1016/j.jconrel.2004.03.008. [DOI] [PubMed] [Google Scholar]
- 10.Foss AC, Peppas NA. Investigation of the cytotoxicity and insulin transport of acrylic-based copolymer protein delivery systems in contact with Caco-2 cultures. Eur J Pharm Biopharm. 2004;57:447–55. doi: 10.1016/j.ejpb.2004.02.008. [DOI] [PubMed] [Google Scholar]


