

Abstract
Real-world scenes are incredibly complex and heterogeneous, yet we are able to identify and categorize them effortlessly. In humans, the ventral temporal parahippocampal place area (PPA) has been implicated in scene processing, but scene information is contained in many visual areas, leaving their specific contributions unclear. Although early theories of PPA emphasized its role in spatial processing, more recent reports of its function have emphasized semantic or contextual processing. Here, using functional imaging, we reconstructed the organization of scene representations across human ventral visual cortex by analyzing the distributed response to 96 diverse real-world scenes. We found that, although individual scenes could be decoded in both PPA and early visual cortex (EVC), the structure of representations in these regions was vastly different. In both regions, spatial rather than semantic factors defined the structure of representations. However, in PPA, representations were defined primarily by the spatial factor of expanse (open, closed) and in EVC primarily by distance (near, far). Furthermore, independent behavioral ratings of expanse and distance correlated strongly with representations in PPA and peripheral EVC, respectively. In neither region was content (manmade, natural) a major contributor to the overall organization. Furthermore, the response of PPA could not be used to decode the high-level semantic category of scenes even when spatial factors were held constant, nor could category be decoded across different distances. These findings demonstrate, contrary to recent reports, that the response PPA primarily reflects spatial, not categorical or contextual, aspects of real-world scenes.
Introduction
Despite the complexity and heterogeneity of scenes, scene processing produces neural representations capable of supporting a variety of tasks, including navigation, object identification, extraction of semantic information, and guidance of visual attention. Although much of visual cortex clearly contributes to scene processing, research has often focused on the parahippocampal place area (PPA), which responds more strongly when people view scenes or buildings than individual objects or faces (Aguirre et al., 1998; Epstein and Kanwisher, 1998; Levy et al., 2001). Although such scene selectivity suggests a specialized role in scene processing, the precise information extracted by PPA and the nature of the underlying neural representations remain unclear.
Some theories of PPA function suggest that it is primarily involved in encoding the spatial layout of scenes (Maguire et al., 1996; Epstein and Kanwisher, 1998; Park et al., 2011) and the retrieval of familiar scenes (Rosenbaum et al., 2004; Epstein and Higgins, 2007; Hayes et al., 2007). Consistent with these theories, there are anatomical projections from parietal into parahippocampal cortex (Kravitz et al., 2011) and anterograde amnesia for scene layouts has been reported after damage to regions encompassing PPA (Aguirre and D'Esposito, 1999; Barrash et al., 2000). However, more recent reports have proposed that PPA maintains representations of the contextual associations of individual objects rather than scenes, per se. (Bar, 2004; Bar et al., 2008; Gronau et al., 2008) (but see Epstein and Ward, 2010). Finally, it has been proposed that PPA is responsible for natural scene categorization, distinguishing among high-level conceptual categories of scenes (e.g., beaches, buildings) (Walther et al., 2009). Critically, however, other regions, such as early visual cortex (EVC) and object-selective cortex, evidenced equivalent categorization of scenes, making it difficult to determine the unique contribution of PPA.
The aim of the current study was to investigate, in a data-driven manner, the structure of scene representations across human ventral visual cortex using the distributed response patterns. We took advantage of the power of ungrouped event-related designs (Kriegeskorte et al., 2006, 2008b; Kravitz et al., 2010) to test a broad array of scenes from different categories, evenly divided between manmade and natural scenes (Oliva and Torralba, 2001; Joubert et al., 2007). Critically, we further controlled and evaluated the contribution of spatial information, by choosing scenes to equally span differences in expanse (open, closed) and relative distance (near, far) (see Fig. 1) (Oliva and Torralba, 2001; Torralba and Oliva, 2003; Loschky and Larson, 2008; Greene and Oliva, 2009b). Consistent with previous reports (Kay et al., 2008; Walther et al., 2009), the identity of individual scenes could be decoded in both EVC and PPA. However, PPA primarily grouped scenes based on their expanse, whereas grouping in EVC was generally weaker and based on relative distance. Furthermore, the observed grouping in PPA and EVC correlated strongly with behavioral judgments of expanse and relative distance, respectively. Contrary to reports of contextual and category effects in PPA, there was no grouping by content nor any ability to decode scene category either within or across spatial factors. Together, these findings indicate that representations in PPA primarily reflect spatial and not category information.
Figure 1.

Stimulus selection. Scenes were chosen from a broad array of high-level conceptual categories (supplemental Item 1, available at www.jneurosci.org as supplemental material) and equally spanned three dichotomies: content (manmade, natural), expanse (open, closed), and relative distance (near, far). Near and far scenes were differentiated by the relative distance between the viewer and foreground objects within a scene category. Manmade and natural scenes differed in whether the majority of the scene contained artificial or natural objects. Open and closed scenes were defined by whether the scene implied the viewer was in an enclosed space.
Materials and Methods
Participants and testing.
Ten participants (six female), ages 21–35 years, participated in the functional magnetic resonance experiment. For one participant, there was insufficient time to collect the localizer for EVC. Six participants aged 21–28 years participated in the independent behavioral experiment. All participants had normal or corrected-to-normal vision and gave written informed consent. The consent and protocol were approved by the National Institutes of Health Institutional Review Board.
Event-related fMRI stimuli and task.
During the six event-related runs of the fMRI experiment, participants were presented with 96 highly detailed and diverse real-world scenes (1024 × 768 pixels, 20 × 15°) in a randomized order for 500 ms each. Interstimulus intervals (4–12 s) were chosen to optimize the ability of the subsequent deconvolution to extract responses to each scene using the optseq function from AFNI (for Analysis of Functional NeuroImages)/Freesurfer.
To ensure fixation, participants performed a shape-judgment task on the central fixation cross. Specifically, simultaneous with the presentation of each scene, one arm of the fixation cross grew slight longer and participants indicated which arm grew via a button press. Which arm grew was counterbalanced across scenes between runs, such that both arms grew equally often with each scene. We used this task, which was orthogonal to scenes, to measure the structure of scene representations without introducing any confounds or feedback effects caused by task.
The scenes were selected to span the stimulus domain as broadly as possible. Scenes were constrained to represent naturalistic (eye-level) views. The scenes were taken from 16 categories (six exemplars each), divided evenly by content (manmade, natural) (Oliva and Torralba, 2001; Joubert et al., 2007). To test for the relative importance of spatial information, scenes within these categories were chosen to equally span two spatial dichotomies thought to be important for scene perception: expanse (open, closed: the spatial boundary of the scene) and relative distance (near, far: distance to the nearest foreground objects) (Oliva and Torralba, 2001; Torralba and Oliva, 2003; Loschky and Larson, 2008; Greene and Oliva, 2009b; Ross and Oliva, 2010) (Fig. 1) (for full stimulus set, see supplemental Item 1, available at www.jneurosci.org as supplemental material). Scenes were identified as belonging to a particular level of a dichotomy (e.g., open, closed), based on agreement among the authors. In the case of open and closed scenes, which differed in their spatial boundaries, and content, which differed in their constituent objects, the differences were quite clear. Relative distance was defined within each category, and thus exemplars differed considerably in vergence cues and the amount of space depicted, making attributions to either near or far simple. Because each of the 16 categories had both near and far exemplars, each scene reflected one of eight possible classifications (Fig. 1, manmade/closed/near top left two images). Note that all scenes differed from one another at an individual level in their spatial layout.
fMRI localizer stimuli and task.
Four independent block-design scans were also collected in each participant to localize scene-selective, object-selective, and face-selective and EVC regions of interest (ROIs). Each of these scans was an on/off design with alternating blocks of stimuli presented while participants either performed a one-back task (for object, face, scene localizers) or simply maintained fixation (EVC). Scene-selective cortex was localized with the contrast of scenes versus faces, object-selective cortex with the contrast of objects versus retinotopically matched scrambled objects (Kravitz et al., 2010), and face-selective cortex with the contrast of faces versus objects. Scene, object, and face images were grayscale photographs. Peripheral (pEVC) and central (cEVC) EVC were localized with the contrast of central (5°) and peripheral (6–15°) flickering (8 Hz) checkerboards.
fMRI scanning parameters.
Participants were scanned on a research-dedicated GE 3 tesla Signa scanner located in the Clinical Research Center on the National Institutes of Health campus (Bethesda, MD). Partial volumes of the temporal and occipital cortices were acquired using an eight-channel head coil (22 slices; 2 × 2 × 2 mm; 0.2 mm interslice gap; TR, 2 s; TE, 30 ms; matrix size, 96 × 96; FOV, 192 mm). In all scans, oblique slices were oriented approximately parallel to the base of the temporal lobe and generally covered the temporal lobe from its most inferior extent to the superior temporal sulcus and extended posteriorly through all of early visual cortex. Six event-related runs (263 TRs) and eight localizer scans (144 TRs) were acquired in each session.
fMRI preprocessing.
Data were analyzed using the AFNI software package (http://afni.nimh.nih.gov/afni). Before statistical analysis, all of the images for each participant were motion corrected to the first image of their first run after removal of the first and last eight TRs from each run. After motion correction, the localizer runs (but not the event-related runs) were smoothed with a 3 mm full-width at half-maximum Gaussian kernel.
fMRI statistical analysis.
ROIs were created for each participant from the localizer runs. Significance maps of the brain were computed by performing a correlation analysis thresholded at a p value of 0.0001 (uncorrected). ROIs were generated from these maps by taking the contiguous clusters of voxels that exceeded threshold and occupied the appropriate anatomical location based on previous studies (Sayres and Grill-Spector, 2008; Schwarzlose et al., 2008). To ensure that all ROIs were mutually exclusive, we used the following precedence rules to remove overlapping voxels. First, if a voxel showed any position selectivity (center vs periphery), it was deemed retinotopic and excluded from all the category-selective ROIs. Category selectivity is, by necessity, always established by the contrast of two retinotopically distinct categories, and the demonstration that voxel shows any position effects suggests that its selectivity is attributable to simple retinotopy. Second, any voxel that showed selectivity to faces or scenes but did not differentially respond to central or peripheral checkerboards was deemed selective for those categories. Third, any voxel that showed a stronger response to objects than scrambled objects but did not respond differentially to the checkerboards and did not respond more to faces or scenes than objects was included in the object-selective ROIs.
Furthermore, all of the analyses presented below were also performed with all overlapping voxels removed from every ROI, and no significant changes in the results occurred. Finally, we also performed all of the analyses of PPA and pEVC with matching voxel sizes by randomly subsampling pEVC and found no qualitative differences in any of the reported results.
We conducted a standard general linear model using the AFNI software package to deconvolve the event-related responses. Our experiment combined a sparse event-related design with multivoxel pattern analysis, allowing us to assess the response to each individual stimulus and not average across a priori categories of stimuli (ungrouped design). Response patterns in the event-related runs were created by performing t tests between each condition and baseline. The t values for each condition were then extracted from the voxels within each ROI, and we then used an iterative variant (MacEvoy and Epstein, 2007; Chan et al., 2010; Kravitz et al., 2010) of split-half correlation analysis (Haxby et al., 2001; Williams et al., 2008) to establish the similarity between the response patterns of each pair of scenes, once the mean signal was independently removed from each half of the data. This yielded similarity matrices that represent the similarity in the spatial pattern of response across the ROI between each pair of conditions. t values were used because they reduced the impact of noisy voxels on the patterns of response (Misaki et al., 2010), and nearly equivalent results were obtained using the coefficients. Also, to rule out baseline activity differences as the source of any observed effects, all analyses were performed with and without the mean activity removed. The main effect of the removal of the mean activity was a normalization of the data leading to an increase in the structure of resulting similarity matrices and reduction in the overall level of correlation. However, there were no qualitative or significant effects on any of the grouping or discrimination results.
All analyses were also repeated after applying a Fisher transformation to the correlation values. No qualitative or significant effects on any of the results was observed, which is unsurprising given that none of the correlations approached either 1 or −1 and correlations near to zero approximate the normal distribution.
Selectivity analysis.
To investigate the distribution of scene information throughout the whole volume, we performed a novel selectivity analysis. Typical information-based mapping uses a searchlight, which determines what information is available in the response of a local cluster of voxels. Although useful, this approach is forced to assume that information is present only in these local clusters, constrains the sort of information being searched for, and introduces non-independence between adjacent voxels. Our analysis avoids these problems and simply evaluates whether each individual voxel shows any consistent selectivity among our set of 96 stimuli across independent halves of the data.
To determine whether a particular voxel exhibits consistent selectivity among our set of stimuli, we smoothed the event-related data to 3 mm to match our block-design localizers and divided the data into two independent halves, using the same iterative procedure we used for the similarity analysis. We then correlated the relative levels of activation to each of the 96 scenes across the two halves of the data. If a particular voxel is responsive to, but not selective among, our set of scenes, it will produce two sets of responses in the two halves of data that may have the same distribution (i.e., mean, SD), but there will be no correlation between the rank ordering of the responses. Alternatively, a voxel that is both responsive and selective will produce a correlated pattern of selectivity between the two halves of the data. The correlation value assigned to each voxel therefore indicated its consistency of selectivity across our stimuli. These values were then averaged across all the voxels within a region within each participant.
To establish whether a cluster of voxels showed significant selectivity, we used a cluster threshold based on the following randomization procedure. First, we took the data from the independent halves of the data in each participant and then randomized the condition labels and correlated the selectivity. Importantly, the randomization was the same for every voxel, maintaining any non-stimulus-specific relationships between voxels. We then searched the entire volume for the largest contiguous cluster of voxels with correlation values greater than r = 0.168 (p < 0.05). We repeated this procedure 10,000 times for each participant and derived the minimum cluster size that occurred in <5% of the iterations. This cluster size served as a participant-specific threshold for determining which clusters of voxels (r > 0.168, p < 0.05) were significant. The average threshold for cluster size was ∼12.
Behavioral experiment.
Twelve new participants completed three sessions of 576 trials, during which they judged which of a pair of scenes was either more open (expanse), more natural (content), or more distant (distance). Importantly, no specific instructions were given to the participants about what defined each of the dimensions; they were left free to rate stimuli based on their intuitions about the labels given. Ideally, we would have directly measured relative distance within each category of stimuli, but that would have required informing participants of the categories and/or limiting the trials to only comparisons within a category, both of which would have introduced task confounds into our measure of distance.
On each trial, participants were sequentially presented with two scenes from our set of 96 for 500 ms each with a 1 s blank screen between. Participants indicated their chosen scene via a button press. The order of these sessions (expanse, content, distance) was counterbalanced across participants. Furthermore, the trials were chosen such that no trial was ever repeated across participants, so that as many of the comparisons as possible were made.
Because there were not enough trials available to probe every single possible comparison (4560) within a single participant, trials were concatenated across participants. To determine a ranking across our stimulus set for expanse, distance, and content, Elo ratings (Elo, 1978) were derived in the following manner. Each scene was given an initial Elo rating of 1000. Each trial was treated as a match between the two scenes, and the losers and winners rankings were adjusted according to the standard Elo formula (Meng et al., 2010). The final rankings for each scene reflect their relative ranking along the dimension of interest. Because the order of matches impacts the final Elo ratings, 10,000 iterations of this procedure with different random trial orders were averaged together.
Results
The purpose of this study was to perform a data-driven investigation of scene representations across the ventral visual cortex. We presented 96 highly detailed and diverse scenes chosen to both broadly cover the stimulus domain. The scenes were balanced in such a way as to allow us to evaluate the relative contributions of nonspatial factors, such as content (manmade, natural) and high-level category (e.g., beaches, highways), and spatial factors, such as expanse (open, closed) and relative distance (near, far), to scene representations. None of these factors had any preferential status within any of the subsequent analyses, and there was no bias in our design for any, all, or none of these factors or categories to emerge.
Representational structure within cortical regions
In our first test of scene representations, we independently localized scene-, object-, and face-selective regions as well as retinotopic EVC in both hemispheres. Given the limited acquisition volume possible at our high resolution (2 × 2 × 2 mm), our scene-selective regions included both transverse occipital sulcus (TOS) (Epstein et al., 2007) and PPA but not retrosplenial cortex (Epstein and Higgins, 2007). We divided EVC into pEVC and cEVC, given evidence for a peripheral bias in PPA (Levy et al., 2001; Hasson et al., 2002) and for the differential involvement of central and peripheral space in scene perception (Larson and Loschky, 2009). We will focus initially on comparing and contrasting PPA and pEVC, the regions that showed the strongest discrimination and most structured representations.
Within each region, we extracted the pattern of response across voxels to each of the 96 scenes. We then cross-correlated these response patterns to establish the similarity between the response patterns of each pair of scenes. This analysis yielded a 96 × 96 similarity matrix for each region (Fig. 2a,b) wherein each point represents the correlation or similarity between a pair of scenes (Kriegeskorte et al., 2008a; Drucker and Aguirre, 2009). These matrices can be decomposed into two components. First, the points along the main diagonal, from the top left to bottom right corner of the matrix, represent the consistency of the response patterns for the same scene across the two halves of the data (within-scene correlations). Second, the points off the diagonal are the correlations between pairs of different scenes (between-scene correlations). These two components can be used to provide information about both categorization and discrimination of scenes. Specifically, the between-scene correlations define how a region groups scene together (categorization). In contrast, significantly greater within- than between-scene correlations indicate that the region can distinguish between individual scenes from one another (discrimination).
Figure 2.
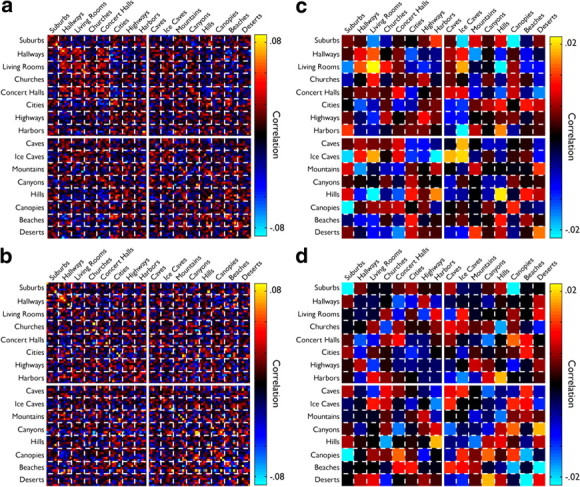
Similarity matrices for PPA and pEVC. a, b, Raw similarity matrices for PPA (a) and pEVC (b) averaged across participants. The matrices comprise 96 × 96 elements, with each point reflecting the amount of correlation in the pattern of response between a pair of scenes. The main diagonal in each matrix from the top left to bottom right corner are the correlations between a scene and itself in the two halves of the data. The matrices are ordered by high-level category, and dashed lines indicate divisions between those categories. The solid lines indicate the division between manmade and natural scenes. Note that, although for both PPA and pEVC the main diagonal shows on average higher correlations than the off-diagonal elements (indicating scene discrimination), there is very little grouping evident in either matrix. c, d, Between-scene correlations from a and b averaged by high-level conceptual category. The main diagonal in these plots reflects the coherence of a high-level category and the off-diagonal represent correlations between categories of scenes. Although some categories appear to exhibit a degree of coherence, note, for example, the high correlations between Living Rooms and Ice Caves, as well as Hills and Harbors, which differ markedly in high-level conceptual properties.
Given previous results on categorization in PPA, we first ordered the raw similarity matrices by scene category and divided scenes by content into manmade and natural. For PPA and pEVC (Fig. 2a,b), it is clear that the patterns of response contain rich information about the presented scenes. In both regions, the within-scene correlations (diagonal) are on average stronger than the between-scene correlations (off-diagonal), indicating an ability to discriminate scenes. This effect is particularly prominent in pEVC (Fig. 2b). However, there is very little structure to the between-scene correlations in pEVC and only mild grouping evident in PPA. Furthermore, neither region shows any consistent grouping of manmade and natural scenes. To better visualize this structure, we averaged the between-scene correlations by high-level category (Fig. 2c,d). In these matrices, the points along the main diagonal reflect the coherence of a scene category. Even within these average matrices, there is only weak evidence for coherent scene categories in PPA (Fig. 2c, high within-category correlations for Living Rooms and Ice Caves) and no obvious coherent categories in pEVC (Fig. 2d). Furthermore, even among the most coherent categories in PPA, there are between-category correlations that violate differences in content. For example, Living Rooms and Ice Caves are well correlated despite vast differences in content and low-level stimulus properties (e.g., color, spatial frequency, luminance, etc).
To better visualize the structure of scene representations in both regions, without assuming the importance of scene categories, we used multidimensional scaling (MDS) (Kriegeskorte et al., 2008a). Each scene was positioned on two-dimensional plane, in which the distance between any pair of scenes reflects the correlation between their response patterns (the higher the correlation the closer the distance) (Fig. 3a,b). This visualization reveals a very striking structure not captured by scene categories in either PPA or pEVC. In PPA, there is clear grouping by expanse, with open scenes to the right and closed scenes to the left. In pEVC, grouping was weaker but defined by relative distance. We verified the strength of these differential groupings between the two regions by reordering the raw similarity matrices (Fig. 2) by these dichotomies (Fig. 3c,d) rather than high-level category. Note that, in some cases, the difference in the structure of scene representations between PPA and pEVC caused large shifts in the pairwise similarity of individual scenes. For example, a church image and a canyon image were similarly categorized by PPA (Fig. 3a, yellow boxes), reflecting enclosed structure, whereas in pEVC, they were categorized as dissimilar (Fig. 3b, yellow boxes) because they had different relative distances. In the following section, we quantify these differences in representational structure between the regions.
Figure 3.
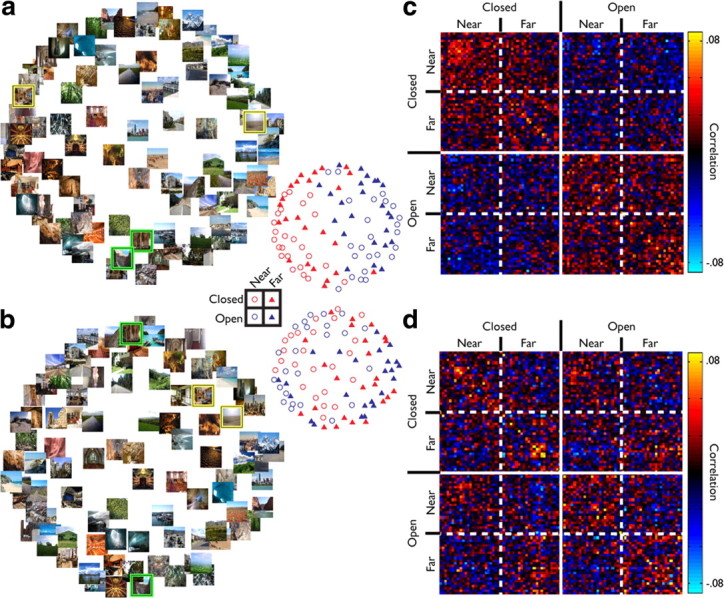
MDS plots for PPA and pEVC. a, b, MDS from PPA (a) and pEVC (b). The main plots and the insets to the right contain the same data points. In the main plots, the scenes are plotted directly, whereas in the insets, the scenes are represented by symbols that reflect the levels of expanse and relative distance. Note that, in PPA, the scenes group by expanse (red vs blue symbols), whereas in pEVC, the scenes group by relative distance (circles vs triangles). The four highlighted scenes (2 yellow boxes, 2 green boxes) in each plot were chosen to highlight the difference in the similarity between pairs of scenes in the two ROIs. The two scenes highlighted in green share the same expanse but differ in relative distance, whereas the scenes highlighted in yellow share relative distance but differ in expanse. Note the difference in their relative positions in the MDS plots from PPA and pEVC. c, d, Raw similarity matrices for PPA (c) and pEVC (d) from Figure 2, a and b, reordered by expanse and relative distance. Solid lines indicate a distinction between open and closed scenes, whereas the dashed lines indicate a distinction between near and far scenes. In PPA (c), note the clear clustering of strong correlations between scenes that shared the same expanse (top left and bottom right quadrant) and the clustering of weak correlation between scenes with different scene boundaries (bottom left and top right quadrants). In contrast, in pEVC, note the clustering of strong correlation between scenes that shared relative distance, evident as a checkerboard pattern.
Comparison of the representational structure in PPA and pEVC
We directly quantified the relative contributions of expanse, relative distance, and content by averaging the between-scene correlations (off-diagonal) across the eight different combinations of the three dichotomies (Fig. 4a,b). We then averaged each row of these matrices according the correlation within and between the various levels of expanse, relative distance, and content (Fig. 4c,d). The resulting correlations were then entered into a four-way repeated-measures ANOVA with expanse (same, different), relative distance (same, different), content (same, different), and region (PPA, pEVC) as factors.
Figure 4.

Categorization in PPA and pEVC. a, b, The off-diagonal points from the raw matrix from Figure 2, a and b, averaged by the eight combinations of expanse, relative distance, and content. The solid lines again denote divisions between closed and open scenes, whereas the dashed lines indicate divisions between near and far scenes. Manmade and natural scenes alternate in that order, such that the first point within any of the small boxes defined by the dotted lines is the average of the manmade scenes and the second is the average of the natural scenes. c, d, Bar plots of the average effects of expanse, relative distance, and content on categorization. Averages were created by averaging across the rows of the matrix after they had been aligned such that switches between the levels of the factors were in agreement. For example, the first solid green bar represents the average effect of keeping expanse and content constant but varying relative distance for all eight of the possible crossings of the three factors. Solid and hashed bars indicate the division between same and different expanse. Effect of holding content constant is plotted in the left, whereas the effect of changing content is plotted in right. In PPA (c), note the large effect of changing expanse (solid vs hashed bars). In contrast in pEVC, note that changing relative distance has the largest effect (orange vs green bars). All error bars indicate the between-subjects SEM.
Grouping was weaker in pEVC than PPA (see also discrimination analysis below) with lower between-scene correlations, resulting in a significant main effect of region (F(1,8) = 19.269, p < 0.01). Furthermore, the contributions of relative distance and expanse were different in the two regions, resulting in highly significant interactions between region × expanse (F(1,8) = 33.709, p < 0.001) and region × relative distance (F(1,8) = 24.361, p < 0.01). Notably, content was not a major contributor to grouping in either region, and no main effects or interactions involving content (all p > 0.16) were observed.
To investigate the differential grouping in the two regions further, data from each region were entered independently in two repeated-measures ANOVAs. In pEVC, relative distance was the only significant factor producing grouping (F(1,8) = 30.554, p < 0.001), and no main effect of expanse or content (p > 0.12) was observed. In contrast, in PPA, expanse was the primary factor producing grouping (F(1,9) = 44.419, p < 0.001), although there was a smaller effect of relative distance (F(1,9) = 18.152, p < 0.01). No interactions between expanse × relative distance were found either within or across the ROIs (p > 0.2). Again, content played no role in grouping, with no main effects or interactions involving content (p > 0.15). Furthermore, even when the matrices were averaged by the semantic categories (e.g., beaches, mountains) used in previous studies (Walther et al., 2009), expanse remained the dominant factor producing grouping (supplemental Item 2, available at www.jneurosci.org as supplemental material) (also see below).
Thus, neither PPA nor pEVC show effects of scene category or content. Instead, both regions group scenes by their spatial aspects, with pEVC showing grouping by relative distance and PPA grouping primarily by expanse. Although the weaker categorization by relative distance in PPA may suggest that some aspects of scene categorization are inherited from pEVC, the absence of an effect of expanse in pEVC implies that the structure of scene representations is transformed between pEVC and PPA.
Comparison of behavior and scene representations in PPA and pEVC
Multivariate designs, by virtue of their large number of conditions, produce data that can be directly correlated with behavior at an individual item level (Kriegeskorte et al., 2008a; Drucker and Aguirre, 2009). To assess whether the representational structure we observed in PPA and pEVC was reflected in behavior, we next directly tested whether the structure of scene representations we measured in PPA and pEVC agreed, at the level of individual scenes, with subjective behavioral ratings from a new set of six participants. The task and instructions used in collecting behavioral judgments will inevitably constrain the resulting data. Therefore, we provided as little instruction as possible, simply asking participants to report which of a sequential pairs of scenes was more open (expanse), more natural (content), or more distant (distance). Participants were free to interpret these labels as they wanted. We used Elo ratings (see Materials and Methods) to derive a ranking for each individual scene for each of the three dichotomies. These rankings turn our dichotomies into dimensions, in which the rating of a scene reflects its subjective openness, naturalness, or depth relative to the other 95 scenes.
First, we used the Elo ratings as independent confirmation of our dichotomies. The content dichotomy was the most clearly reflected in the Elo ratings, with 46 of 48 of the top ranked scenes being natural scenes. The expanse dichotomy was similarly strong, with 40 of 48 of the top ranked scenes being open scenes. To calculate the strength of the relative distance dichotomy, we counted the number of times the far exemplars of a particular high-level category of scene were rated more highly than the near exemplars in that category, which was true for 40 of 48 scenes. To assess the reliability of the ratings, we divided the 12 participants into two groups of six and calculated Elo ratings for each group separately. The ratings for all three dichotomies were highly correlated (expanse, r = 0.92; content, r = 0.94; relative distance, r = 0.86; all p < 0.0001) across the groups, verifying the reliability of the Elo ratings. Thus, independent ratings of the individual scenes by naive observers reliably confirm our original classifications.
Next, we directly compared the Elo ratings with the scene representations we recovered with fMRI in PPA and pEVC. We calculated an fMRI grouping score from the average similarity matrices (Fig. 3c,d) for each scene that reflected how strongly grouped that scene was within a particular dichotomy. For example, the expanse score for a scene was calculated by subtracting its average correlation with the closed scenes from its average correlation with the open scenes. We then correlated these fMRI grouping scores with their respective Elo ratings to determine whether scene representations in each region reflected the behavioral rankings of scenes.
For expanse, we found a very strong correlation between the Elo ratings and expanse scores in PPA (r = 0.67, p < 0.0001) (Fig. 5a) but not in pEVC (r = 0.08, p > 0.1) (Fig. 5b). This difference in correlation was significant (z = 2.16, p < 0.05), suggesting that the pattern of response in PPA more closely reflects behavioral judgments of expanse than does the pattern in pEVC. For content, we found no correlations in either PPA (r = 0.10, p > 0.1) (Fig. 5c) or pEVC (r = 0.07, p > 0.1) (Fig. 5d). Furthermore, in PPA, this correlation was significantly weaker than the correlation between Elo ratings and expanse scores (z = 2.99, p < 0.05), demonstrating that there is a stronger relationship between scene representations in PPA and judgments of expanse than judgments of content. For distance, we found equivalent correlations (p > 0.1) in both PPA (r = 0.54, p < 0.0001) (Fig. 5e) and pEVC (r = 0.31, p < 0.01), consistent with the grouping we observed in both regions. Based on our previous analysis, it might have been expected that the correlation with distance would have been stronger in pEVC than PPA. Their equivalent correlations may reflect a weaker direct contribution of pEVC to conscious judgments about scenes than PPA.
Figure 5.

Comparison of behavioral and imaging data. a, Scatter plot of the Elo ratings for expanse derived from the behavioral experiment against the expanse score calculated from the average similarity matrix in PPA (Fig. 3c) for each scene image. fMRI scores for each scene were calculated by subtracting its average correlation with the closed scenes from its average correlation with the open scenes. A zero fMRI score (horizontal dotted line) indicates equivalent correlation with both open and closed scenes. An Elo score of 1000 (vertical dotted line) indicates that the scene has an average expanse. Note the strong correlation between the fMRI and behavioral measures. Note also the large spread of fMRI scores along the y-axis, reflecting the strong grouping by expanse. b, Same as a but for pEVC. Note the significantly lower correlation between the fMRI and behavioral measures and the smaller spread along the y-axis. c, d, Same as a and b, respectively, but now considering content rather than expanse. Note the significantly lower correlation in PPA than was observed with expanse and the lack of correlation in pEVC. e, f, Same as a and b, respectively, but now considering distance rather than expanse. Note the correlation between the fMRI and behavioral measures in both regions. Note also the larger spread along the y-axis in f, reflecting the stronger grouping by distance in pEVC.
These correlations between the structure of scene representations in fMRI and behavior suggest that the pattern of response in PPA much more strongly reflects subjective judgments about spatial aspects of scenes (expanse, distance) than the content of those same scenes. In contrast, the pattern of response in pEVC reflected only judgments of the distance of those scenes, providing converging evidence for the different scene information captured in pEVC and PPA. Furthermore, these results show that, regardless of what visual statistics drive the responses of pEVC and PPA, the representations they contain directly reflect, and perhaps even contribute to, subjective judgments of high-level spatial aspects of complex scenes.
High-level category information in PPA within and across spatial factors
Our previous analyses confirmed that spatial factors have a greater impact on the structure of scene representations in PPA than nonspatial factors. To directly test whether there was any high-level category information independent from spatial factors, we next considered whether (1) scene category could be decoded when spatial factors were held constant or do scenes from different categories, but with similar spatial properties elicit similar response, and (2) whether scene category could be decoded across spatial factors, or do scenes from the same category, but with different spatial properties, elicit different responses. Because expanse is primarily confounded with category (e.g., all mountain scenes will be open), item 2 could only be tested across relative distance.
To perform these analyses, we needed to consider the near and far exemplars of each of the 16 high-level categories separately (Fig. 1), effectively doubling the number of categories to 32. We then averaged the off-diagonal correlation from the raw similarity matrix for PPA (Fig. 3c) by scene category (Fig. 6a). The points along the diagonal of this matrix represent the average correlation between exemplars of each category. The off-diagonal points represent the correlations between different scene categories or between the near and far exemplars of the same category [Fig. 6a, white ellipses].
Figure 6.

High-level category discrimination in PPA controlling for spatial factors. a, Similarity matrix for PPA averaged by high-level category with spatial factors held constant. Controlling for relative distance effectively doubles the number of high-level categories, as each category had both near and far exemplars. The first eight categories are the near instances of churches, concert halls, hallways, living rooms, canopies, canyons, caves, and ice caves, followed by the far instances of those same categories. The next eight categories are the near instances of cities, harbors, highways, suburbs, beaches, deserts, hills, and mountains, followed by the far instances of those same categories. Note that the diagonal is generally weak, indicating little information about high-level category. b, Bar plot of the discrimination indices for each of the near and far exemplars of each of 16 high-level categories. Discrimination indices were created by subtracting the average correlation between a high-level category and other categories that shared expanse and relative distance from the within category correlation. Positive discrimination indices indicate the presence of high-level category information. Note that only one category (near cities; green bar in b and green circle in a) produces a significant discrimination index under the most liberal test possible. c, Stimuli from the high-level categories of near beaches and cities, the two categories with the highest discrimination indices (purple and green bars in b and circles in a). Note that these two categories of stimuli are also strongly correlated with each other (cyan circle in a) despite sharing only expanse and relative distance and having different content and visual features. d, Bar plot of the discrimination indices for each of the 16 high-level categories across different relative distances. Discrimination indices were the difference between the correlation between near and far exemplars of a high-level category (white ellipses in a) and the average correlation between the near and far exemplars across high-level categories (other values within that square in a). Positive discrimination indices indicate that high-level category could be decoded across different relative distances. Note that only one category (living rooms) produces a significant discrimination index under the most liberal test possible.
To establish whether categories could be distinguished from one another when they shared both expanse and relative distance, discrimination indices were calculated for each category within each combination of the spatial factors (Fig. 6b). These discrimination indices were defined as the difference between the correlation of a category with itself [Fig. 6a] and the average correlation between that category and the other categories that shared expanse and relative distance. These indices were entered into a one-way ANOVA with scene category (32) as a factor. No main effect of scene category was observed (p > 0.15), nor was there significant discrimination across the scene categories on average (p > 0.15), nor did any individual category evidence significant discrimination with a Bonferroni's correction for multiple comparisons (p > 0.3). To apply the most liberal test for category information possible, we conducted one-tailed t tests for each scene category. We found only a single category (near cities) (Fig. 6c) that evidenced any decoding (p < 0.05, uncorrected). Thus, even when spatial factors are held constant, we found no strong evidence for scene category representations.
To establish whether high-level scene category could be decoded across variations in spatial factors, we calculated discrimination indices for each category across the two levels of relative distance (Fig. 6d). These discrimination indices were defined as the difference between the correlation of the near and far exemplars of a category with each other [Fig. 6a, white ellipses] and the average correlation between the near and far exemplars of that category and other categories. These indices were entered into a one-way ANOVA with scene category (16) as a factor. No main effect of scene category was observed (p > 0.375), nor was there significant discrimination across the scene categories on average (p > 0.15), nor did any individual category evidence significant discrimination with a Bonferroni's correction for multiple comparisons (all p > 0.3). Again, we applied the most liberal test for category information and conducted one-tailed t tests for each scene category. We found only a single category (living rooms) that evidenced any decoding (p < 0.05, uncorrected).
In summary, in contrast to reports emphasizing the representation of scene category in PPA (Walther et al., 2009), we found no evidence for decoding of scene categories in PPA when spatial factors are controlled. We found no ability to decode high-level category across different levels of relative distance. We found no evidence for content as a significant contributor to the overall structure of representations in PPA or pEVC. We also found no correlation between scene representations in PPA or pEVC and subjective judgments of content and significantly weaker behavioral correlations for content than expanse. Although it is possible that these nonspatial factors do have some impact on scene representations in these regions, that impact is clearly minor compared with the spatial factors of expanse and relative distance.
Scene discrimination in PPA and pEVC
Although the grouping of between-scene correlations provides insight into how these regions categorize scenes, the difference between within- and between-scene correlations provides an index of scene discrimination. For this analysis, it was critical that we consider only between-scene correlations that did not cross any grouping boundary. Otherwise, our discrimination measure would be implicitly confounded with grouping. Given the strong evidence for both expanse and relative distance as categories, we consider discrimination between scenes within the combinations of these factors separately (four white squares encompassing the main diagonal in Fig. 2a,b), collapsing across differences in content.
Within- and between-scene correlations were extracted from each of the four combinations of expanse and relative distance (supplemental Item 3, available at www.jneurosci.org as supplemental material). These correlations were then averaged and subtracted from one another to yield discrimination scores (Fig. 7a,b). There was a broad ability to discriminate scenes in both regions, with significant discrimination (p < 0.05) observed in every condition except for near, closed scenes in PPA. To investigate the pattern of discrimination between the two regions, discrimination scores were entered into a three-way repeated-measures ANOVA with expanse (open, closed), relative distance (near, far), and region (PPA, pEVC) as factors. Discrimination was stronger in pEVC that PPA, resulting in a significant main effect of ROI (F(1,8) = 18.838, p < 0.01). Discrimination was also generally stronger for near than far scenes, resulting in a significant main effect of relative distance (F(1,9) = 9.793, p < 0.05), although this effect was stronger in pEVC, resulting in a significant interaction between region × relative distance (F(1,8) = 8.898, p < 0.05). Separate ANOVAs within each region confirmed the larger effect of relative distance in pEVC (F(1,8) = 15.477, p < 0.01) than in PPA (F(1,9) = 5.328, p < 0.05) but revealed no additional effects (all p > 0.3). These results demonstrate that, even within scenes that are grouped together, there is significant information about the individual scenes.
Figure 7.

Discrimination in PPA and pEVC. a, b, Bar plots of the discrimination indices for each combination of expanse and relative distance. Discrimination indices were created by subtracting the average between-scene correlation from the average within-scene correlation. PPA (a) and pEVC (b) exhibit the same pattern of discrimination across near and far, open and closed scenes, although discrimination was stronger in pEVC than PPA. * indicates the presence of significant discrimination (p < 0.05). All error bars indicate the between-subjects SEM. c, Comparison of discrimination indices for each scene in PPA and pEVC. Each point is a single scene, whose symbol reflects its expanse and relative distance. Dashed lines indicate the location of 0 for both pEVC (x-axis) and PPA (y-axis). Most points fall on the positive side of these lines, indicating that the individual scenes can be discriminated from the other scenes. The solid line is the unity line. Note that most points fall to the right of this line, indicating stronger discrimination in pEVC than in PPA.
The gross pattern of scene discrimination was very similar in both pEVC and PPA. To investigate the relationship between discriminability in the two regions in greater detail, we calculated discrimination indices for each individual scene and then correlated them across pEVC and PPA (Fig. 7c). The high correlation (r = 0.659, p < 0.001) between the discrimination indices suggests that the distinctiveness of the representation of a scene in PPA is directly related to its distinctiveness in pEVC.
Together, the results of the discrimination and categorization analyses suggest a transformation of scene representations between pEVC and PPA. Clearly the discriminability of scene representations in PPA reflects discriminability in pEVC. However, PPA sacrifices some scene discriminability, perhaps to better categorize scenes by their spatial expanse. Thus, PPA maintains less distinct representations of scenes that seem broadly organized to capture spatial aspects of scenes.
Categorization and discrimination in other cortical regions
In addition to PPA and pEVC, we also investigated cEVC, TOS, object-selective regions lateral occipital (LO) and posterior fusiform sulcus (PFs), and the face-selective occipital face area (OFA) and fusiform face area (FFA).
cEVC was similar to pEVC in its pattern of discrimination (supplemental Item 4, available at www.jneurosci.org as supplemental material) but showed no scene categorization. This difference in categorization between cEVC and pEVC led to a significant relative distance × region interaction (F(1,8) = 29.901, p < 0.01) when categorization averages were entered into a four-way ANOVA with expanse, relative distance, content, and region (cEVC, pEVC) as factors. This suggests that pEVC contains more structured scene representations than cEVC and highlights the likely importance of pEVC in scene processing (Levy et al., 2001; Hasson et al., 2002). However, it must be noted that cEVC represents the portion of space containing the fixation cross, on which the participants were performing the task. Although the cross was very small (∼0.5°) relative to the central localizer (5°), it cannot be ruled out that this overlap impacted results in cEVC.
Scene representations in TOS had a structure similar to PPA but were less categorical. Scene discrimination in TOS and PPA were similar (supplemental Item 4, available at www.jneurosci.org as supplemental material), but categorization by expanse was weaker. This weaker categorization led to a significant interaction between expanse × region (F(1,9) = 11.714, p < 0.01) when categorization averages from TOS and PPA were entered in a four-way ANOVA. In TOS, as in PPA, there was a trend for weak categorization by relative distance (F(1,9) = 4.548, p = 0.06) and no effects involving content (all p > 0.25).
The object-selective regions (supplemental Item 5, available at www.jneurosci.org as supplemental material) did not seem particularly involved in processing the scene stimuli. LO evidenced some weak discrimination of scenes and no categorization by any of the three dichotomies (all p > 0.1). PFs showed no scene discrimination and some categorization by expanse but far more weakly than that observed in PPA, resulting in a highly significant region × expanse interaction (F(1,8) = 17.382, p < 0.01). It is likely that the short presentations times and the scenes we chose, which did not contain strong central objects, reduced the ability of object-selective cortex to extract individual objects from the scenes.
The results from the face-selective regions (supplemental Item 6, available at www.jneurosci.org as supplemental material) confirmed they contribute little to scene processing (see below, Selectivity analysis). Neither of the face-selective regions evidenced any categorization by the three dichotomies (all p > 0.2). Neither region showed much ability to discriminate between scenes, with FFA showing significant discrimination only for far, closed scenes and OFA for far, open scenes.
Overall, at least some discrimination was possible based on the response of a number of cortical regions, although strongest discrimination was found in EVC, PPA, and TOS. In contrast, grouping was primarily confined to PPA, EVC, and TOS. Importantly, EVC grouped primarily by relative distance, whereas PPA and TOS both grouped primarily by expanse.
Selectivity analysis
So far we have focused on examining scene categorization and discrimination within regions defined by their category selectivity. However, the contrast of a preferred and nonpreferred stimulus class (Kanwisher et al., 1997; Epstein and Kanwisher, 1998) implies that a region might be identified as specialized for a particular stimulus class because of a difference in response between these conditions and not necessarily because the region maintains any fine-grained representation of that class. Here we took advantage of our ungrouped design and searched for regions that showed consistent selectivity among the set of 96 scenes. This analysis provides an alternate way to identify regions important in scene representation and allows us to investigate whether any other regions are also important.
The aim of this analysis was to identify voxels in a whole-volume search that show consistent selectivity for the set of scene images. Selectivity was defined by the response profile across all 96 scenes in a single voxel (Erickson et al., 2000). We computed the consistency of selectivity by calculating the correlation of the response profile between independent halves of the data. We then produced maps of the correlation values, deriving cluster thresholds using a randomization procedure to determine which voxels were significantly selective (see Materials and Methods). Given the breadth of our scene stimuli, voxels that do not show at least a modicum of consistency in their selectivity are unlikely to be involved in scene processing.
We found that the vast majority of the consistently selective voxels (∼76%) lay within our predefined regions, indicating that these regions primarily contain the core voxels involved in scene-processing in our volume (Fig. 8a).
Figure 8.

Selectivity analysis. a, The left column shows the significantly selective clusters of voxels (see Materials and Methods) for each of three example participants. The right column shows the ROIs for those same participants. Note the large overlap between the significant clusters and the PPA and pEVC ROIs. b, Plot of the average selectivity correlation within each independently defined ROI. * indicate significant selective correlations (p > 0.05). Note that significant selectivity correlations were observed only in EVC and the scene-selective ROIs. Note also the stronger selectivity correlations in pEVC than cEVC. c, Plot of the proportion of voxels within significant clusters that overlapped with each ROI. * indicate significant overlap between the ROIs and clusters. Note again the significant overlap only between the EVC and scene-selective ROIs and the clusters. Note also the greater overlap between pEVC than cEVC and the clusters. All error bars indicate the between-subject SEM.
We next quantified the average selectivity within each of our predefined ROIs (Fig. 8b). As expected, significant selectivity (p < 0.05) was observed only within scene-selective and EVC ROIs. In EVC, there was significantly greater selectivity in pEVC than cEVC (F(1,8) = 21.991, p < 0.01). To confirm there was greater selectivity in scene-selective cortex than in either object- or face-selective cortex, their selectivity scores were entered into a two-way ANOVA with selectivity (scene, object, face) and location (anterior, posterior) as factors. The only effect observed was a main effect of selectivity (F(2,16) = 6.769, p < 0.01, Greenhouse–Geisser corrected) as a result of the greater selectivity observed in the scene-selective than in either the object-selective (F(1,8) = 8.105, p < 0.05) or face-selective (F(1,8) = 9.069, p < 0.05) ROIs.
Finally, we quantified the amount of overlap between each ROI and the significantly selective clusters derived from the whole volume search (Fig. 8c). Again, significant overlap was present only between the EVC and scene-selective ROIs (p < 0.05). The advantage for pEVC over cEVC in both mean selectivity and overlap with selective voxels is in keeping with the theory that PPA has a bias for the peripheral visual field (Levy et al., 2001; Hasson et al., 2002). In combination, these two selectivity analyses suggest that our analysis of pEVC and PPA captured the majority of the scene processing voxels in the ventral visual pathway.
In summary, using a voxelwise measure of scene selectivity, based only on responses to scenes, we found that our ROIs captured the vast majority of voxels with consistent scene selectivity. Furthermore, selectivity was most stable in PPA, pEVC, and TOS, consistent with our analyses of categorization and discrimination.
Discussion
Real-world scenes are perhaps the most complex domain for which specialized cortical regions have been identified. Here, we demonstrated that, although many visual areas contain information about real-world scenes, the structure of the underlying representations are vastly different. Critically, we were able to establish, without making previous assumptions, that expanse is the primary dimension reflected in PPA. Surprisingly, neither high-level scene category nor gross content (manmade, natural) seemed to play a major role in the structure of the representations. In contrast, pEVC grouped scenes by relative distance and maintained stronger discrimination of individual scenes than observed in PPA. Furthermore, the structure of representations observed with fMRI corresponded closely with independent behavioral ratings of the scene stimuli, with high correlations in PPA for ratings of scene openness but not content. This specific pattern of brain-behavior correlation suggests that subjective judgments of spatial but not nonspatial aspects of scenes are well captured by, and perhaps dependent, on the response of PPA. These findings provide critical insight into the nature of high-level cortical scene representations and highlight the importance of determining the structure of representations within a region beyond whether those representations are distinct enough to be decoded.
To date, the problem of differentiating between competing accounts of PPA and determining the specific contributions of different visual areas to scene processing has been the complexity and heterogeneity of real-world scenes. First, typical fMRI studies contrast only a small set of preselected conditions or categories, presenting blocks of these conditions or averaging over event-related responses to individual exemplars. These designs are implicitly constrained to show differences only between the tested categories or conditions, potentially missing other more important differences. Second, the analysis of these studies also assumes that the response to each exemplar within a category is equivalent. Although this assumption is justified in simple domains in which there are minimal differences between stimuli, the heterogeneity of scenes makes it more tenuous. For example, the identity of individual scenes can be decoded even from the response of EVC (Kay et al., 2008). Thus, a difference between conditions might reflect bias in the study design, differences in exemplars, or differences in the homogeneity of stimuli within conditions (Thierry et al., 2007) rather than revealing a critical difference in scene representations. Finally, the paucity of conditions in standard designs also makes it difficult to establish the relative importance of different factors in scene representations in a single study (e.g., spatial vs category differences). The strength of the our approach is the ability to present a multitude of stimuli, evaluate the response to each stimulus individually, and establish the relative importance of various factors in defining the structure of representations.
Taking advantage of an ungrouped design (supplemental Item 7, available at www.jneurosci.org as supplemental material), we were able to directly contrast the impact of spatial and nonspatial information on scene representations. Our results further support the theory, based on activation studies, that PPA is part of network of regions specialized for processing the spatial layout of scenes (Epstein et al., 1999; Henderson et al., 2007; Epstein, 2008). The strong grouping of scenes by expanse (Park et al., 2011) and relative distance, paired with the absence of grouping by content, is inconsistent with theories suggesting that the primary function of PPA is distinguishing scene categories (Walther et al., 2009) or, based on activation studies, representing nonspatial contextual associations between objects (Bar, 2004; Bar et al., 2008; Gronau et al., 2008). This is not to suggest that PPA contains no nonspatial scene information; it is possible that other methods that more directly measure the within voxel selectivity [e.g., adaption (Drucker and Aguirre, 2009)] would reveal a different pattern of results. Our results simply show that the dominant factors in defining the macroscopic response of PPA are spatial. This finding is also consistent with reports of PPA activation during scene encoding (Epstein et al., 1999; Ranganath et al., 2004; Epstein and Higgins, 2007), adaption studies showing viewpoint-specific representations in PPA (Epstein et al., 2003), and anterograde amnesia for novel scene layouts with damage to parahippocampal regions (Aguirre and D'Esposito, 1999; Barrash et al., 2000; Takahashi and Kawamura, 2002; Mendez and Cherrier, 2003).
Our findings contradict a recent study reporting categorization for “natural scene categories” (e.g., forests, mountains, industry) (Walther et al., 2009) in PPA. However, in this study, there was no control for spatial factors, including relative distance and expanse. Therefore, the ability to decode, for example, highways versus industry could partly reflect the different relative distances within each category or the fact that industry scenes were more likely to have a closed expanse. Similarly, the confusions of their classifier between beaches, highways, and mountains could reflect their shared open expanse. This hypothesis is supported by our inability to decode category when spatial factors were held constant or to decode category across variations in relative distance (Fig. 6). Finally, the scenes in this previous study often contained prominent objects (e.g., cars), or even people, and this might explain the equivalent decoding accuracy between PPA and object- and face-selective regions, whereas we found only weak discrimination and no categorization within these areas.
In PPA, it is also possible that low-level features account for some of the observed grouping effects. In particular, there is a difference in the spatial frequency envelopes of closed and open scenes (supplemental Item 8, available at www.jneurosci.org as supplemental material). Furthermore, it is tempting to suggest that categorization by expanse might reflect the fact that the open scenes often contained sky, despite the absence of any such categorization in EVC. However, this explanation cannot account for the strong discrimination of open far scenes (which shared sky). Furthermore, scene inversion, which should not change the effect of sky or differences in spatial frequencies, has been shown to have a strong impact on both decoding (Walther et al., 2009) and response (Epstein et al., 2006) in PPA. Nonetheless, there must be some visual statistic or combination thereof that is the basis for grouping by expanse in PPA, because all visual representations, whether high or low level, must reflect some difference in the images. The key observation in this study is that the representations in PPA can properly be called spatial because they (1) differ significantly from those observed in early visual cortex and (2) primarily capture differences in spatial information across complex scenes, (3) their structure directly reflects independent behavioral judgments of the spatial and not nonspatial structure of the scenes, and (4) lesions of parahippocampal cortex lead to impairments in the spatial processing of scenes (Aguirre and D'Esposito, 1999).
Grouping in EVC likely reflects some low-level features present in the scenes. However, neither the pixelwise similarity (supplemental Item 9, available at www.jneurosci.org as supplemental material) from either the peripheral or central portion of the scenes nor the spatial frequency (supplemental Item 8, available at www.jneurosci.org as supplemental material) across the entire image seem to individually account for the grouping of scenes by relative distance. Instead, this grouping likely reflects a complex combination of retinotopic, spatial frequency, and orientation information interacting with the structure of EVC (Kay et al., 2008).
There are two possible sources of spatial information in PPA. First, position information has been reported in PPA (Arcaro et al., 2009) (but see MacEvoy and Epstein, 2007) and other high-level visual areas (Schwarzlose et al., 2008; Kravitz et al., 2010), suggesting feedforward processing of spatial information. PPA might also receive spatial information from its connections with the retrosplenial cortex, posterior cingulate, and parietal cortex (Kravitz et al., 2011). Additional research is needed to address this question, but ultimately, which factors contribute to the formation of a representation and its actual structure are distinct.
The push/pull relationship between discrimination and categorization observed in PPA and pEVC suggests that low-level representations may be important in supporting quick discriminations of complex stimuli (Bacon-Macé et al., 2007; Greene and Oliva, 2009a), whereas high-level representations are specialized to support more abstract or specialized actions (e.g., navigation). Thus, discrimination of complex stimuli based on the response of EVC (Kay et al., 2008) must be interpreted with reference to the particular tasks that response is likely to support, especially given reports that the presence of stimulus information in a region is not necessarily reflected in behavior (Williams et al., 2007; Walther et al., 2009). Our results demonstrate that the critical factors that define high-level representations may not be present within or even predictable from the response of EVC, nor can EVC be ignored given the clear inheritance of many aspects of scene representation by PPA; rather, the response of both EVC and high-level cortex must be considered in any account of complex visual processing.
In conclusion, we have shown with a data-driven approach that spatial and not high-level category information is the dominant factor in how PPA categorizes scenes. Although information about scene was present in other visual regions, including EVC, grouping of scenes varied enormously. These results demonstrate the importance of understanding the structure of representations beyond whether individual presented items can be decoded.
Footnotes
This work was supported by the National Institute of Mental Health Intramural Research Program. Thanks to Marlene Behrmann, Assaf Harel, Alex Martin, Dale Stevens, and other members of the Laboratory of Brain and Cognition, National Institute of Mental Health for helpful comments and discussion.
References
- Aguirre GK, D'Esposito M. Topographical disorientation: a synthesis and taxonomy. Brain. 1999;122:1613–1628. doi: 10.1093/brain/122.9.1613. [DOI] [PubMed] [Google Scholar]
- Aguirre GK, Zarahn E, D'Esposito M. An area within human ventral cortex sensitive to “building” stimuli: evidence and implications. Neuron. 1998;21:373–383. doi: 10.1016/s0896-6273(00)80546-2. [DOI] [PubMed] [Google Scholar]
- Arcaro MJ, McMains SA, Singer BD, Kastner S. Retinotopic organization of human ventral visual cortex. J Neurosci. 2009;29:10638–10652. doi: 10.1523/JNEUROSCI.2807-09.2009. [DOI] [PMC free article] [PubMed] [Google Scholar]
- Bacon-Macé N, Kirchner H, Fabre-Thorpe M, Thorpe SJ. Effects of task requirements on rapid natural scene processing: from common sensory encoding to distinct decisional mechanisms. J Exp Psychol Hum Percept Perform. 2007;33:1013–1026. doi: 10.1037/0096-1523.33.5.1013. [DOI] [PubMed] [Google Scholar]
- Bar M. Visual objects in context. Nat Rev Neurosci. 2004;5:617–629. doi: 10.1038/nrn1476. [DOI] [PubMed] [Google Scholar]
- Bar M, Aminoff E, Schacter DL. Scenes unseen: the parahippocampal cortex intrinsically subserves contextual associations, not scenes or places per se. J Neurosci. 2008;28:8539–8544. doi: 10.1523/JNEUROSCI.0987-08.2008. [DOI] [PMC free article] [PubMed] [Google Scholar]
- Barrash J, Damasio H, Adolphs R, Tranel D. The neuroanatomical correlates of route learning impairment. Neuropsychologia. 2000;38:820–836. doi: 10.1016/s0028-3932(99)00131-1. [DOI] [PubMed] [Google Scholar]
- Chan AW, Kravitz DJ, Truong S, Arizpe J, Baker CI. Cortical representations of bodies and faces are strongest in their commonly experienced configurations. Nat Neurosci. 2010;13:417–418. doi: 10.1038/nn.2502. [DOI] [PMC free article] [PubMed] [Google Scholar]
- Drucker DM, Aguirre GK. Different spatial scales of shape similarity representation in lateral and ventral LOC. Cereb Cortex. 2009;19:2269–2280. doi: 10.1093/cercor/bhn244. [DOI] [PMC free article] [PubMed] [Google Scholar]
- Elo A. The rating of chessplayers, past and present. New York: Arco; 1978. [Google Scholar]
- Epstein R, Kanwisher N. A cortical representation of the local visual environment. Nature. 1998;392:598–601. doi: 10.1038/33402. [DOI] [PubMed] [Google Scholar]
- Epstein R, Harris A, Stanley D, Kanwisher N. The parahippocampal place area: recognition, navigation, or encoding? Neuron. 1999;23:115–125. doi: 10.1016/s0896-6273(00)80758-8. [DOI] [PubMed] [Google Scholar]
- Epstein R, Graham KS, Downing PE. Viewpoint-specific scene representations in human parahippocampal cortex. Neuron. 2003;37:865–876. doi: 10.1016/s0896-6273(03)00117-x. [DOI] [PubMed] [Google Scholar]
- Epstein RA. Parahippocampal and retrosplenial contributions to human spatial navigation. Trends Cogn Sci. 2008;12:388–396. doi: 10.1016/j.tics.2008.07.004. [DOI] [PMC free article] [PubMed] [Google Scholar]
- Epstein RA, Higgins JS. Differential parahippocampal and retrosplenial involvement in three types of visual scene recognition. Cereb Cortex. 2007;17:1680–1693. doi: 10.1093/cercor/bhl079. [DOI] [PubMed] [Google Scholar]
- Epstein RA, Ward EJ. How reliable are visual context effects in the parahippocampal place area? Cereb Cortex. 2010;20:294–303. doi: 10.1093/cercor/bhp099. [DOI] [PMC free article] [PubMed] [Google Scholar]
- Epstein RA, Higgins JS, Parker W, Aguirre GK, Cooperman S. Cortical correlates of face and scene inversion: a comparison. Neuropsychologia. 2006;44:1145–1158. doi: 10.1016/j.neuropsychologia.2005.10.009. [DOI] [PubMed] [Google Scholar]
- Epstein RA, Higgins JS, Jablonski K, Feiler AM. Visual scene processing in familiar and unfamiliar environments. J Neurophysiol. 2007;97:3670–3683. doi: 10.1152/jn.00003.2007. [DOI] [PubMed] [Google Scholar]
- Erickson CA, Jagadeesh B, Desimone R. Clustering of perirhinal neurons with similar properties following visual experience in adult monkeys. Nat Neurosci. 2000;3:1143–1148. doi: 10.1038/80664. [DOI] [PubMed] [Google Scholar]
- Greene MR, Oliva A. The briefest of glances: the time course of natural scene understanding. Psychol Sci. 2009a;20:464–472. doi: 10.1111/j.1467-9280.2009.02316.x. [DOI] [PMC free article] [PubMed] [Google Scholar]
- Greene MR, Oliva A. Recognition of natural scenes from global properties: seeing the forest without representing the trees. Cogn Psychol. 2009b;58:137–176. doi: 10.1016/j.cogpsych.2008.06.001. [DOI] [PMC free article] [PubMed] [Google Scholar]
- Gronau N, Neta M, Bar M. Integrated contextual representation for objects' identities and their locations. J Cogn Neurosci. 2008;20:371–388. doi: 10.1162/jocn.2008.20027. [DOI] [PubMed] [Google Scholar]
- Hasson U, Levy I, Behrmann M, Hendler T, Malach R. Eccentricity bias as an organizing principle for human high-order object areas. Neuron. 2002;34:479–490. doi: 10.1016/s0896-6273(02)00662-1. [DOI] [PubMed] [Google Scholar]
- Haxby JV, Gobbini MI, Furey ML, Ishai A, Schouten JL, Pietrini P. Distributed and overlapping representations of faces and objects in ventral temporal cortex. Science. 2001;293:2425–2430. doi: 10.1126/science.1063736. [DOI] [PubMed] [Google Scholar]
- Hayes SM, Nadel L, Ryan L. The effect of scene context on episodic object recognition: parahippocampal cortex mediates memory encoding and retrieval success. Hippocampus. 2007;17:873–889. doi: 10.1002/hipo.20319. [DOI] [PMC free article] [PubMed] [Google Scholar]
- Henderson JM, Larson CL, Zhu DC. Cortical activation to indoor versus outdoor scenes: an fMRI study. Exp Brain Res. 2007;179:75–84. doi: 10.1007/s00221-006-0766-2. [DOI] [PubMed] [Google Scholar]
- Joubert OR, Rousselet GA, Fize D, Fabre-Thorpe M. Processing scene context: fast categorization and object interference. Vision Res. 2007;47:3286–3297. doi: 10.1016/j.visres.2007.09.013. [DOI] [PubMed] [Google Scholar]
- Kanwisher N, McDermott J, Chun MM. The fusiform face area: a module in human extrastriate cortex specialized for face perception. J Neurosci. 1997;17:4302–4311. doi: 10.1523/JNEUROSCI.17-11-04302.1997. [DOI] [PMC free article] [PubMed] [Google Scholar]
- Kay KN, Naselaris T, Prenger RJ, Gallant JL. Identifying natural images from human brain activity. Nature. 2008;452:352–355. doi: 10.1038/nature06713. [DOI] [PMC free article] [PubMed] [Google Scholar]
- Kravitz DJ, Kriegeskorte N, Baker CI. High-level object representations are constrained by position. Cereb Cortex. 2010;20:2916–2925. doi: 10.1093/cercor/bhq042. [DOI] [PMC free article] [PubMed] [Google Scholar]
- Kravitz DJ, Saleem KS, Baker CI, Mishkin M. A new neural framework for visuospatial processing. Nat Rev Neurosci. 2011;12:217–230. doi: 10.1038/nrn3008. [DOI] [PMC free article] [PubMed] [Google Scholar]
- Kriegeskorte N, Goebel R, Bandettini P. Information-based functional brain mapping. Proc Natl Acad Sci U S A. 2006;103:3863–3868. doi: 10.1073/pnas.0600244103. [DOI] [PMC free article] [PubMed] [Google Scholar]
- Kriegeskorte N, Mur M, Bandettini P. Representational similarity analysis: connecting the branches of systems neuroscience. Front Syst Neurosci. 2008a;2:4. doi: 10.3389/neuro.06.004.2008. [DOI] [PMC free article] [PubMed] [Google Scholar]
- Kriegeskorte N, Mur M, Ruff DA, Kiani R, Bodurka J, Esteky H, Tanaka K, Bandettini PA. Matching categorical object representations in inferior temporal cortex of man and monkey. Neuron. 2008b;60:1126–1141. doi: 10.1016/j.neuron.2008.10.043. [DOI] [PMC free article] [PubMed] [Google Scholar]
- Larson AM, Loschky LC. The contributions of central of peripheral vision to scene gist recognition. J Vis. 2009;9:1–16. doi: 10.1167/9.10.6. [DOI] [PubMed] [Google Scholar]
- Levy I, Hasson U, Avidan G, Hendler T, Malach R. Center-periphery organization of human object areas. Nat Neurosci. 2001;4:533–539. doi: 10.1038/87490. [DOI] [PubMed] [Google Scholar]
- Loschky LC, Larson AM. Localized information is necessary for scene categorization, including the natural/man-made distinction. J Vis. 2008;8:4.1–4.9. doi: 10.1167/8.1.4. [DOI] [PubMed] [Google Scholar]
- MacEvoy SP, Epstein RA. Position selectivity in scene- and object-responsive occipitotemporal regions. J Neurophysiol. 2007;98:2089–2098. doi: 10.1152/jn.00438.2007. [DOI] [PubMed] [Google Scholar]
- Maguire EA, Frackowiak RS, Frith CD. Learning to find your way: a role for the human hippocampal formation. Proc Biol Sci. 1996;263:1745–1750. doi: 10.1098/rspb.1996.0255. [DOI] [PubMed] [Google Scholar]
- Mendez MF, Cherrier MM. Agnosia for scenes in topographagnosia. Neuropsychologia. 2003;41:1387–1395. doi: 10.1016/s0028-3932(03)00041-1. [DOI] [PubMed] [Google Scholar]
- Meng M, Cherian T, Signal G, Sinha P. Functional lateralization of face processing. J Vis. 2010;10:562. [Google Scholar]
- Misaki M, Kim Y, Bandettini PA, Kriegeskorte N. Comparison of multivariate classifiers and response normalizations for pattern-information fMRI. Neuroimage. 2010;53:103–118. doi: 10.1016/j.neuroimage.2010.05.051. [DOI] [PMC free article] [PubMed] [Google Scholar]
- Oliva A, Torralba A. Modeling the shape of the scene: a holistic representation of the spatial envelope. Int J Comput Vision. 2001;42:145–175. [Google Scholar]
- Park S, Brady TF, Greene MR, Oliva A. Disentangling scene content from spatial boundary: complementary roles for the parahippocampal place area and lateral occipital complex in representing real-world scenes. J Neurosci. 2011;31:1333–1340. doi: 10.1523/JNEUROSCI.3885-10.2011. [DOI] [PMC free article] [PubMed] [Google Scholar]
- Ranganath C, DeGutis J, D'Esposito M. Category-specific modulation of inferior temporal activity during working memory encoding and maintenance. Brain Res Cogn Brain Res. 2004;20:37–45. doi: 10.1016/j.cogbrainres.2003.11.017. [DOI] [PubMed] [Google Scholar]
- Rosenbaum RS, Ziegler M, Winocur G, Grady CL, Moscovitch M. “I have often walked down this street before”: fMRI studies on the hippocampus and other structures during mental navigation of an old environment. Hippocampus. 2004;14:826–835. doi: 10.1002/hipo.10218. [DOI] [PubMed] [Google Scholar]
- Ross MG, Oliva A. Estimating perception of scene layout properties from global image features. J Vis. 2010;10:2.1–2.25. doi: 10.1167/10.1.2. [DOI] [PubMed] [Google Scholar]
- Sayres R, Grill-Spector K. Relating retinotopic and object-selective responses in human lateral occipital cortex. J Neurophysiol. 2008;100:249–267. doi: 10.1152/jn.01383.2007. [DOI] [PMC free article] [PubMed] [Google Scholar]
- Schwarzlose RF, Swisher JD, Dang S, Kanwisher N. The distribution of category and location information across object-selective regions in human visual cortex. Proc Natl Acad Sci U S A. 2008;105:4447–4452. doi: 10.1073/pnas.0800431105. [DOI] [PMC free article] [PubMed] [Google Scholar]
- Takahashi N, Kawamura M. Pure topographical disorientation–the anatomical basis of landmark agnosia. Cortex. 2002;38:717–725. doi: 10.1016/s0010-9452(08)70039-x. [DOI] [PubMed] [Google Scholar]
- Thierry G, Martin CD, Downing P, Pegna AJ. Controlling for interstimulus perceptual variance abolishes N170 face selectivity. Nat Neurosci. 2007;10:505–511. doi: 10.1038/nn1864. [DOI] [PubMed] [Google Scholar]
- Torralba A, Oliva A. Statistics of natural image categories. Network. 2003;14:391–412. [PubMed] [Google Scholar]
- Walther DB, Caddigan E, Fei-Fei L, Beck DM. Natural scene categories revealed in distributed patterns of activity in the human brain. J Neurosci. 2009;29:10573–10581. doi: 10.1523/JNEUROSCI.0559-09.2009. [DOI] [PMC free article] [PubMed] [Google Scholar]
- Williams MA, Dang S, Kanwisher NG. Only some spatial patterns of fMRI response are read out in task performance. Nat Neurosci. 2007;10:685–686. doi: 10.1038/nn1900. [DOI] [PMC free article] [PubMed] [Google Scholar]
- Williams MA, Baker CI, Op de Beeck HP, Shim WM, Dang S, Triantafyllou C, Kanwisher N. Feedback of visual object information to foveal retinotopic cortex. Nat Neurosci. 2008;11:1439–1445. doi: 10.1038/nn.2218. [DOI] [PMC free article] [PubMed] [Google Scholar]