Introduction
Osteoarthritis (OA) has become the most prevalent chronic disease of the elderly (1, 2) and is an important cause of disability in our society with increasing incidence not only in the US (3) but in other parts of the world (4–6). It is primarily a disease of the articular cartilage (7–9), which may become pathologic by degeneration or acute injury (10). As the incidence of the disease is on a continual increase, there is a great need for accurate non-invasive evaluation before the onset of irreversible changes (11, 12). There are many diagnostic imaging methods for evaluation of the articular cartilage. (Table 1) Conventional radiography has been used to detect secondary gross changes of the joint cartilage pathology, manifested by the narrowing of the joint space distance (13), and allows visualization of secondary changes such as osteophyte formation (10), but this imaging method only allows detection of later stage of the disease when changes are already irreversible. It does not allow direct visualization of the cartilage. Conventional or CT arthrography has also been used to evaluate surface irregularities of the cartilage; however, it is limited in its invasiveness and provides limited evaluation (14).
Table 1.
Pros and Cons of Various MR Imaging Methods for Evaluating Cartilage Physiology
| Pros | Cons | |
|---|---|---|
| Sodium imaging | High specificity for PG content. High contrast image without exogenous contrast agent | Requires special coils, high field scanners, and long imaging times. |
| T1 rho imaging | Sensitive to early PG depletion | Requires high RF power- SAR limits |
| dGEMRIC | High resolution and sensitivity | Delay prior to imaging. Need for contrast agent. Possibility of nephrogenic systemic fibrosis in patients with kidney problems |
| T2 mapping | Sensitive to collagen matrix, water content, and motion | May be less sensitive in detection of early degeneration |
| Ultrashort echo time imaging | Only technique to examine osteochondral junction | Technical challenges. Disadvantage of scan time. Difficulty in slice selection |
| Magnetization transfer | Improved contrast between cartilage and fluid -detection of localized cartilage lesions | Difficult quantification. SAR limits |
| Diffusion weighted imaging | Postoperative evaluation | Low SNR and spatial resolution |
MRI has become the best imaging modality for assessment of the articular cartilage (15–19) due to its excellent ability to manipulate contrast to highlight different tissue types (10). Conventional MRI sequences that are currently used for evaluation of cartilage have the ability to depict mostly morphological changes, such as fibrillation and partial-or full thickness defects (10); however, they are limited in their capability for comprehensive assessment of cartilage, with limited spatial resolution (20) and limited information about cartilage physiology.
Commonly used conventional MRI methods include 2D or multi-slice T1-weighted, proton density (PD)-weighted, and T2-weighted imaging with or without fat suppression (10). Then with new developments in imaging hardware and software and improved gradients and radiofrequency coils, fast or turbo spin-echo imaging techniques such as water-only excitation have been used (10). Even though SPGR and GRE techniques have produced excellent quality images with high resolution (0.3×0.6×1.5mm) (21) and 3D-SPGR is considered the current standard for morphologic imaging of cartilage (22, 23), these methods have the disadvantages of lack of reliable contrast between cartilage and fluid and long imaging times (10).
Therefore, newer techniques have emerged for morphologic imaging of cartilage, some of which include dual-echo steady-state (DESS) imaging, driven equilibrium Fourier transform (DEFT) imaging, balanced steady-state free precession (SSFP) imaging with fat suppression and its variants, such as fluctuating equilibrium MRI (FEMR), linear combination (LC) SSFP, IDEAL SSFP, phase sensitive SSFP, and vastly interpolated projection reconstruction (VIPR) imaging (10). These newer methods based on SSFP, as well as advances in parallel technology with improved imaging times in 3D FSE imaging, have improved morphologic imaging of cartilage, in terms of contrast, resolution, and acquisition time. However, these techniques are still limited in their ability to depict physiology and biochemistry of cartilage, although allowing time for application of other sequences to explore cartilage physiology (10).
In order to understand the principles of MR imaging of cartilage physiology, we will have to review some of the basic concepts of cartilage anatomy and physiology, which will be reviewed in the following section.
Functional Anatomy and Physiology of Cartilage
Articular cartilage is relatively hypocellular and composed of about 4% chondrocytes by wet weight (24). The main component of the tissue is composed of the extracellular matrix, which is 65% to 85% water, which decreases slightly with depth from the articular surface (24), and solid components, which include type II collagen (15–20%) and large aggregating molecules of proteoglycans (3–10%), which are called aggrecans (25). Most of the extracellular water is associated with the aggrecan molecules and freely exchangeable with synovial fluid (24), whereas a small portion of water is bound in the interfibrillar space of the collagen fibrils (26, 27) (Figure 1A).
Figure 1.
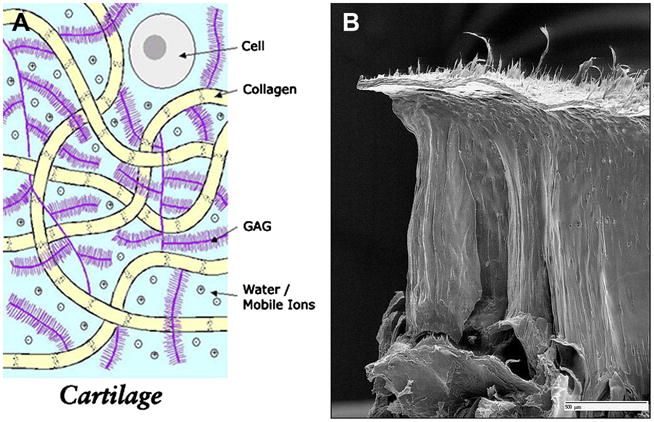
Figure 1A. Cartilage is mostly acellular and avascular, and has a limited ability to heal. The extracellular matrix consists of water, collagen, and glycosaminoglycan. Several aggrecan molecules are attached to a central core fiber filament of hyaluronic acid, to which the aggrecan monomers are bound through a linking protein. A large number of carboxyl and sulfate residues on the GAG side chains are ionized under physiologic conditions and impart a negative charge density (Courtesy of Deb Burstein, BIDMC).
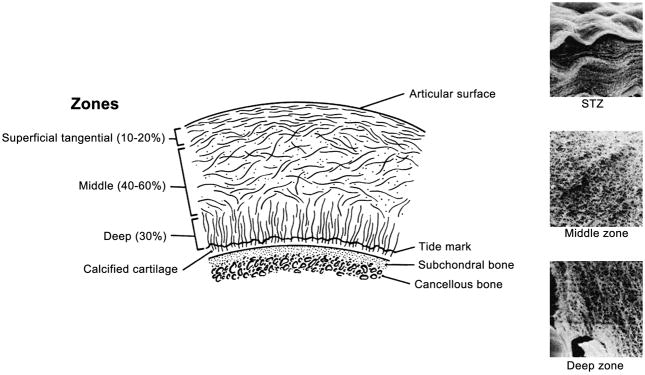
1B. The collagen fibers have a unique zonal architecture as shown here on this freeze fracture image, with superficial, tangential, radial, and calcified zones (courtesy of Doug Goodwin MD).
The biochemical properties of cartilage are strongly influenced by the content and structure of collagen and proteoglycans in the matrix, which differ from bone interface to the articular surface (25, 28). The orientation and alignment of collagen matrix vary according to the depth from the articular surface as well as regionally within the joint (24). At the most superficial aspect of the articular surface, there is a layer of dense collagen fibers, called the lamina splendens, which has a smooth surface and with proteoglycans such as lubricin (29), surface zone protein, and constituents of synovial fluid help of reduce the friction of the articular surface. Underneath the lamina splendens, tropocollagen molecules, which are components of type II collagen, are organized into a leaflet like structure (30). Then follows the superficial layer, where collagen fibrils tend to have an orientation parallel to the articular surface. The transitional zone is the next layer in depth, which thickens near the periphery of the articular surface (31). In recent studies, the transitional zone has been shown to have anisotropy (32, 33) with a preferential orientation oblique to the articular surface (24). Deeper to the transition zone is the radial zone, where collagen fibrils have a radial or perpendicular orientation to the bone surface and chondrocytes are aligned in a column-like pattern (34). And finally collagen fibrils cross the bone/cartilage interface at the tidemark zone, anchoring the cartilage to the subchondral bone (24) (Figure 1B). The characteristic arrangement of collagen leads to the “magic angle effect” and laminar appearance on proton MR images (35).
There are also regional differences in organization and composition of the collagen within the joint; weight-bearing regions that are frequently exposed to compressive load, such as the femorotibial joint, have a thicker radial zone and a thinner transitional zone (36) and are organized into thicker fibrils at regular intervals (37). This pattern is not seen in areas that are not prone to habitual loading. The transitional zone is thicker near the periphery of the joint, where the cartilage is prone to shear stress, and the direction of the collagen fibers are in the prevailing direction of shear strain (38).
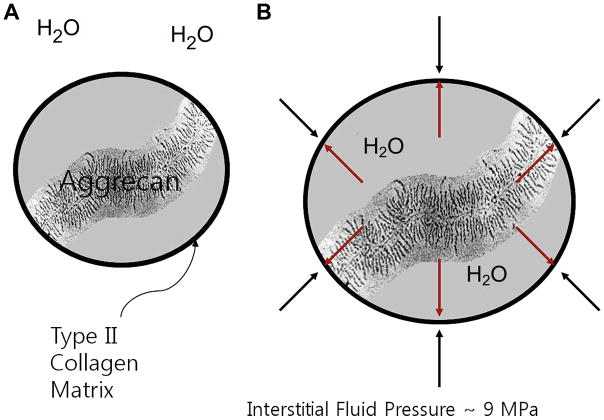
The aggrecans, which are large molecules of aggregating proteoglycans, lie interposed amidst the meshwork of type II collagen fibrils and their concentration varies within the cartilage layer, with the highest levels in the middle section, which decrease near the bone interface and articular surface (39, 40). Aggrecan consists of a protein core with a long extended domain to which many glycosaminoglycan (GAG) side chains are linked; these include chondroitin sulfate (CS) and keratan sulfate (KS) with CS as the predominant GAG molecule in cartilage (35). In turn, several aggrecan molecules are attached to a central core fiber filament of hyaluronic acid (41), to which the aggrecan monomers are bound through a linking protein. A large number of carboxyl and sulfate residues on the GAG side chains are ionized under physiologic conditions and impart a negative charge density (35) (Figure 1C). GAG chains are so densely packed that the concentration of negative charge can be as much as 150mM to 300mM in normal articular cartilage (42). These negative charges allow the GAG molecules to be fixed to the matrix and are referred to as fixed charge, and the concentration of this fixed charge is referred to as fixed charge density (FCD) (42). These negative ions attract positive counter-ions and water molecules and provide a strong electrostatic repulsive force between the proteoglycans, which act together to produce the swelling pressure of cartilage (35). However, swelling of the proteoglycans is constrained by the surrounding collagen meshwork, which produces an interstitial fluid pressure of about 9MPa (43), and this contributes to the compressive stiffness of cartilage which is essential for normal cartilage function (24) (Figures 2A, B). Collagen II fibers, which are the predominant type of collagen in cartilage, provide a tensile force opposing the tendency of the proteoglycans to expand the cartilage and also immobilize the proteoglycans (35). The cartilage interface with the subchondral bone is important to normal cartilage function as well; this area is represented as the subchondral plate, which consists of the tidemark zone, the zone of calcified cartilage, lamellar subchondral cortical bone, and the underlying trabecular bone (24). Type II collagen fibrils pass through the tidemark zone, ending in the zone of calcified cartilage (44), and there is a potential cleavage plane between the zone of calcified cartilage and subchondral cortical bone in response to shear stress (45) (Figure 3). The subchondral plate can remodel in response to altered biomechanics secondary to joint injury or damage to overlying cartilage, and its thickness varies according to joint geometry and other patient factors, such as age, weight, and exercise (46).
Figure 2.
Figure 2A, B. Negative ions attract positive counter-ions and water molecules and provide a strong electrostatic repulsive force between the proteoglycans, which act together to the swelling pressure of cartilage; this swelling of the proteoglycans is constrained by the surrounding collagen meshwork, which produces an interstitial fluid pressure of about 9MPa (courtesy of Timothy Mosher, MD)..
Figure 3.
Type II collagen fibrils pass through the tidemark zone, ending in the zone of calcified cartilage and there is a potential cleavage plane between the zone of calcified cartilage and subchondral cortical bone in response to shear stress (from Basic Orthopedic Biomechanics VC Mow, WC Hayes (1997), Lippincott Williams & Wilkins Publishers; 2nd edition, p. 171)
Stress is defined as the intensity of force imparted onto the articular surface per unit area, and the deformation of the tissue in response to such stress is called tissue strain (24). The tissue strain that develops within tissue in response to applied stress will vary over time, and such tissues possess viscoelastic properties (24), which are results of interaction between the three main components of cartilage, namely, water, type II collagen matrix, and aggrecan (47). The types of stress imposed on cartilage can be categorized as compression, tension, and shear (24).
Compression causes cartilage to deform and produces a bulk flow of water through the extracellular matrix into the synovial space (48). The ability of cartilage to resist compression is a result of the ability of the extracellular matrix to limit water permeability (49), which is optimal in healthy cartilage where the water flow is able to dissipate most of the energy imparted onto the tissue during compression (Figure 4). This is not the case in degenerative cartilage, where water movement becomes less restricted and more of the compression force is imparted to collagen and aggrecan matrix, which leads to degeneration (24). Cartilage is stiffer toward bone (50) and most of the tissue deformation occurs in the superficial layer of cartilage (24). Tension causes deformity of the contour of cartilage, which is resisted by the fibrillar type II collagen meshwork and hydrated aggrecans (51).
Figure 4.
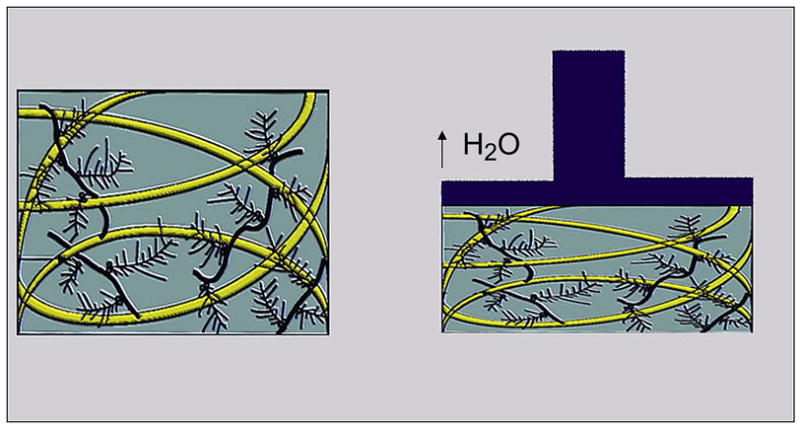
Forces from compressive loading are dissipated by frictional drag forces as water moves through the extra-cellular matrix (modified by Mosher TJ, from Basic Orthopedic Biomechanics VC Mow, WC Hayes (1997) Lippincott Williams & Wilkins Publishers; 2nd edition, p. 171)
Shear stress is produced when one articular surface passes over the other and at the bone/cartilage interface, where differences in compressive stiffness of tissues result in shear strain during high compressive loading (24) (Figure 5). In healthy normal cartilage, the smooth surface of the lamina splendens, superficial zone protein, and lubricin, and synovial fluid act together to reduce shear strain (24). Extensive tensile strain may produce cleavage or fractures within the collagen matrix, leading to cartilage fissures along the collagen “leaves” or flap-type tears at the junction of the transitional and radial cartilage zones (24). High compressive forces transmitted to the deep layer of cartilage produce high shear strain in the tidemark zone at the cartilage/bone interface. When this shear strain exceeds the material properties of the tissue, cleavage between calcified cartilage and subchondral bone may occur, leading to cartilage delamination (24).
Figure 5.
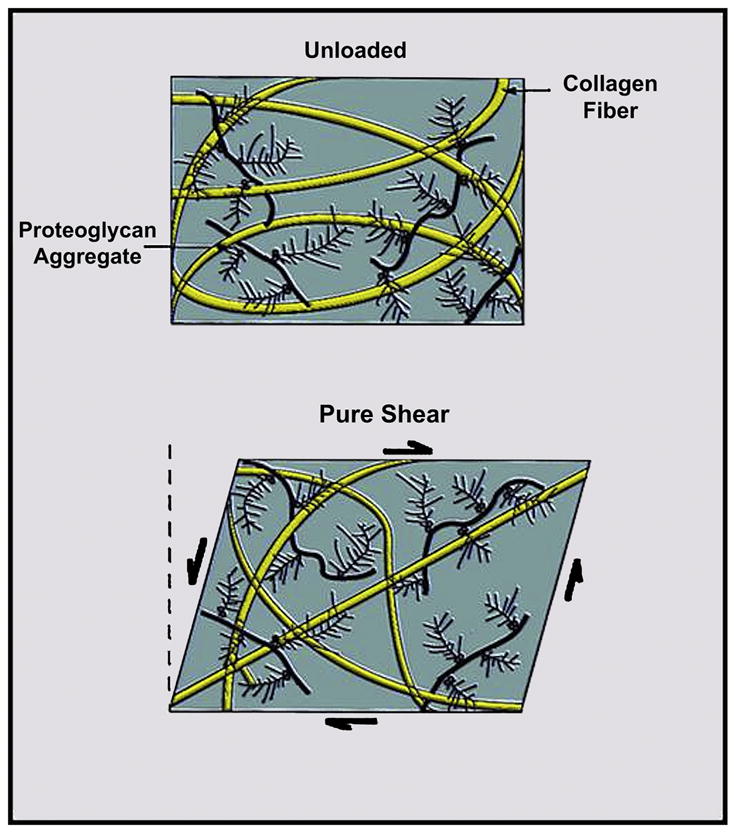
Shear stress is produced when one articular surface passes over the other and at the bone/cartilage interface, where differences in compressive stiffness of tissues result in shear strain during high compressive loading (modified by Mosher TJ, from Basic Orthopedic Biomechanics VC Mow, WC Hayes (1997) Lippincott Williams & Wilkins Publishers; 2nd edition, p. 171)
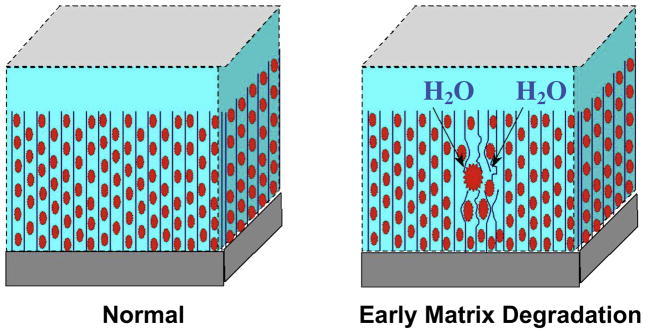
Osteoarthritis is characterized by following changes in the cartilage biochemistry and microstructure: earliest changes include reduced PG concentration, possible changes in the size of collagen fibril and aggregation of PG, increased water content and increased synthesis and degradation of matrix macromolecules (35) with disorganization of the collagen network (52) (Figure 6). These lead to breakdown and decreased content of the PG matrix, which in turn lead to ulceration with inflow of PG into the synovial fluid with decreased water content of the cartilage, making it less resistive to stress. As osteoarthritis progresses, collagen, PG, and water content are reduced further and the collagen network becomes severely disrupted (53).
Figure 6.
Maroudas Model of Early Cartilage Damage shows earliest changes including reduced PG concentration, possible changes in the size of collagen fibril, and increased water content (courtesy of Timothy Mosher, MD).
MR Imaging of Cartilage Biochemistry and Physiology
Conventional MR imaging methods have demonstrated mostly morphologic changes of cartilage, which probably represent progressed stages of osteoarthritis. Such morphologic changes are preceded by biochemical and structural changes in the extracellular matrix that change the biomechanical properties of the tissue (10). Out of the conventional MRI methods, T2-weighted images are highly sensitive to structural properties of cartilage reflecting the T2 relaxation properties of type II collagen and water associated with it, exhibiting magnetization transfer and magic angle effects. Conventional methods have been based mostly on water content and less commonly on collagen content and orientation. Newer techniques have been developed to map various MRI parameters, assessing proteoglycan content, collagen content and orientation, water mobility, and regional cartilage compressibility. These include sodium MRI, T1 rho, dGEMRIC, T2 mapping, ultrashort TE imaging, magnetization transfer, and diffusion-weighted imaging. Most of these have been studied in vitro using excised specimens; however, some of the techniques have been conducted in human studies. MRI methods to measure proteoglycan depletion of cartilage, which is one of the earliest findings of OA, include sodium MRI, T1 rho mapping, and dGEMRIC (42). Other methods, such as T2 mapping, ultrashort echo time imaging, magnetization transfer, and diffusion-weighted imaging, are mainly based on other biochemical and physiological characteristics of cartilage, such as collagen content and orientation, water content and mobility, and regional cartilage compressibility (10).
Sodium MRI
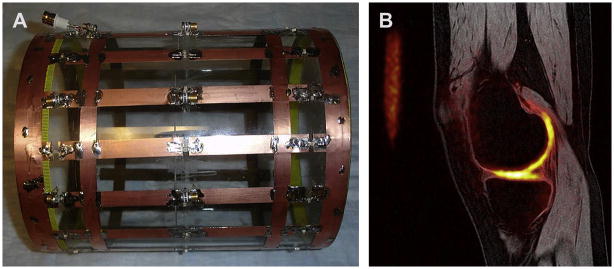
Any atom with an odd number of protons and/or neutrons possesses a nuclear spin momentum and exhibit the MR phenomenon. Whereas conventional MRI methods have used H to generate signal, the atom 23Na which also has an odd number of protons or neutrons can be used in cartilage imaging. The Larmor frequency of 23Na is 11.262 MHz/T, compared with 1H at 42.575 MHz/T, which means that at 1.5T the resonant frequency of 23Na is 16.9MHz, as compared with 63MHz for 1H (54). In addition to the lower resonance frequency, the concentration of 23Na is 320microM, i.e. relatively lower than that of 1H, with T2 relaxation times between 2 and 10ms (55), often requiring imaging with a non-Cartesian trajectory (56). Due to all of these factors, in vivo imaging using 23Na is challenging and requires the use of special transmit and receive coils, which are not always available for clinical MRI systems, as well as relatively long imaging times in order to obtain adequate signal-to-noise (54) (Figure 7A, B).
Figure 7.
Figure 7A, B. Sodium MRI requires high field strength and dedicated hardware, such as a dual-tuned 23Na+/1H coil (A) allows direct measurement of GAG content (B) (Courtesy of Starosweicki, et al. JMRI 2010, 32(2):446–451).
Sodium-23 atoms are associated with the negatively charged GAG side chains and thus the main component of the high fixed-charge density present in the proteoglycan sulfate and carboxylate groups (54) in the extracellular matrix (25, 57) with spatial variation of concentration within the normal cartilage (55). Loss of PG (and hence GAG and FCD) due to cartilage degeneration results in loss of sodium ions from the tissue, which results in lower FCD, thereby releasing positively charged sodium ions (35). Sodium imaging has been shown to be sensitive to small changes in proteoglycan concentration in studies using in vitro cartilage specimen (58–63). Studies have been published on obtaining quantitative measurements of sodium concentration in cartilage (55, 64) and obtaining signal from sodium bound to macromolecules in the extracellular matrix (58, 35, 65–70). With the use of higher field 3.0T (Figure 8) or 7.0T (Figure 9) MRI, better spatial resolution has been achieved and in-vivo studies have been performed (71–75), which suggest Na imaging can be used for physiologic assessment of cartilage with potential application in postoperative patients as well (75). Triple quantum filtered imaging (76), use of 3D cones at high field MRI (74), 3D-radial acquisition with ultrashort echo times (73) and inversion recovery techniques (77) have been shown to be feasible with promising results (Figure 10A, B), but clinical application of 23Na imaging is still limited in many aspects, including the SAR limits.
Figure 8.
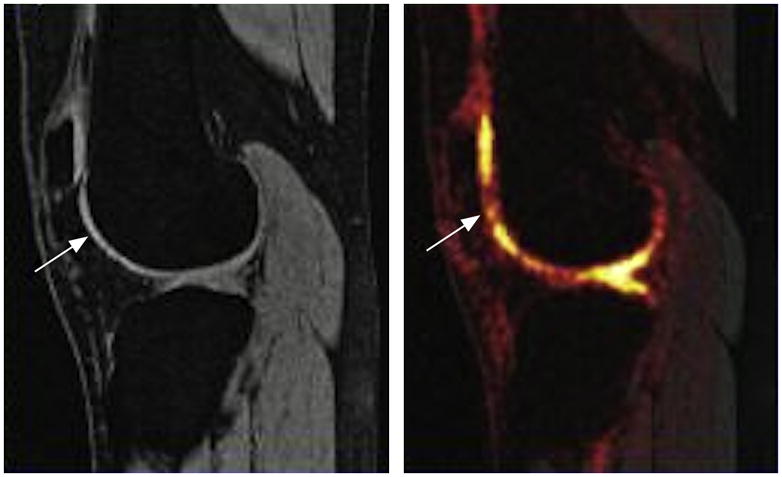
Sodium MRI is sensitive to cartilage glycosaminoglycan. Advances in coil design and high field have made this a potential clinical tool. Here a patient with a prior anterior cruciate ligament tear shows areas of focal cartilage glycosaminoglycan loss (left) despite a normal proton MRI (right).
Figure 9.
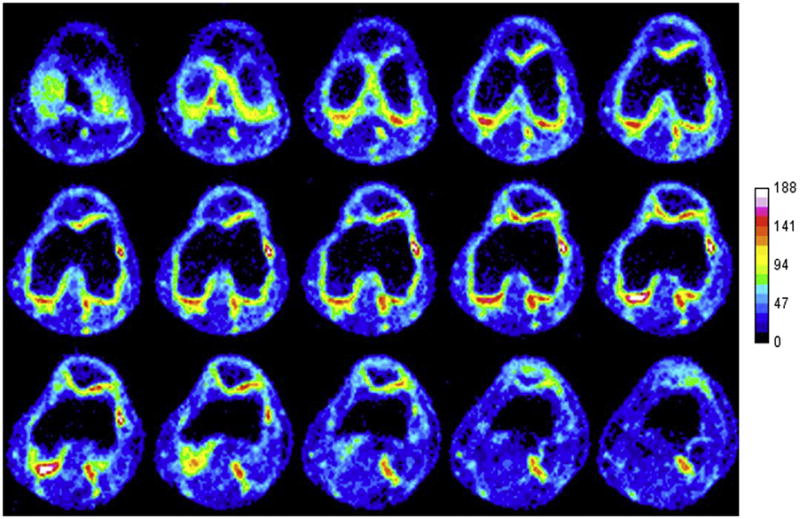
Sodium MRI at 7T shows direct measurement of cartilage glycosaminoglycan in healthy volunteer knee (Courtesy of Ravinder Reddy, U. Penn).
Figure 10.
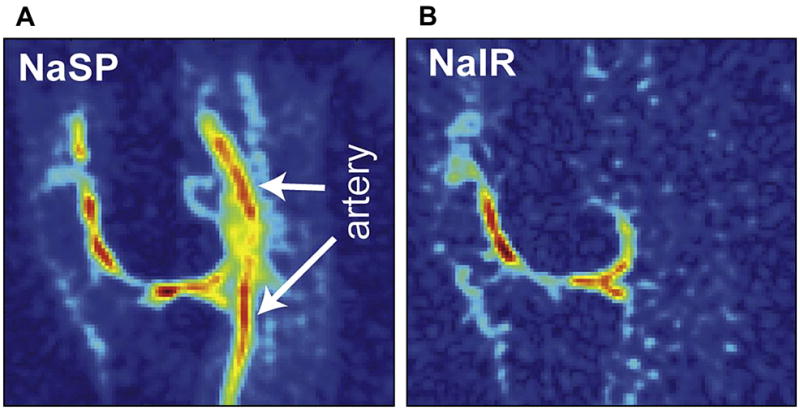
Figure 10A, B. Use of 7T MRI improves sodium MRI resolution and SNR. Here an inversion recovery technique (B) is used to suppress signal from the popliteal artery (A) (Reproduced with permission from Madelin G, et al. J Magn Reson 207: 42–52 (2010)).
However, because of its high specificity for PG content and ability to depict cartilage with high contrast without the requirement for exogenous contrast agents, such as in dGEMRIC (78), and with developments in high field MRI, advances in gradient technology and radiofrequency coil technology, and parallel imaging techniques (79, 80), sodium MRI has become more feasible (71–75) and may be used in the future to quantify early physiological and molecular changes associated with osteoarthritis.
T1 rho imaging
T1 rho imaging is made possible when the magnetization is tipped into the transverse plane and then “spin-locked” by a constant radiofrequency (RF) field. Proteoglycan depletion, which is one of the earliest changes in osteoarthritis, affects the physio-chemical interactions within the macromolecular environment, and quantitative T1 rho imaging methods enable probing macromolecular slow motions at high static fields in cartilage (52). Several studies have suggested that with further GAG depletion, T1 rho reflects interaction of collagen with water (81–83).
T1 rho imaging of cartilage with application to study cartilage degeneration was first suggested by Reddy et al (84). Earlier studies using phantom and specimens showed a strong correlation between T1 rho and cartilage PG content (85–90). In a study by Akella et al., a strong correlation was shown between changes in PG and T1 rho, and similar to T2 studies, T1 rho values also showed regional variations within cartilage (89), with the highest values in the superficial zone, decreased in the middle zone, and increased near the subchondral bone (89) (Figure 11). Using sodium MRI, a strong correlation was found between T1 rho and FCD (90). A study of cartilage specimens from patients undergoing total knee arthroplasty suggested T1 rho to be more sensitive to cartilage degeneration as compared with T2 mapping (92) (Figure 12).
Figure 11.
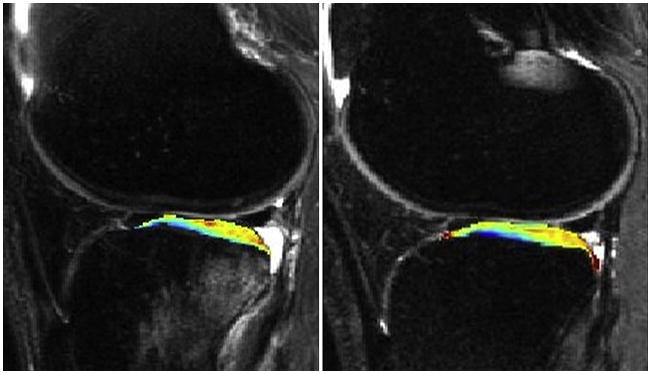
T1p: One year follow up after ACL tear. Baseline measurements (left) and measurements at one year post ACL-reconstruction (right) show persistent cartilage damage despite resolution of bone marrow edema-like lesions (Li et al, ISMRM 2007).
Figure 12.
Measurements of T1 rho (upper left, middle), DGEMRIC (upper right, lower left), and T2(lower middle, right) before (upper left, right, lower middle) and 4 months after surgery (upper middle, lower left, right) show T1 rho and DGEMRIC to be more sensitive than T2 (Courtesy of Dan Thedens, University of Iowa).
Although there have been only few in vivo studies, some studies have shown increased cartilage T1 rho values in OA subjects compared with controls (93, 94), which further suggested the potential application of T1 rho imaging for evaluating cartilage. Studies on T1 rho and T2 have suggested that the values may be complementary and T1 rho may not only reflect PG content, but other biochemical changes that occur in cartilage degeneration (81, 83, 95) and may have a dependence on the angular orientation of collagen fibers (52). Several studies have suggested that the average T1 rho, which has a larger dynamic range, may be a more sensitive indicator of cartilage degeneration than T2 (91, 96).
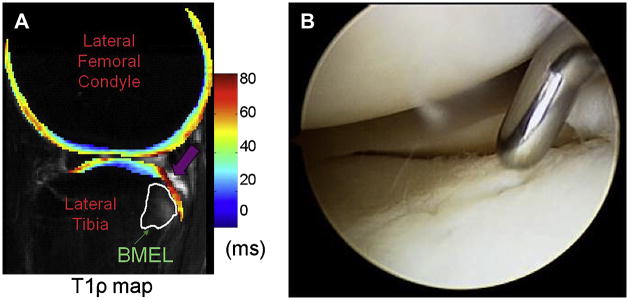
T1 rho imaging method is a potentially useful technique sensitive to early proteoglycan depletion, one of the earliest changes in osteoarthritis (91, 97, 98) (Figures 13A, B). Initial application of T1 rho in humans was limited to single-slice acquisition (99); however, recent advances in T1 rho imaging techniques have included multi-slice and 3D acquisitions (97, 98, 100, 101), as well as rapid Cartesian acquisition strategies at 3T (102, 103). However, one disadvantage of the T1 rho technique is the relatively large RF power that is applied during the spin-locking preparation pulse, which may result in heating of tissue and problems with SAR; this should be overcome with development of new techniques and is not a significant problem at clinical MRI up to 3.0T (10). Also, implementations of parallel imaging techniques have enabled reduction of imaging times to the range of 5 to 10 minutes (102, 104). Further studies are needed on T1 rho imaging to confirm its reliability in larger patient populations; however, it is a promising technique for investigation of cartilage degeneration and osteoarthritis.
Figure 13.
Figure 13A, B. Elevated T1ρ (A) is seen adjacent to bone marrow edema-like lesions in ACL-injured knee (B) (Reproduced with permission from Theologis AA et al. Arthroscopy 2010 Oct 28 [epub ahead of print], Lozano JJ et al. Bone Joint Surg Am 88(6):1349-52 (2006)).
Contrast Enhanced Imaging - Delayed Gadolinium-Enhanced MRI (dGEMRIC)
As described earlier, the proteoglycan components of cartilage has GAG side chains with abundant negatively charged carboxyl and sulfate groups. The negative fixed charge on the cartilage macromolecules is balanced by the net charge of the mobile ions within the extracellular fluid (ECF). The ECF has a lower concentration of anions and a higher concentration of cations than blood or synovial fluid, and the difference between the concentrations of anions and cations in ECF equal the fixed charged density (FCD) (42). GAG or FCD contribute significantly to load-bearing properties or compressive stiffness of cartilage (105–107), so there is a substantial difference in the concentration of mobile ions between normal and GAG depleted cartilage (42). There were many studies attempting to measure GAG, including some of the first quantitative measurements of GAG distribution in relation to the depth from articular surface or topological position or with disease by Maroudas et al (108–111).
MRI enables noninvasive measurement of ion concentrations and simultaneously enables acquisition of spatial images (42). One of the most common MR contrast agents, Magnevist (Berlex, NJ) or Gd(DTPA)2− is a clinically approved MRI contrast agent can be used to indirectly measure FCD by allowing Gd(DPTA)2− to penetrate into cartilage accumulating in high concentration in areas of cartilage with low GAG content (112). Subsequent T1 mapping yields an image depicting GAG distribution, which is referred to as “delayed gadolinium enhanced MRI of cartilage” or “dGEMRIC” with the “delay” meaning the time required for Gd(DTPA)2− to penetrate into cartilage (112). As compared with sodium MRI, which entails a more direct measurement of FCD, dGEMRIC technique using a contrast agent is an indirect method of measuring GAG content in articular cartilage (113, 114). As compared with sodium MRI, the advantages of dGEMRIC is a relatively higher resolution and sensitivity; however, the disadvantages include the need for administration of a contrast agent and the need to convert T1 measurements into Gd(DTPA)2− concentration (42). Areas of low GAG will accumulate a higher concentration of the Gd(DTPA) with more rapid T1 relaxation of adjacent water protons (10). After obtaining a series of images with different degrees of T1 weighting, a T1 map can be calculated to provide a regional assessment of relative Gd(DPTA) concentration that is inversely proportional to the regional GAG content (115). DGEMRIC index refers to the acquisition of a single T1 map after administration of Gd(DTPA) and has been shown to be similar at both 1.5T and 3.0T field strengths (115).
The dGEMRIC technique has been validated in both in vitro and in vivo studies as reflecting the GAG concentration of cartilage with dGEMRIC measurements corresponding to “gold standard” measures for GAG (115–117). Long-term In vitro studies have been conducted which enabled monitoring changes of GAG distribution over time with high resolution, allowing insight into the process of cartilage degradation, development, and repair (42). For example, in a study by Allen et al. bovine cartilage plugs were monitored over time and showed chondrocytes could replenish GAG after trypsin depletion of GAG (118) and after interleukin-1 (IL-1) treatment (119). GAG measurements have been observed to correlate better in superficial layers of cartilage as compared with deep layers where MRI can overestimate GAG (120). Interobserver and intraobserver variability in the selection and calculation of regional T1 have not been shown to be significant sources of variation for this technique (121).
In vivo studies have provided invaluable clinical insights into cartilage physiology and pathology. Clinical studies have demonstrated the DGEMRIC images show “lesions” in cartilage not observed with administration of a nonionic contrast agent (122), validating the correlation between dGEMRIC and distribution of GAG molecules. Several pilot clinical studies were done using DGEMRIC to evaluate the level of repair in cartilage implants (123–125). Increased uptake of Gd(DTPA) has been observed in arthroscopically correlated regions of cartilage fibrillation and softening (126) and patellar chondrosis (127) and has been associated with joint space narrowing and malalignment within the femorotibial joint of the knee (128). In a recent study, individuals exercising on regular basis were shown to have higher DGEMRIC indices, i.e. higher GAG concentrations, than sedentary subjects, correlating with the level of physical activity (129). In another study, a change in DGEMRIC index was shown 4 months after a meniscal tear, corresponding to the amount of exercise (130). This study provided an insight into the hypothesis that mechanical stimulation could change cartilage biochemistry (42) (Figures 14A, B, C).
Figure 14.
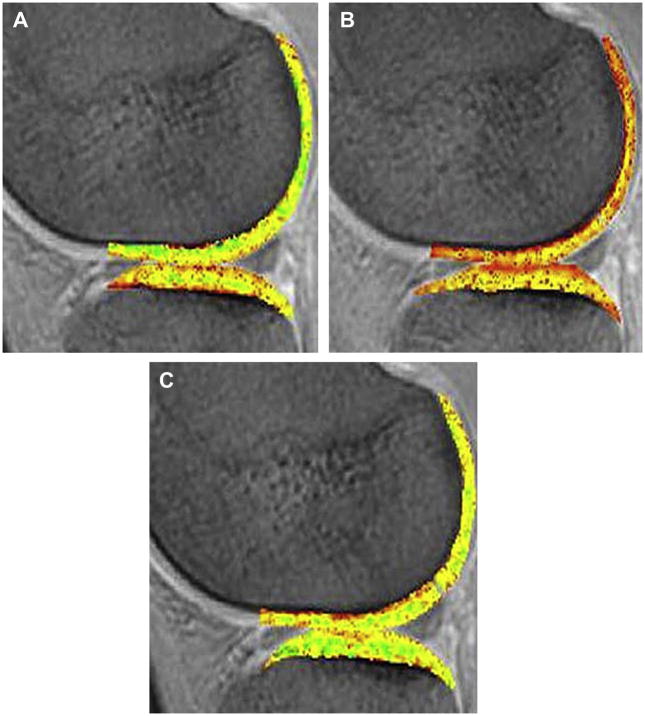
Figure 14A, B, C. Temporal changes in the dGEMRIC Index have been shown with physiologic events such as seen in the images of an individual (A) before running a marathon, (B) 1 day postmarathon, and (C) 1 week postmarathon (Burstein et al, Radiol Clin N Am 47 (2009) 675–686).
The medial femorotibial compartment has been shown to have generally lower DGEMRIC index as compared with the lateral femorotibial compartment of the knee (131), keeping consistent with previous biochemical studies, as well as possibly reflecting a response to different mechanical stress according to the location within the joint. Large variations in DGEMRIC were observed even when no joint space narrowing was observed on radiographs (132), presumably representing biochemical changes preceding morphological changes and actual loss of cartilage (42). The DGEMRIC index also appears to be sensitive to cartilage-modifying injuries, as shown in studies of patients with ACL (133) or PCL injuries (134) who showed lower DGEMRIC values. In another study, cartilage lesions in patients with OA were more apparent using the DGEMRIC technique as compared with the standard MRI scans (135). In a large cross-sectional study of hip dysplasia patients, measures of severity of dysplasia and of pain correlated well with the DGEMRIC index but poorly with the radiological parameter of joint space narrowing (136). DGEMRIC studies exploring the implication for planning and monitoring treatment have shown the DGEMRIC index as the best predictor of failure (137) in osteotomy for hip dysplasia and increased DGEMRIC index in patients postoperatively, suggesting reversibility of cartilage injury (137) (Figure 15).
Figure 15.
Cartilage can potentially heal and result in increase in dGEMRIC Index with intervention of osteotomy for hip dysplasia as depicted in pre-operative (left), 20 month-postoperative (middle), and 58 month-postoperative (right) studies (Courtesy of Deborah Burstein, BIDMC and Harvard University).
DGEMRIC may provide a noninvasive way to depict the mechanical properties of cartilage by mapping the biochemical composition (42), as shown in studies with good correlation between decreased GAG content, measured as increased DGEMRIC, and increased cartilage compressibility and site-matched stiffness measurements (120, 138–141). These studies showed results that could not be explained by GAG measurements alone, suggesting the need for combined GAG/collagen studies (138–141). A preliminary study on osteochondral allografts also showed similar results of low GAG associated with indentation stiffness (125). In a recent study, the in vivo effects of unloading and compression on T1-Gd relaxation times were investigated in healthy knee cartilage at 3.0T, which again showed a relationship between biochemical load response and biomechanical properties of articular cartilage (142) (Figure 16A, B, C). Recent studies have suggested clinical application of DGEMRIC in the assessment of cartilage after repair (124, 143–145) (Figure 17). However, most of the results have shown heterogeneous uptake in repair tissue over time, and so one has to account for the fact that the baseline T1 of the tissue and Gd(DTPA) uptake are influenced not only by GAG content but also by water content and permeability of tissue; therefore, pre- and post contrast measurements of T1 are needed for accurate evaluation of the GAG content (146, 147). In a recent study of autologous chondrocyte implantation with a fibrin-based scaffold in the knee showed DGEMRIC and T2 mapping to provide complementary information on the biochemical properties of repair tissue (148).
Figure 16.
Physiologic effects of mechanical loading. Sagittal dGEMRIC images of the knee joint, obtained at baseline (A), unloading (B) and compression (C) at identical window levels. While there is no significant difference, with regard to T1-Gd relaxation times, between baseline and unloading, there is a significant T1-Gd decrease between baseline and compression, and between unloading and compression (Mayerhoefer et al, Eur Radiol. 2010 Feb;20(2):443-9).
Figure 17.
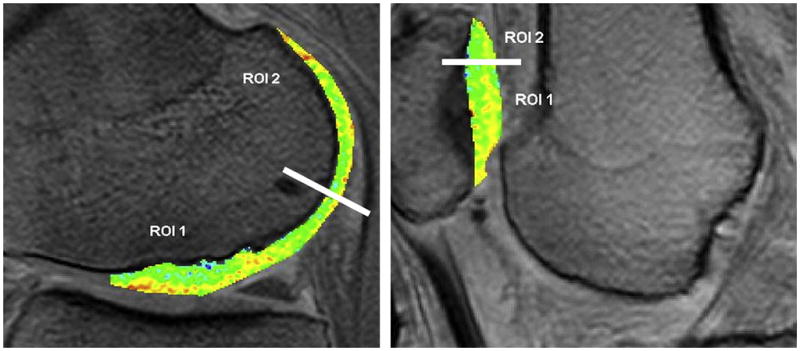
dGEMRIC measurements in the knee after cartilage implants show Dgemric comparable to surrounding native cartilage 12 years post-implant (ROI1 = implant, ROI2=native) (from Program # 815 ISMRM 2010, publication: Vasiliadis et al, Am J Sports Med. 2010 Feb 25).
Technical issues regarding optimization of the DGEMRIC technique for human clinical application have been investigated and reviewed (78, 149–151). Even though the contrast agent Gd(DTPA) has been approved for clinical use as an MRI contrast agent, the DGEMRIC technique itself is an off-label application. The recommended dose for DGEMRIC studies is 0.2mM/kg or twice the recommended clinical dose but this should be corrected for body mass index (152). Some authors have advocated using a triple dose to improve sensitivity to small changes in GAG (131). According to the DGEMRIC protocol as suggested by Burstein et al., the contrast agent is injected intravenously, the subject exercises the joint for about 10 minutes, and imaging is performed after about 2–3 hours for the knee and 30–90 minutes for the hip (78); reproducibility of this technique was 10–15% for images taken two weeks to two months apart (78).
Safety precautions must be taken when administering gadolinium-based contrast agents, as recently there have been reports linking gadolinium-based contrast media to nephrogenic systemic fibrosis, a highly debilitating condition similar to scleroderma which occurs in patients with moderate to severe renal impairment (153–158). Even though the exact pathogenetic mechanism is still under investigation, it has been hypothesized that renal impairment leads to prolonged circulation of the contrast agent, leading to accumulation of free Gd3+ in tissue (154). As there is no cure for this potentially fatal condition, appropriate precautions and screening procedures should be undertaken when administering gadolinium-based contrast agents in all subjects (10).
Other limitations to the DGEMRIC technique include the delay period between injection and imaging and the long imaging time needed to acquire the series to T1-weighted images to calculate the T1 maps, necessitating correction for patient motion between acquisitions (10). More recently, rapid 3D T1 mapping techniques have been developed to reduce acquisition time and improve spatial coverage (146, 149–151, 152, 159, 160). These techniques still need to be validated further. As in all quantitative imaging techniques, there are assumptions and possible error underlying the technique; in DGEMRIC these include the issue of the conditions under which Gd(DTPA)2− fully penetrates cartilage, assumptions inherent in the conversion of T1 to Gd(DPTA)2− concentration, tissue cellularity in young or tissue engineered samples (since Gd(DPTA)2− does not enter cells and cellular volume needs to be corrected for) and better T1 sequences which can cover the joint in a reasonable time frame (112). In spite of these issues and limitations, the biophysical basis of this technique supported by validation studies in vitro and in vivo suggest that the DGEMRIC technique is a valuable tool in investigating cartilage status, disease, and repair and may shed more light into understanding joint biomechanics in cartilage physiology as well as the role of loading and exercise in cartilage pathology.
T2 relaxation time mapping
One of the earliest physiologic changes in cartilage degeneration is increased permeability of the matrix, which leads to increased content and motion of water. This results in increased stress on cartilage as the hydrodynamic pressure is not sustained by the matrix which leads to proteoglycan-collagen matrix degeneration and subsequently, morphological changes in cartilage. The transverse relaxation time (T2) is constant for a given tissue at a given MR field strength (161), unless altered by tissue pathology or a contrast agent (161); it is sensitive to slow moving protons and is a function of the water content (162, 1, 163–165), collagen content (82, 83, 166–169), and orientation of the highly ordered anisotropic arrangement of collagen fibrils in the extracellular matrix (170, 171, 172–182, 161) (Figure 18). The immobilized water protons in the proteoglycan-collagen matrix promote T2 decay and render the cartilage low in signal intensity (SI) on long-TE (T2-weighted) images, whereas the mobile water protons in synovial fluid maintain high SI (52). As collagen and proteoglycan losses occur, the water molecules are increased in motion and content, manifesting high SI on T2-weighted images (183, 162). High SI in areas of damaged cartilage have been well depicted on conventional T2-weighted images with arthroscopic correlation (184, 185). There is an orientation dependence of T2 in cartilage, which is a result of residual quadripolar relaxation mechanisms due to the aniosotropic arrangement of collagen fibrils (69, 82 186–191), and this is most pronounced in the radial zone where the fibers are aligned in a perpendicular direction to the bone and also varies within the joint (173, 174, 181, 36, 192) (Figures 19A, B, C, D). Several studies have shed light on the significance of the orientation of the collagen matrix in cartilage pathology (193–197); there have been studies suggesting a strong inverse relationship between cartilage T2 and collagen fiber anisotropy (169, 180, 32, 198, 199). Such sensitivity to structural changes in collagen matrix as well as changes in water content and motion renders T2 mapping to be a useful technique to depict early changes in osteoarthritis (200). Loss of collagen matrix anisotropy has been observed to occur early in the disease process of osteoarthritis and has been detected with T2 measurements (201) (Figures 20A, B, C, D). This disruption of collagen organization leads to increased permeability and water content of cartilage (43, 109), leading to increased compressibility of cartilage (49), which in turn, results in greater load-bearing stress on the solid components of the extracellular matrix (202), which finally results in morphological changes in the cartilage. In order to accurately measure the T2 relaxation time, technical concerns are to be taken into account when selecting the MR technique (203). Typically a multiecho spin-echo technique is used with varying echo times (TE) and identical repetition times (TR), and signal levels are fitted to one or more decaying exponentials, depending on whether more than one distribution of T2 is thought to be within the sample (203); T2 is defined as the time at which the signal decays to 37% of maximum signal (52). For conventional MRI, a single exponential fit is usually adequate (161), then an image of the T2 relaxation time is generated with either a color or gray-scale map. For accurate depiction of the depth dependent spatial variation in cartilage T2, high-resolution T2 maps are needed, such that the resolution should be ideally in the range of 2% of total cartilage thickness for each pixel (204), which is impossible with current technologies. However, there have been studies with attempts to decrease image acquisition time, using parallel imaging (102), rapid T2 mapping sequences (205), hybrid gradient-echo/spin-echo (206), and gradient echo T2* mapping techniques (207, 208). Measurements of relaxation times have been shown to be anisotropic with respect to the main magnetic field (172, 170, 188).
Figure 18.
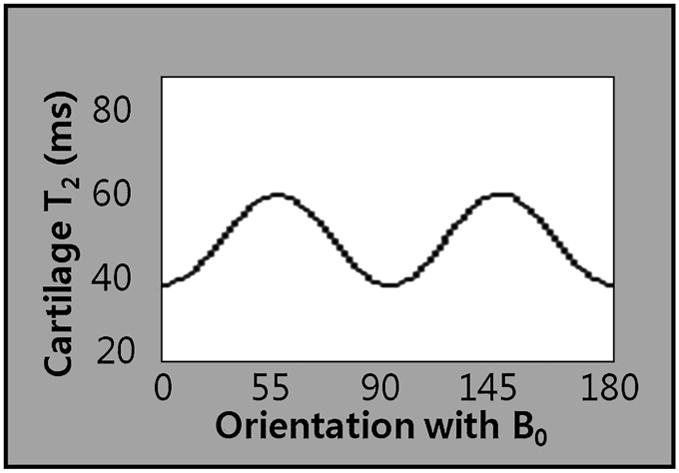
The magic angle effect in cartilage (Reproduced with permission from Xia Y, et al. Magn Reson Med 48:460–469 (2002)).
Figure 19.
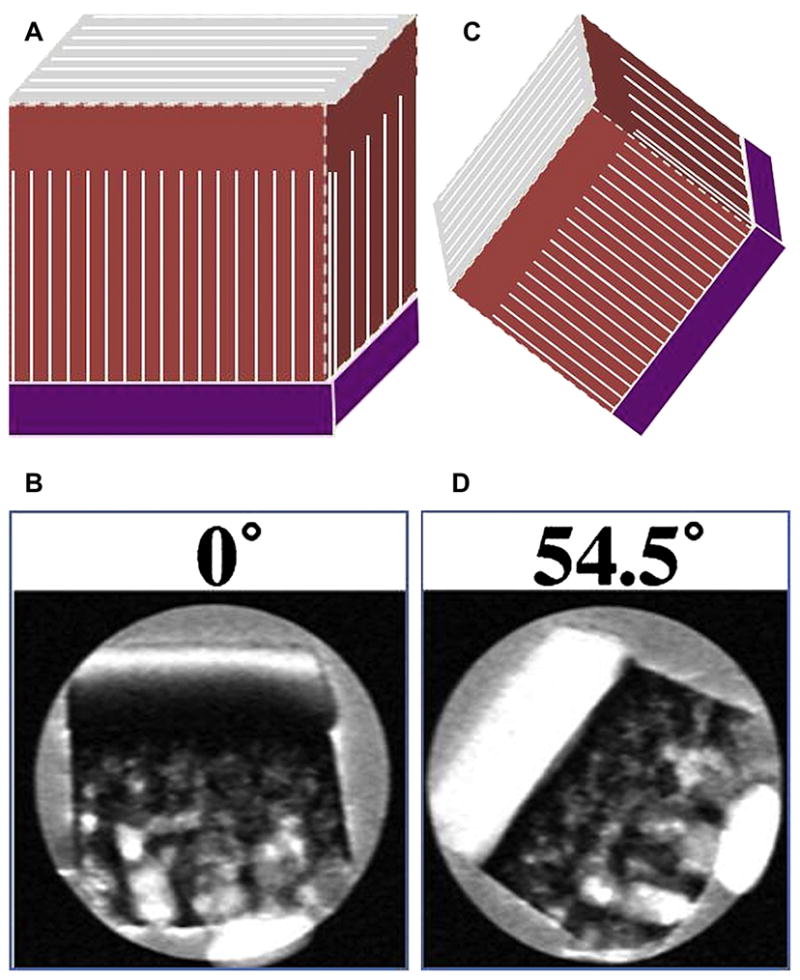
Figure 19A, B, C, D. Dependence of cartilage T2 on collagen fibril orientation is shown on T2-weighted images (A,B) and the magic angle effects (C, D) as B0 increases approaching 54.5′ (B, D: Reproduced with permission from Xia Y, et al. Magn Reson Med 48:460–469 (2002), A, C:Courtesy of Tim Mosher, M.D., Penn State).
Figure 20.
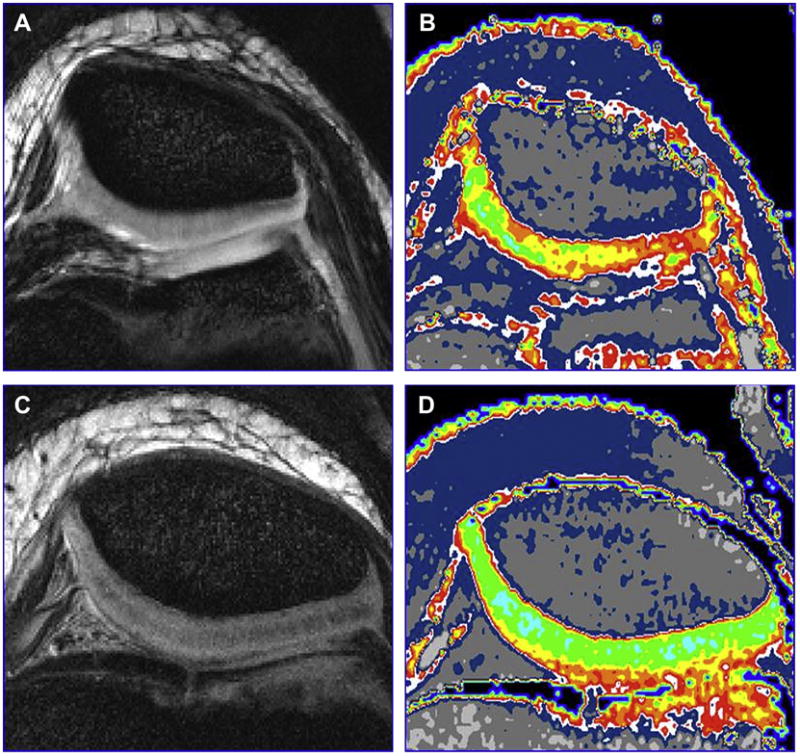
Figure 20A, B, C, D. Here is an example of the use of T2 mapping to show matrix changes. The morphologic images of 10-year old girl with Juvenile Rheumatoid Arthritis (A) and a healthy 10-year old boy (C) and are both normal. The T2 maps (B, D) show large areas of collagen matrix disruption in the patient with JRA (B) (Courtesy of Bernard Dardzinski, Merck).
In vitro studies have been conducted to investigate the relationship between T2 measurements and biochemical composition of cartilage with results demonstrating a strong correlation between T2 and histologic indicators of cartilage degeneration in tissue samples and animal models (81, 141, 169, 209–213). Such studies showed elevated T2 not only in areas of cartilage damage but also in adjacent areas, suggesting exposure of additional hydrophilic sites leading to a more efficient T2 relaxation and greater magnetization transfer effects (10). Aside from these validation studies mostly conducted in vitro, in vivo studies have been conducted in the human knee joint (203, 205, 214–217) (Figure 21A, B), hip (219, 220), ankle (221), and the proximal interphalangeal joint of the hands (222). High resolution in vivo studies have shown a spatial variation within cartilage with shorter T2 values as the layers get close to the subchondral bone, and higher T2 values as the layers gets more superficial closer to the articular surface (182, 215, 223, 224). Regional variation within the femorotibial joint have also been shown (225), as well as greater entropy of T2 in osteoarthritic cartilage (226). According to results from various studies, regional variation of T2 seems to be affected by age (215, 227, 228, 223), as aging is associated with reorganization and changes of the collagen matrix starting from the superficial layer at the articular surface (10); more significant increases in T2 have been observed in older individuals according to depth (228, 223) and in general throughout the cartilage (228). However, gender does not seem to have a great influence on regional variation of T2 as of yet (229).
Figure 21.
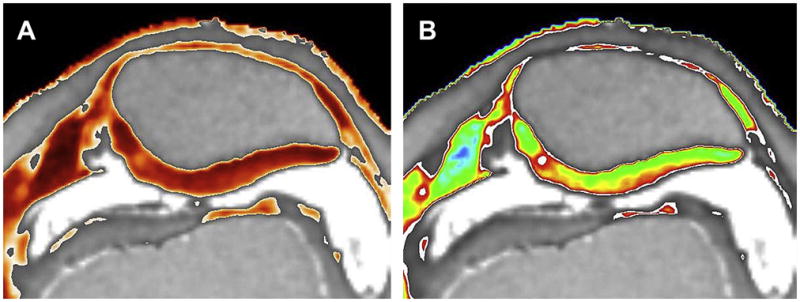
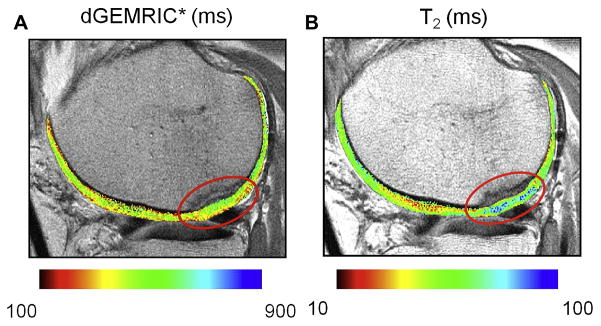
Figure 21A, B. Heat scale and color scale T2 maps of a 26 year-old female patient who had arthroscopic surgery for meniscal tear (Courtesy of Tim Mosher, M.D., Penn State University).
In spite of the numerous validation studies of changes in T2 correlating with the biochemical changes in cartilage, there have been relatively limited clinical application studies using quantitative T2 mapping in the evaluation of arthritis. Increased T2 values have been reported in subjects with radiographically evident osteoarthritis of the knee (92, 209, 225, 230, 217); however, the T2 values did not statistically correlate well with the radiographic degree of OA (225). Increased T2 values have been attributed to collagen matrix degeneration in early OA, which are not increased further with progression of the disease, so further investigations are needed to determine the significance of T2 changes and their relationship to disease progression and treatment response (10). However, T2 relaxation time still may provide an insight into the heterogeneous and complex process of cartilage degeneration in OA.
There have been studies investigating the relationship between cartilage morphology and T2, showing an inverse relationship between cartilage T2 and thickness (231, 225), higher cartilage T2 with greater loss of volume (232), increase in mean cartilage T2 at longitudinal follow-up after 12 months in OA groups (231), and increased T2 with cartilage defect regardless of unloading of the knee (233). The study by Apprich et al also explored the effects of biomechanical stress on cartilage, which has also been a subject of interest in recent studies (233).
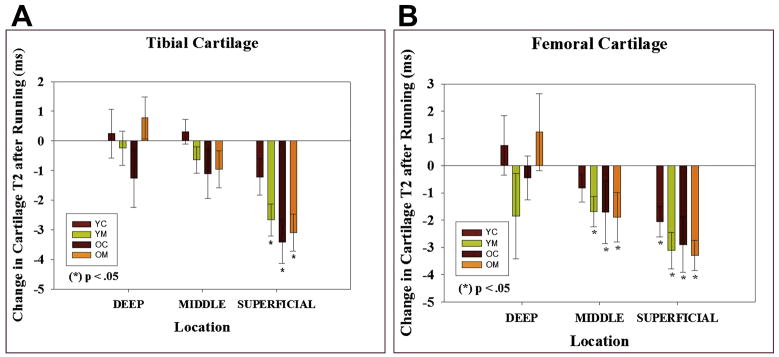
The effects of joint position and alignment have been investigated in several studies in animal (234) and human studies (235), with increased T2 values in knee flexion (234) and varus alignment (235). There have been other studies exploring the relationship between T2 values and cartilage biomechanics; in initial feasibility studies, decrease in T2 was observed when static compression was applied to the cartilage (236, 237, 238), confirming a strong correlation between change in collagen fiber orientation and T2 values (10). Quantitative T2 mapping in cartilage plugs showed zone-specific changes during compressive loading (198). In a study from the osteoarthritis initiative, physically active individuals had more knee abnormalities and higher patellar T2 values (239). In a recent study by Mosher et al, effect of age and training on knee cartilage were evaluated in response to running. Running resulted in decrease in cartilage thickness and T2 values in the superficial cartilage consistent with greater compressibility in the superficial layer, whereas age and level of physical activity did not affect the T2 changes in running (240); the changes in the superficial layer were concordant with results from an earlier study (241) (Figures 22, 23A, B). Thus, T2 mapping may be a valuable technique in investigating the role of cartilage biomechanics in cartilage physiology.
Figure 22.
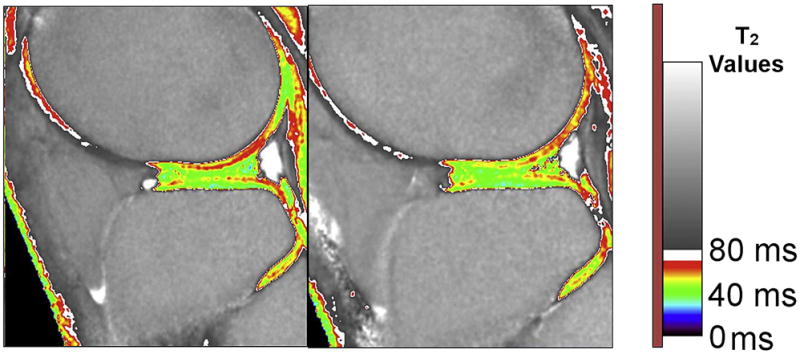
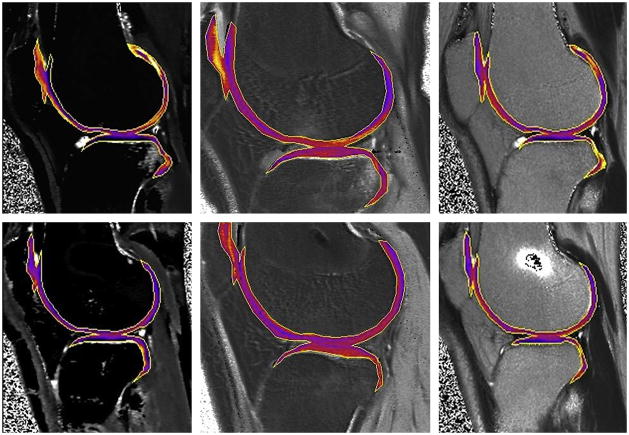
Functional Cartilage T2 Mapping: Change in T2 values after running.
In a 47-year old marathon runner, a T2 map after running show areas of T2 decrease, which may correspond to loss of cartilage water due to compression.
Figure 23.
Figure 23A, B. Functional Cartilage T2 mapping: Evaluating local tissue response to running.
YC: Young (18 – 30) control, YM young marathoner, OC: old (45 – 55 years) sedentary control, OM: old marathoner: Change in cartilage T2 values after 30 minutes of running demonstrate statistically significant decrease in T2 values of superficial femoral and tibial cartilage, but no change in T2 near the bone cartilage interface (reproduced with permission from Mosher TJ et al. Osteoarthritis Cartilage;18(3):358–364).
T2 mapping has also been used to evaluate cartilage repair tissue after treatment (140, 148, 169, 213, 242–251). In a study by White et al, repair tissue from osteochondral transplantation was shown to have the normal spatial variation of T2 values, which was absent in repair tissue from autologous chondrocyte implantation or microfracture techniques (246) (Figures 24A, B). In a study by Domayer et al, T2 mapping and dGEMRIC provided complementary information on the biochemical properties of repair tissue after autologous chondrocyte implantation with a fibrin-based scaffold in the knee, which resulted in repair tissue with spatial variation of T2 values similar to normal articular cartilage (148) (Figures 25A, B). Another study evaluated cartilage repair tissue using T2 and T2* mapping after matrix-associated autologous chondrocyte transplantation on 3.0T MRI and showed zonal variation (248). In a study by Mamisch et al., differences in response to unloading were evaluated in control and cartilage repair tissue of the knee using T2 mapping, and the results showed differences in early and late unloading T2 values between normal healthy and repaired cartilage (249). Although many of these studies are initial or preliminary studies, the results suggest T2 may be a potentially useful technique in postoperative evaluation of repaired cartilage.
Figure 24.
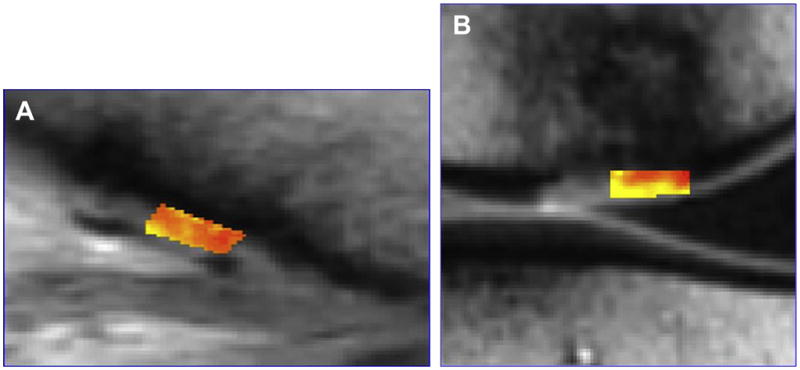
Figure 24A, B. T2 mapping can be used to follow cartilage repair clinically and shows a microfracture or fibrocartilage repair has lower T2 values than an osteochondral repair with hyaline cartilage (Courtesy of Lawrence White, University of Toronto).
Figure 25.
Figure 25A, B. An example of autologous chondrocyte implantation followed with dGEMRIC and T2 mapping. The dGEMRIC study showed increasing GAG in the repair site (A), indicating formation of hyaline cartilage (Courtesy of Miika Nieminen, University of Oulu and Oulu University Hospital, Oulu, Finland).
Ultrashort echo time (uTE) imaging
With the higher TEs (greater or equal to 10 milliseconds) used in most conventional T2-weighted sequences on conventional clinical scanners, MR signal from musculoskeletal tissues with short T2 characteristics, such as cortical bone, tendons, ligaments, menisci, and deep radial and calcified layers of cartilage decay rapidly and produce little or no signal (252, 253). With ultrashort-echo time (UTE) MR imaging, signal from tissues with predominantly short T2 (and T2*) can be detected (254, 252, 255, 256) using TEs that are 20–50 times or even 100–1000 times shorter than those used in conventional imaging sequences (252, 257–259), enabling visualization of layers which are not normally depicted well on conventional sequences. The hyaline articular cartilage layer has been depicted as two layers on subtraction images, consisting of a high signal layer and a low signal superficial layer (255). The region of the osteochondral junction consisting of the calcified cartilage layer and subchondral bone, which is important for solute transport between the vasculature and articular cartilage (260), has been implicated to be important in the pathogenesis of osteoarthritis (253) with changes beginning in the calcified layer affecting the more superficial cartilage and subsequently causing cartilage degeneration (261–267). However, the calcified layer of cartilage, due to rapid signal decay, produces little or no signal and is difficult to evaluate with conventional MR imaging sequences. In a study by Gold et al, projection-reconstruction spectroscopic imaging (PRSI) technique and non-Cartesian K-space trajectory 3D cones technique were used to depict articular cartilage at high-resolution in vivo at 5–10 minute scan times (258). A recent study by Bae et al, which used two complementary UTE techniques, suggested that the presence of the calcified layer as well as the deepest layer of uncalcified cartilage, with their short T2 values, contributed to the UTE signal without contribution from the subchondral bone (253) (Figure 26A–D).
Figure 26.
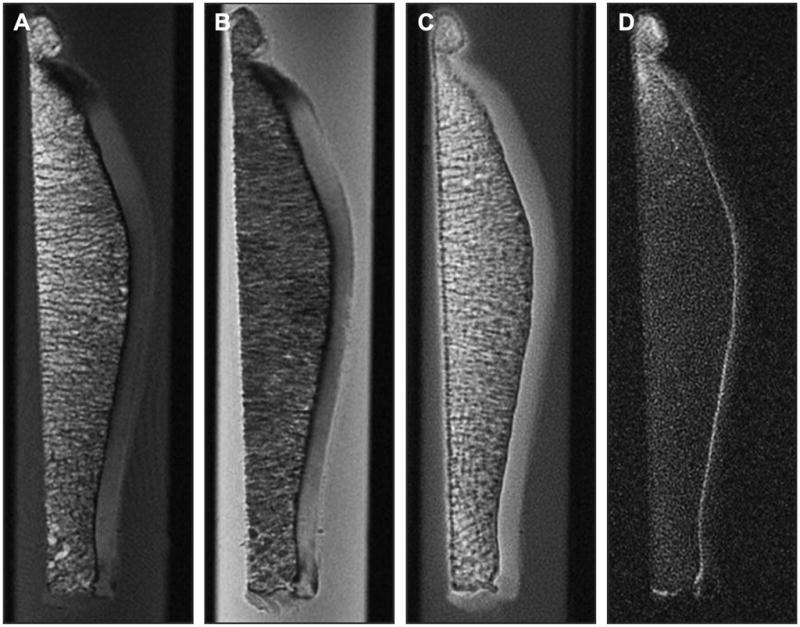
Figure 26A, B, C, D. Ultra-short Echo TIme MRI can be used to probe the deepest layer of cartilage, the calcified zone. Conventional MRI shows a signal void from this zone on T1- (A) and PD-weighted images (B), but uTE MRI (C) and UTE MRI with long T2 suppression (D) show signal from the calcified zone. This zone may be important in the development of OA (Courtesy of Christine Chung and Graeme Bydder, UCSD).
Technical challenges related to UTE imaging include distortion of the slice profile, errors in the radial k-space trajectories, and off resonance, which could be improved by gradient calibration, off-resonance correction, efficient long T2 water and fat suppression (268–270) (Figure 27, 28A, B, 29). In spite of the technical challenges and disadvantage of scan time and difficulty in slice selection, UTE imaging may allow evaluation of the calcified layer of cartilage in osteoarthritis (271). UTE imaging may also be useful for postoperative assessment of cartilage repair, where the removal of calcified layer has been reported to improve surgical outcome (272), and may be the only imaging method thus far which allows examination of the region of osteochondral junction.
Figure 27.
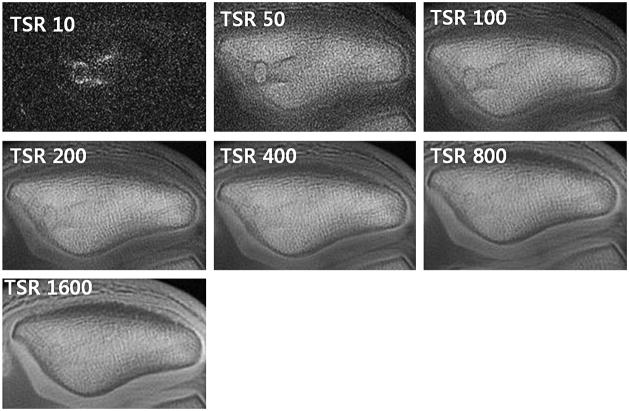
Images acquired at 7 points with a TSR ranging from 10 to 1600 msecs, where ROI placed in region of normal appearing calcified cartilage (arrow). In these volunteer images, Excellent tissue signal saturation at TSR 10 and best visualization of the calcified layer at TSR 200 – 800 are noted (Courtesy of Christine Chung, UCSD)..
Figure 28.
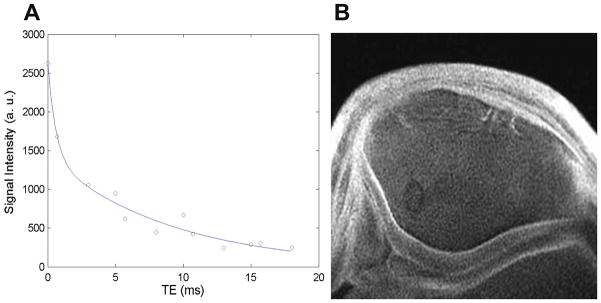
Figure 28A, B. T2* Measurement in a volunteer by constant TR-variable TE method (Courtesy of Christine Chung, UCSD).
Figure 29.
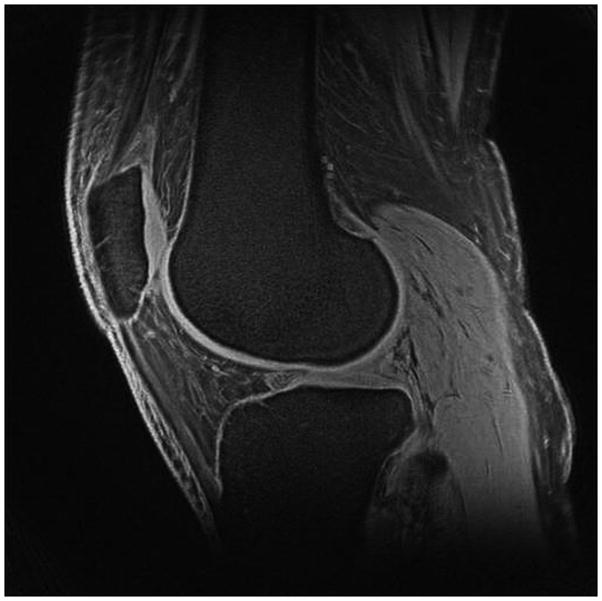
High resolution (300mm) UTE MRI at 3T depicts the calcified zone well (Courtesy of Christine Boada).
Magnetization Transfer
Magnetization transfer (MT) effect is present in any multi-slice MRI technique and is seen in cartilage (170, 273), especially prominent in the radial zone near the bone/cartilage interface (274). It is prominently seen in turbo spin echo (TSE) sequences and can be a source of error in quantitative mapping techniques such as T1 or T2 mapping when multi-slice TSE sequences are used (275–278). In contrast, gradient echo (GRE) sequences exhibit less MT, and by applying an off-resonance RF pulse immediately before the GRE sequence, one can obtain an MT contrast image (10) and by subtracting images, one may obtain an isolated contribution from MT; however, the resulting image is usually prone to artifacts and has poor signal to noise (10). Higher SNR may be achieved using 3.0T MR scanners (279).
As MT is affected by many factors, such as RF power, pulse profile, and offset frequency, quantification of MT is difficult (171, 280). Higher RF power accompanies the problem with SAR, so quantitative MT techniques have been studied in a limited number of human studies (281–284). Therefore, most studies have been conducted using tissue samples (283, 285–290) or animal models (291–293) and have shown that MT is affected mostly by the collagen content and changes in collagen-water interaction. In a study of bovine cartilage specimens, magnetization transfer ratio (MTR) showed depth-dependency and higher values in the radial zone compared with the superficial zone, which suggested that MTR may not only be dependent on collagen content, but other parameters, such as the arrangement of macromolecules, high solid content, bound water fraction, and radial orientation (274) (Figure 30). In spite of the limitations, the technique has been applied to improve contrast between cartilage and fluid and therefore, improve detection of localized cartilage lesions (281, 294–297) (Figure 30). In a study evaluating T1, T2, and magnetization transfer ratios in early diagnosis of patellar cartilage osteoarthritis, MTRs were found to have limitations in early diagnosis of OA (217). There have been also preliminary studies on postoperative cartilage repair tissue, one of which showed too small differences between damaged and repaired cartilage MTR but evolution towards normal MTR in repair tissue, especially after ACI repair (284). Another study showed contrasting results, suggesting MTR to be capable of detecting differences between normal cartilage and areas of cartilage repair and possibly a useful tool in imaging biochemical changes in cartilage after repair (298). Further investigations are needed to validate such studies.
Figure 30.
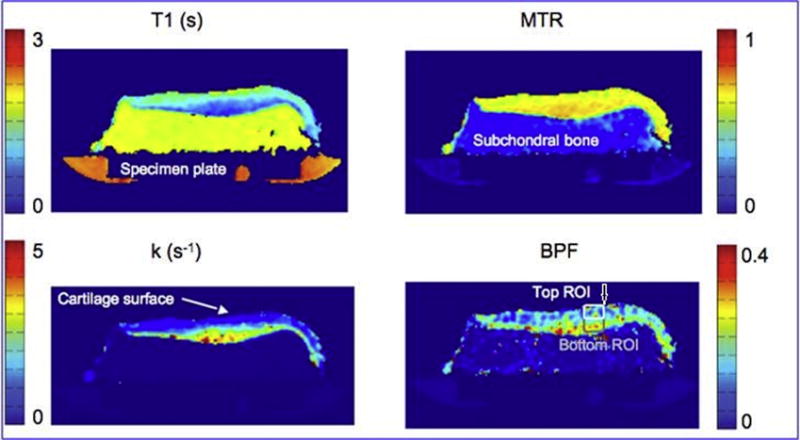
Quantitative magnetization transfer MRI can be used to detect changes in macromolecules. Here, the bound pool fraction (arrow) correlates with cartilage glycosaminoglycan in its top layer (Courtesy of Stikov, Keenan, Pauly et al. ISMRM 2010 #827)..
Diffusion-weighted Imaging
Water is abundant within normal cartilage, composing about 65% to 85% of the extracellular matrix, and imaging of water diffusion throughout the cartilage is possible with MRI. In vitro studies have shown diffusion-weighted imaging (DWI) to be sensitive to early cartilage degeneration (175, 299). The apparent diffusion coefficient (ADC) decreases as diffusion times get longer and indicate restriction of the water molecules by solid components of the cartilage, usually collagen network (116). When diffusion-sensitizing gradients are applied, water gains a random amount of phase and does not refocus, which results in signal loss of the tissue undergoing diffusion (112). The amount of diffusion weighting expressed as the b-value depends on the amplitude and timing of the diffusion-sensitizing gradients. And a map of the amount of diffusion that has occurred is called the ADC map, which uses the term “apparent” because the values reflect only the bulk water and not the water protons restricted by tissue membranes (112).
In vivo DWI of cartilage is difficult because in order to maximize cartilage signal, TE must be short, but diffusion-sensitizing gradients increase the TE and render the technique sensitive to motion (112). Single-shot techniques have been used for DWI, but they are limited by low SNR and spatial resolution (112); multiple acquisitions improve the SNR and resolution but motion correction is needed (300) (Figures 31A, B). In an in vivo study, ADC measurements of articular cartilage in healthy volunteers showed comparable results to a study using cartilage specimens (301).
Figure 31.
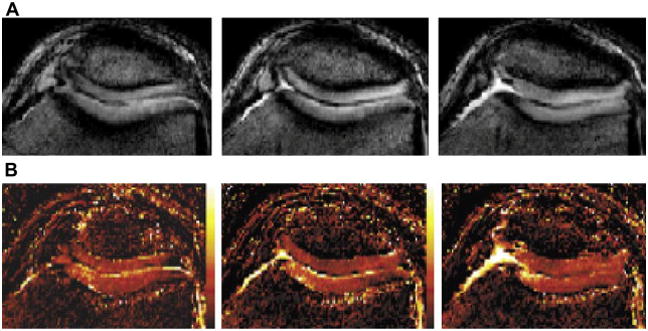
Figure 31A, B. 3D-SSFP cartilage diffusion Imaging (Reproduced with permission from Miller, et al. Magn Reson Med 51:394–398 (2004) p. 396, Figure 5).
Diffusion-weighted imaging has also evaluated in postoperative cartilage repair tissue. In a study by Mamisch et al, repaired cartilage after matrix-associated autologous chondrocyte transplantation at 3.0T using a steady-state precession (FSIP) technique called PSIF showed higher ADC values in the repaired cartilage and a decrease in values at later time point after surgery (302). In another study using high-field MRI, a dedicated multichannel coil, and sophisticated sequences, DWI showed higher ADC values in the repair tissue and was shown to provide additional information than T2 and T2* mapping about cartilage ultrastructure and cartilage repair tissue in the ankle joint (250). Similarly in another study, DWI was able to differentiate between healthy cartilage and cartilage repair tissue in both microfracture therapy and matrix-associated autologous chondrocyte transplantation with good correlation between ADC values and clinical scoring (251). In another recent study, DWI detected changes of diffusion within cartilage repair tissue up to two years after surgery, which then became stabilized with zonal variations (303). Even though the results of most of these studies are preliminary, they suggest DWI to be a potential useful technique in evaluation of the biochemical and physiological changes in postoperative cartilage repair tissue.
Summary
Whereas conventional MR imaging methods were able to depict morphological changes when the disease was already at a progressed state, the newer MR imaging methods are more based and cartilage physiology. Sodium imaging is highly specific for change in PG content without the need for an exogenous contrast agent but requires special transmit and receive coils, long imaging times, and is limited by SAR problems. T1 rho imaging is sensitive to early PG depletion but again is limited by SAR problems because it requires high RF power during the spin-locking preparation pulse. dGEMRIC has relatively high resolution and sensitivity but requires long imaging times, including a delay before imaging, and administration of an exogenous contrast agent, which accompanies a small risk of nephrogenic systemic fibrosis. T2 mapping is relatively straightforward to perform and is sensitive to changes in collagen as well as water content but may be less sensitive in early degeneration than other methods. Ultrashort echo time (UTE) MRI may be the only technique to examine osteochondral junction but technical challenges, such as scan time and difficulty in slice selection, make this challenging. Magnetization transfer provides improved contrast between cartilage and fluid, therefore allowing detection of localized cartilage lesions, but is difficult to quantify and again may have SAR problems. Diffusion weighted imaging may be a valuable tool in postoperative imaging but is limited by low SNR and spatial resolution. There remains much more to be investigated in the field of MR imaging of cartilage physiology, but these promising methods can give researchers important insights into the initiation, progression, and eventual treatment of osteoarthritis.
References
- 1.Liess C, Lusse S, Karger N, et al. Detection of changes in cartilage water content using MRI T2-mapping in vivo. Osteoarthritis Cartilage. 2002;10:907–913. doi: 10.1053/joca.2002.0847. [DOI] [PubMed] [Google Scholar]
- 2.Felson DT, Zhang Y, Hannan MT, et al. The incidence and natural history of knee osteoarthritis in the elderly. The Framingham Osteoarthritis Study. Arthritis Rheum. 1995;38(10):1500–1505. doi: 10.1002/art.1780381017. [DOI] [PubMed] [Google Scholar]
- 3.Lawrence RC, Felson DT, Helmick CG, et al. National Arthritis Data W. Estimates of the prevalence of arthritis and other rheumatic conditions in the United States. Part II. Arthritis Rehum. 2008;58(1):26–35. doi: 10.1002/art.23176. [DOI] [PMC free article] [PubMed] [Google Scholar]
- 4.Kim I, Kim HA, Seo YI, et al. The prevalence of knee osteoarthritis in elderly community residents in Korea. J Korean Med Sci. 2010;25(2):293–298. doi: 10.3346/jkms.2010.25.2.293. [DOI] [PMC free article] [PubMed] [Google Scholar]
- 5.Yoshimura N. Progress of research in osteoarthritis. Epidemiology of osteoarthritis in Japanese population. The Road study. Clin Calcium. 2009;19(11):1572–1577. [PubMed] [Google Scholar]
- 6.Kang X, Fransen M, Zhang Y, et al. The high prevalence of knee osteoarthritis in a rural Chinese population: the Wuchuan osteoarthritis study. Arthritis Rheum. 2009;61(5):641–647. doi: 10.1002/art.24464. [DOI] [PMC free article] [PubMed] [Google Scholar]
- 7.Poole AR. An introduction to the pathophysiology of osteoarthritis. Front Biosci. 1999;4:D662–D670. doi: 10.2741/poole. [DOI] [PubMed] [Google Scholar]
- 8.Roos H, Adalberth T, Dahlberg L, et al. Osteoarthritis of the knee after injury to the anterior cruciate ligament or meniscus: the influence of time and age. Osteoarthritis Cartilage. 1995;3:261–267. doi: 10.1016/s1063-4584(05)80017-2. [DOI] [PubMed] [Google Scholar]
- 9.van den Berg WB. Pathophysiology of osteoarthritis. Joint Bone Spine. 2000;67:555–556. doi: 10.1016/s1297-319x(00)00216-5. [DOI] [PubMed] [Google Scholar]
- 10.Gold GE, Mosher TJ. In: Arthritis in color: Advanced imaging of arthritis. Bruno MA, Mosher TJ, Gold GE, editors. Philadelphia: Elsevier Saunders; 2009. pp. 153–192. [Google Scholar]
- 11.Helmick CG, Felson DT, Lawrence RC, et al. Estimates of the prevalence of arthritis and other rheumatic conditions in the United States. Part I. Arthritis Rheum. 2008;58(1):15–25. doi: 10.1002/art.23177. [DOI] [PubMed] [Google Scholar]
- 12.Lawrence RC, Helmick CG, Arnett FC, et al. Estimates of the prevalence of arthritis and selected musculoskeletal disorders in the United States. Arthritis Rheum. 1998;41(5):778–799. doi: 10.1002/1529-0131(199805)41:5<778::AID-ART4>3.0.CO;2-V. [DOI] [PubMed] [Google Scholar]
- 13.Boegard T, Rudling O, Petersson IF, et al. Correlation between radiographically diagnosed osteophytes and magnetic resonance detected cartilage defects in the tibiofemoral joint. Ann Rheum Dis. 1998;57:401–407. doi: 10.1136/ard.57.7.401. [DOI] [PMC free article] [PubMed] [Google Scholar]
- 14.Coumas JM, Palmer WE. Knee arthrography: evolution and current status. Radiol Clin North Am. 1998;36:703–728. doi: 10.1016/s0033-8389(05)70057-9. [DOI] [PubMed] [Google Scholar]
- 15.Disler DG, McCauley TR. Clinical magnetic resonance imaging of articular cartilage. Top Magn Reson Imaging. 1998;9:360–376. [PubMed] [Google Scholar]
- 16.Gold GE, McCauley TR, Gray ML, et al. What’s new in cartilage? Radiographics. 2003;23:1227–1242. doi: 10.1148/rg.235035113. [DOI] [PubMed] [Google Scholar]
- 17.Hodler J, Resnick D. Current status of imaging of articular cartilage. Skeletal Radiol. 1996;25:703–709. doi: 10.1007/s002560050165. [DOI] [PubMed] [Google Scholar]
- 18.McCauley TR, Disler DG. Magnetic resonance imaging of articular cartilage of the knee. J Am Acad Orthop Surg. 2001;9:2–8. doi: 10.5435/00124635-200101000-00001. [DOI] [PubMed] [Google Scholar]
- 19.Recht MP, Resnick D. Magnetic resonance imaging of articular cartilage: an overview. Top Magn Reson Imaging. 1998;9:328–336. [PubMed] [Google Scholar]
- 20.Rubenstein JD, Li JG, Majumdar S, et al. Image resolution and signal-to-noise ratio requirements for MR imaging of degenerative cartilage. AJR Am J Roentgenol. 1997;169:1089–1096. doi: 10.2214/ajr.169.4.9308470. [DOI] [PubMed] [Google Scholar]
- 21.Reeder SB, Hargreaves BA, Yu H, et al. Homodyne reconstruction and IDEAL water-fat decomposition. Magn Reson Med. 2005;54:586–593. doi: 10.1002/mrm.20586. [DOI] [PubMed] [Google Scholar]
- 22.Cicuttini F, Forbes A, Asbeutah A, et al. Comparison and reproducibility of fast and conventional spoiled gradient-echo magnetic resonance sequences in the determination of knee cartilage volume. J Orthop Res. 2000;18:580–584. doi: 10.1002/jor.1100180410. [DOI] [PubMed] [Google Scholar]
- 23.Eckstein F, Westhoff J, Sittek H, et al. In vivo reproducibility of three-dimensional cartilage volume and thickness measurements with MR imaging. AJR Am J Roentgenol. 1998;170:593–597. doi: 10.2214/ajr.170.3.9490936. [DOI] [PubMed] [Google Scholar]
- 24.Mosher TJ. In: Arthritis in color: Advanced imaging of arthritis. Bruno MA, Mosher TJ, Gold GE, editors. Philadelphia: Elsevier Saunders; 2009. pp. 23–32. [Google Scholar]
- 25.Venn M, Maroudas A. Chemical composition and swelling of normal and osteoarthrotic femoral head cartilage. I. Chemical composition. Ann Rheum Dis. 1977;36:121–129. doi: 10.1136/ard.36.2.121. [DOI] [PMC free article] [PubMed] [Google Scholar]
- 26.Torzilli PA. Influence of cartilage conformation on its equilibrium water partition. J Orthop Res. 1985;3:473–483. doi: 10.1002/jor.1100030410. [DOI] [PubMed] [Google Scholar]
- 27.Maroudas A, Schneiderman R. “Free” and “exchangeable” or ‘trapped” and “non-exchangeable” water in cartilage. J Orthop Res. 1987;5:133–138. doi: 10.1002/jor.1100050117. [DOI] [PubMed] [Google Scholar]
- 28.Guilak F, Meyer BC, Ratcliffe A, et al. The effects of matrix compression on proteoglycan metabolism in articular cartilage explants. Osteoarthritis Cartilage. 1994;2:91–101. doi: 10.1016/s1063-4584(05)80059-7. [DOI] [PubMed] [Google Scholar]
- 29.Jay GD, Torres JR, Warman ML, et al. The role of lubricin in the mechanical behavior of synovial fluid. Proc Natl Acad Sci USA. 2007;104:6194–6199. doi: 10.1073/pnas.0608558104. [DOI] [PMC free article] [PubMed] [Google Scholar]
- 30.Clark JM. The organization of collagen fibrils in the superficial zones of articular cartilage. J Anat. 1990;171:117–130. [PMC free article] [PubMed] [Google Scholar]
- 31.Thompson AM, Stockwell RA. An ultrastructural study of the marginal transitional zone in the rabbit knee joint. J Anat. 1983;136:701–713. [PMC free article] [PubMed] [Google Scholar]
- 32.Xia Y, Moody JB, Burton-Wurster N, et al. Quantitative in situ correlation between microscopic MRI and polarized light microscopy studies of articular cartilage. Osteoarthritis Cartilage. 2001;9:393–406. doi: 10.1053/joca.2000.0405. [DOI] [PubMed] [Google Scholar]
- 33.Clark JM. The organization of collagen in cryofractured rabbit articular cartilage: a scanning elelctron microscopic study. J Orthop Res. 1985;3:17–29. doi: 10.1002/jor.1100030102. [DOI] [PubMed] [Google Scholar]
- 34.Clark JM. Variation in collagen fiber alignment in a joint surface: a scanning electron microscope study of the tibial plateau in dog, rabbit, and man. J Orthop Res. 1991;9:246–257. doi: 10.1002/jor.1100090213. [DOI] [PubMed] [Google Scholar]
- 35.Borthakur A, Mellon E, Niyogi S, et al. Sodium and T1 rho MRI for molecular and diagnostic imaging of articular cartilage. NMR Biomed. 2006;19:781–821. doi: 10.1002/nbm.1102. [DOI] [PMC free article] [PubMed] [Google Scholar]
- 36.Moger CJ, Barrett R, Bleuet P, et al. Regional variations of collagen orientation in normal and diseased articular cartilage and subchondral bone determined using small angle X-ray scattering (SAXS) Osteoarthritis Cartilage. 2007;15:682–687. doi: 10.1016/j.joca.2006.12.006. [DOI] [PubMed] [Google Scholar]
- 37.Gomez S, Toffanin R, Bernstorff S, et al. Collagen fibrils are differently organized in weight-bearing and not-weight-bearing regions of pig articular cartilage. J Exp Zool. 2000;287:346–352. [PubMed] [Google Scholar]
- 38.Thompson AM, Stockwell RA. An ultrastructural study of the marginal transitional zone in the rabbit knee joint. J Anat. 1983;136:701–713. [PMC free article] [PubMed] [Google Scholar]
- 39.Franzen A, Inerot S, Hejderup SO, et al. Variations in the composition of bovine hip articular cartilage with distance from the articular surface. Biochem J. 1981;195:535–543. doi: 10.1042/bj1950535. [DOI] [PMC free article] [PubMed] [Google Scholar]
- 40.Bayliss MT, Venn M, Maroudas A, et al. Structure of proteoglycans from different layers. [DOI] [PMC free article] [PubMed] [Google Scholar]
- 41.Roughley PJ. The structure and function of cartilage proteoglycans. Eur Cell Mater. 2006;12:92–101. doi: 10.22203/ecm.v012a11. [DOI] [PubMed] [Google Scholar]
- 42.Gray ML, Burstein D, Kim YJ, et al. Elizabeth Winston Lanier Award Winner. Magnetic resonance imaging of cartilage glycosaminoglycan: Basic principles, imaging technique, and clinical applications. J Orthop Res. 2007;26(3):281–291. doi: 10.1002/jor.20482. [DOI] [PubMed] [Google Scholar]
- 43.Maroudas AI. Balance between swelling pressure and collagen tension in normal and degenerative cartilage. Nature. 1976;260:808–809. doi: 10.1038/260808a0. [DOI] [PubMed] [Google Scholar]
- 44.Clark JM, Huber JD. The structure of the human subchondral plate. J Bone Joint Surg Br. 1990;72:866–873. doi: 10.1302/0301-620X.72B5.2211774. [DOI] [PubMed] [Google Scholar]
- 45.Otterness IG, Chang M, Burkhardt JE, et al. Histology and tissue chemistry of tidemark separation in hamsters. Vet Pathol. 1999;36:138–145. doi: 10.1354/vp.36-2-138. [DOI] [PubMed] [Google Scholar]
- 46.Doube M, Firth EC, Boyde A. Variations in articular calcified cartilage by site and exercise in the 18-month-old equine distal metacarpal condyle. Osteoarthritis Cartilage. 2007;15:1283–1292. doi: 10.1016/j.joca.2007.04.003. [DOI] [PubMed] [Google Scholar]
- 47.Mow VC, Huiskes R. Basic orthopaedic biomechanics & mechano-biology. Philadelphia: Lippincott Williams & Wilkins; 2005. [Google Scholar]
- 48.Lu XL, Mow VC. Biomechanics of articular cartilage and determination of material properties. Med Sci Sports Exerc. 2008;40:193–199. doi: 10.1249/mss.0b013e31815cb1fc. [DOI] [PubMed] [Google Scholar]
- 49.Armstrong CG, Mow VC. Variations in the intrinsic mechanical properties of human articular cartilage with age, degeneration, and water content. J Bone Joint Surg Am. 1982;64:88–94. [PubMed] [Google Scholar]
- 50.Wong M, Carter DR. Articular cartilage functional histomorphology and mechanobiology: a research perspective. Bone. 2003;33:1–13. doi: 10.1016/s8756-3282(03)00083-8. [DOI] [PubMed] [Google Scholar]
- 51.Schmidt MB, Mow VC, Chun LE, et al. Effects of proteoglycan extraction on the tensile behavior of articular cartilage. J Orthop Res. 1990;8:353–363. doi: 10.1002/jor.1100080307. [DOI] [PubMed] [Google Scholar]
- 52.Blumenkrantz G, Majumdar S. Quantitative magnetic resonance imaging of articular cartilage in osteoarthritis. European Cells and Materials. 2007;13:75–86. doi: 10.22203/ecm.v013a08. [DOI] [PubMed] [Google Scholar]
- 53.Dijkgraaf LC, deBont LG, Boering G, et al. The structure, biochemistry, and metabolism of osteoarthritis cartilage: a review of the literature. J Oral Maxillofac Surg. 1995;53:1182–1192. doi: 10.1016/0278-2391(95)90632-0. [DOI] [PubMed] [Google Scholar]
- 54.Gold GE, Hargreaves BA, Stevens KJ, et al. Advanced MR imaging of articular cartilage. Orthop Clin North Am. 2006;37(3):331–347. vi. doi: 10.1016/j.ocl.2006.04.006. [DOI] [PubMed] [Google Scholar]
- 55.Shapiro EM, Borthakur A, Gougoutas A, et al. 23Na MRI accurately measures fixed charge density in articular cartilage. Magn Reson Med. 2002;47(2):284–291. doi: 10.1002/mrm.10054. [DOI] [PMC free article] [PubMed] [Google Scholar]
- 56.Boada FE, Shen GX, Chang SY, et al. Spectrally weighted twisted projection imaging: reducing T2 signal attenuation effects in fast three-dimensional sodium imaging. Magn Reson Med. 1997;38:1022–1028. doi: 10.1002/mrm.1910380624. [DOI] [PubMed] [Google Scholar]
- 57.Maroudas A, Muir H, Wingham J. The correlation of fixed negative charge with glycosaminoglycan content of human articular cartilage. Biochim Biophys Acta. 1969;177:492–500. doi: 10.1016/0304-4165(69)90311-0. [DOI] [PubMed] [Google Scholar]
- 58.Borthakur A, Hancu I, Boada FE, et al. In vivo triple quantum filtered twisted projection sodium MRI of human articular cartilage. J Magn Reson. 1999;141(2):286–290. doi: 10.1006/jmre.1999.1923. [DOI] [PubMed] [Google Scholar]
- 59.Borthakur A, Shapiro EM, Beers J, et al. Sensitivity of MRI to proteoglycan depletion in cartilage: comparison of sodium and proton MRI. Osteoarthritis Cartilage. 2000;8(4):288–293. doi: 10.1053/joca.1999.0303. [DOI] [PubMed] [Google Scholar]
- 60.Borthakur A, Shapiro EM, Akella SV, et al. Quantifying sodium in the human wrist in vivo by using MR imaging. Radiology. 2002;224:598–602. doi: 10.1148/radiol.2242011039. [DOI] [PubMed] [Google Scholar]
- 61.Insko EK, Kaufman JH, Leigh JS, et al. Sodium NMR evaluation of articular cartilage degradation. Magn Reson Med. 1999;41:30–34. doi: 10.1002/(sici)1522-2594(199901)41:1<30::aid-mrm6>3.0.co;2-u. [DOI] [PubMed] [Google Scholar]
- 62.Reddy R, Insko EK, Noyszewski EA, et al. Sodium MRI of human articular cartilage in vivo. Magn Reson Med. 1998;39:697–701. doi: 10.1002/mrm.1910390505. [DOI] [PubMed] [Google Scholar]
- 63.Wheaton AJ, Borthakur A, Dodge GR, et al. Sodium magnetic resonance imaging of proteoglycan depletion in an in vivo model of osteoarthritis. Acad Radiol. 2004;11:21–28. doi: 10.1016/s1076-6332(03)00574-9. [DOI] [PubMed] [Google Scholar]
- 64.Shapiro EM, Borthakur A, Dandora R, et al. Sodium visibility and quantitation in intact bovine articular cartilage using high field (23)Na MRI and MRS. J Magn Reson. 2000;142:24–31. doi: 10.1006/jmre.1999.1932. [DOI] [PubMed] [Google Scholar]
- 65.Choy J, Ling W, Jerschow A. Selective detection of ordered sodium signals via the central transition. J Magn Reson. 2006;180:105–109. doi: 10.1016/j.jmr.2006.01.011. [DOI] [PubMed] [Google Scholar]
- 66.Hancu I, van der Maarel JR, Boada FE. A model for the dynamics of spins 3/2 in biological media: signal loss during radiofrequency excitation in triple-quantum-filtered sodium MRI. J Magn Reson. 2000;147:179–191. doi: 10.1006/jmre.2000.2177. [DOI] [PubMed] [Google Scholar]
- 67.Ling W, Jerschow A. Selecting ordered environments in NMR of spin 3/2 nuclei via frequency-sweep pulses. J Magn Reson. 2005;176:234–238. doi: 10.1016/j.jmr.2005.06.006. [DOI] [PubMed] [Google Scholar]
- 68.Ling W, Regatte RR, Schweitzer ME, et al. Behavior of ordered sodium in enzymatically depleted cartilage tissue. Magn Reson Med. 2006;56:1151–1155. doi: 10.1002/mrm.21062. [DOI] [PubMed] [Google Scholar]
- 69.Navon G, Shinar H, Eliav U, et al. Multiquantum filters and order in tissues. NMR Biomed. 2001;14:112–132. doi: 10.1002/nbm.687. [DOI] [PubMed] [Google Scholar]
- 70.Shinar H, Navon G. Multinuclear NMR and microscopic MRI studies of the articular cartilage nanostructure. NMR Biomed. 2006;19:877–893. doi: 10.1002/nbm.1068. [DOI] [PubMed] [Google Scholar]
- 71.Speer DP, Dahners L. The collagenous architecture of articular cartilage: correlation of scanning electron microscopy and polarized light microscopy observations. Clin Orthop Relat Res. 1979;139:267–275. [PubMed] [Google Scholar]
- 72.Jeffery AK, Blunn GW, Archer CW, et al. Three-dimensional collagen architecture in bovine articular cartilage. J Bone Joint Surg Br. 1991;73:795–801. doi: 10.1302/0301-620X.73B5.1894669. [DOI] [PubMed] [Google Scholar]
- 73.Wang L, Wu Y, Chang G, et al. Rapid isotropic 3D-sodium MRI of the knee joint in vivo at 7T. J Magn Reson Imaging. 2009;30(3):606–614. doi: 10.1002/jmri.21881. [DOI] [PMC free article] [PubMed] [Google Scholar]
- 74.Staroswiecki E, Bangerter NK, Gurney PT, et al. In vivo sodium imaging of human patellar cartilage with a 3D cones sequence at 3T and 7T. J Magn Reson Imaging. 2010;32(2):446–451. doi: 10.1002/jmri.22191. [DOI] [PMC free article] [PubMed] [Google Scholar]
- 75.Trattnig S, Welsch GH, Juras V, et al. 23Na MR imaging at 7T after knee matrix-associated autologous chondrocyte transplantation: preliminary results. Radiology. 2010 Aug 16; doi: 10.1148/radiol.10100279. [Epub ahead of print] [DOI] [PubMed] [Google Scholar]
- 76.Hancu I, Boada FE, Shen GX. Three-dimensional triple-quantum-filtered (23)Na imaging of in vivo human brain. Magn Reson Med. 1999;42:1146–1154. doi: 10.1002/(sici)1522-2594(199912)42:6<1146::aid-mrm20>3.0.co;2-s. [DOI] [PubMed] [Google Scholar]
- 77.Rong P, Regatte RR, Jerschow A. Clean demarcation of cartilage tissue 23Na by inversion recovery. J Magn Reson. 2008;193(2):207–209. doi: 10.1016/j.jmr.2008.04.036. [DOI] [PMC free article] [PubMed] [Google Scholar]
- 78.Burstein D, Velyvis J, Scott KT, et al. Protocol issues for delayed Gd(DTPA)2−-enhanced MRI (dGEMRIC) for clinical evaluation of articular cartilage. Magn Reson Med. 2001;45(1):36–41. doi: 10.1002/1522-2594(200101)45:1<36::aid-mrm1006>3.0.co;2-w. [DOI] [PubMed] [Google Scholar]
- 79.Pruessmann KP, Weiger M, Scheidegger MB, et al. SENSE: sensitivity encoding for fast MRI. Magn Reson Med. 1999;42(5):952–962. [PubMed] [Google Scholar]
- 80.Sodickson DK, Manning WJ. Simultaneous acquisition of spatial harmonics (SMASH): fast imaging with radiofrequency coil arrays. Magn Reson Med. 1997;38(4):591–603. doi: 10.1002/mrm.1910380414. [DOI] [PubMed] [Google Scholar]
- 81.Mlynarik V, Trattnig S, Huber M, et al. The role of relaxation times in monitoring proteoglycan depletion in articular cartilage. J Magn Reson Imaging. 1999;10:497–502. doi: 10.1002/(sici)1522-2586(199910)10:4<497::aid-jmri1>3.0.co;2-t. [DOI] [PubMed] [Google Scholar]
- 82.Mlynarik V, Szomolanyi P, Toffanin R, et al. Transverse relaxation mechanisms in articular cartilage. J Magn Reson. 2004;169:300–307. doi: 10.1016/j.jmr.2004.05.003. [DOI] [PubMed] [Google Scholar]
- 83.Menezes NM, Gray ML, Hartke JR, et al. T2 and T1 rho MRI in articular cartilage systems. Magn Reson Med. 2004;51:503–509. doi: 10.1002/mrm.10710. [DOI] [PubMed] [Google Scholar]
- 84.Reddy R, Insko EK, Kaufman JH, et al. MR imaging of cartilage under spin-locking. Proceedings of the International Society of Magnetic Resonance Medicine; Nice. 1995. p. 1535. [Google Scholar]
- 85.Regatte RR, Akella SV, Borthakur A, et al. Proteoglycan depletion-induced changes in transverse relaxation maps of cartilage: comparison of T2 and T1rho. Acad Radiol. 2002;9:1388–1394. doi: 10.1016/s1076-6332(03)80666-9. [DOI] [PubMed] [Google Scholar]
- 86.Regatte RR, Akella SV, Borthakur A, et al. Proton spin-lock ratio imaging for quantitation of glycosaminoglycans in articular cartilage. J Magn Reson Imaging. 2003;17:114–121. doi: 10.1002/jmri.10228. [DOI] [PubMed] [Google Scholar]
- 87.Duvvuri U, Kudchodkar S, Reddy R, et al. T1rho relaxation can assess longitudinal proteoglycan loss from articular cartilage in vitro. Osteoarthritis Cartilage. 2002;10:838–844. doi: 10.1053/joca.2002.0826. [DOI] [PubMed] [Google Scholar]
- 88.Duvvuri U, Reddy R, Patel SD, et al. T1rho-relaxation in articular cartilage: effects of enzymatic degradation. Magn Reson Med. 1997;38:863–867. doi: 10.1002/mrm.1910380602. [DOI] [PubMed] [Google Scholar]
- 89.Akella SV, Regatte RR, Gougoutas AJ, et al. Proteoglycan-induced changes in T1 rho-relaxation of articular cartilage at 4T. Magn Reson Med. 2001;46:419–423. doi: 10.1002/mrm.1208. [DOI] [PubMed] [Google Scholar]
- 90.Wheaton AJ, Dodge GR, Borthakur A, et al. Detection of changes in articular cartilage proteoglycan by T(1rho) magnetic resonance imaging. J Orthop Res. 2005;23:102–108. doi: 10.1016/j.orthres.2004.06.015. [DOI] [PMC free article] [PubMed] [Google Scholar]
- 91.Wheaton AJ, Casey FL, Gougoutas AJ, et al. Correlation of T1rho with fixed charge density in cartilage. J Magn Reson Imaging. 2004;20:519–525. doi: 10.1002/jmri.20148. [DOI] [PubMed] [Google Scholar]
- 92.Regatte RR, Akella SV, Lonner JH, et al. T1 rho relaxation mapping in human osteoarthritis (OA) cartilage: comparison of T1rho with T2. J Magn Reson Imaging. 2006;23:547–553. doi: 10.1002/jmri.20536. [DOI] [PubMed] [Google Scholar]
- 93.Li X, Han ET, Crane JC, et al. Development of in vivo multi-slice spiral T1 rho mapping in cartilage at 3T and its application to osteoarthritis. [abstract 479]. Proc Ann Meeting Int Soc Magn Resonance Med (ISMRM); Miami, Florida. 2005. [Google Scholar]
- 94.Regatte RR, Akella SV, Wheaton AJ, et al. 3D-T1 rho-relaxation mapping of articular cartilage: in vivo assessment of early degenerative changes in symptomatic osteoarthritic subjects. Acad Radiol. 2004;11:741–749. doi: 10.1016/j.acra.2004.03.051. [DOI] [PubMed] [Google Scholar]
- 95.Taylor C, Carballido-Gamio J, Majumdar S, et al. Comparison of quantitative imaging of cartilage for osteoarthritis: T2, T1rho, DGEMRIC and contrast-enhanced computed tomography. Magn Reson Imaging. 2009;27(6):779–784. doi: 10.1016/j.mri.2009.01.016. [DOI] [PMC free article] [PubMed] [Google Scholar]
- 96.Majumdar S, Li X, Blumenkrantz G, et al. MR imaging and early cartilage degeneration and strategies for monitoring regeneration. J Musculoskelet Neuronal Interact. 2006;6:382–384. [PubMed] [Google Scholar]
- 97.Regatte RR, Akella SV, Borthakur A, et al. In vivo proton MR three-dimensional T1rho mapping of human articular cartilage: initial experience. Radiology. 2003;229:269–274. doi: 10.1148/radiol.2291021041. [DOI] [PubMed] [Google Scholar]
- 98.Wheaton AJ, Borthakur A, Kneeland JB, et al. In vivo quantification of T1rho using a multislice spin-lock pulse sequence. Magn Reson Med. 2004;52:1453–1458. doi: 10.1002/mrm.20268. [DOI] [PubMed] [Google Scholar]
- 99.Akella SV, Regatte RR, Borthakur A, et al. T1 rho MR imaging of the human wrist in vivo. Acad Radiol. 2003;10:614–619. doi: 10.1016/s1076-6332(03)80079-x. [DOI] [PubMed] [Google Scholar]
- 100.Pakin SK, Schweitzer ME, Regatte RR. 3D-T1rho quantitation of patellar cartilage at 3.0T. J Magn Reson Imaging. 2006;24:1357–1363. doi: 10.1002/jmri.20733. [DOI] [PubMed] [Google Scholar]
- 101.Borthakur A, Wheaton A, Charagundla SR, et al. Three-dimensional T1rho-weighted MRI at 1.5 Tesla. J Magn Reson Imaging. 2003;17:730–736. doi: 10.1002/jmri.10296. [DOI] [PubMed] [Google Scholar]
- 102.Zuo J, Li X, Banerjee S, et al. Parallel imaging of knee cartilage at 3 Tesla. J Magn Reson Imaging. 2007;26:1001–1009. doi: 10.1002/jmri.21122. [DOI] [PubMed] [Google Scholar]
- 103.Witschey WR, Borthakur A, Elliott MA, et al. T1rho-prepared balanced gradient echo for rapid 3D T1rho MRI. J Magn Reson Imaging. 2008;28:744–754. doi: 10.1002/jmri.21444. [DOI] [PMC free article] [PubMed] [Google Scholar]
- 104.Pakin SK, Xu J, Schweitzer ME, et al. Rapid 3D-T1rho mapping of the knee joint at 3.0T with parallel imaging. Magn Reson Med. 2006;56:563–571. doi: 10.1002/mrm.20982. [DOI] [PubMed] [Google Scholar]
- 105.Maroudas A. Physicochemical properties of articular cartilage. In: Freeman M, editor. Adult articular cartilage. 2. London: Pitman Medical; 1979. pp. 215–290. [Google Scholar]
- 106.Eisenberg SR, Grodzinsky AJ. Swelling of articular cartilage and other connective tissues: electromechanochemical forces. J Orthop Res. 1985;3:148–159. doi: 10.1002/jor.1100030204. [DOI] [PubMed] [Google Scholar]
- 107.Frank EH, Grodzinsky AJ, Koob TJ, et al. Streaming potentials: a sensitive index of enzymatic degradation in particular cartilage. J Orthop Res. 1987;5:497–508. doi: 10.1002/jor.1100050405. [DOI] [PubMed] [Google Scholar]
- 108.Maroudas A, Bayliss MT, Venn MF. Further studies on the composition of human femoral head cartilage. Ann Rheum Dis. 1980;39:514–523. doi: 10.1136/ard.39.5.514. [DOI] [PMC free article] [PubMed] [Google Scholar]
- 109.Maroudas A, Venn M. Chemical composition and swelling of normal and osteoarthrotic femoral cartilage. II. Swelling. Ann Rheum Dis. 1977;36:399–406. doi: 10.1136/ard.36.5.399. [DOI] [PMC free article] [PubMed] [Google Scholar]
- 110.Ficat C, Maroudas A. Cartilage of the patella. Topographical variation of glycosaminoglycan content in normal and fibrillated tissue. Ann Rheum Dis. 1975;34:515–519. doi: 10.1136/ard.34.6.515. [DOI] [PMC free article] [PubMed] [Google Scholar]
- 111.Maroudas A, Evans H, Almeida L. Cartilage of the hip joint. Topographical variation of glycosaminoglycan content in normal and fibrillated tissue. Ann Rheum Dis. 1973;32:1–9. doi: 10.1136/ard.32.1.1. [DOI] [PMC free article] [PubMed] [Google Scholar]
- 112.Gold GE, Burstein D, Dardzinski B, et al. MRI of articular cartilage in OA: novel pulse sequences and composition/functional markers. Osteoarthritis Cartilage. 2006;14 (Suppl A):A76–A86. doi: 10.1016/j.joca.2006.03.010. [DOI] [PubMed] [Google Scholar]
- 113.Gray ML, Burstein D, Xia Y. Biochemical (and functional) imaging of articular cartilage. Semin Musculoskelet Radiol. 2001;5:329–343. doi: 10.1055/s-2001-19043. [DOI] [PubMed] [Google Scholar]
- 114.Gray ML, Burstein D. Molecular (and functional) imaging of articular cartilage. J Musculoskelet Neuronal Interact. 2004;4:365–368. [PubMed] [Google Scholar]
- 115.Bashir A, Gray ML, Hartke J, et al. Nondestructive imaging of human cartilage glycosaminoglycan concentration by MRI. Magn Reson Med. 1999;41:857–865. doi: 10.1002/(sici)1522-2594(199905)41:5<857::aid-mrm1>3.0.co;2-e. [DOI] [PubMed] [Google Scholar]
- 116.Burstein D, Gray ML, Hartman AL, et al. Diffusion of small solutes in cartilage as measured by nuclear magnetic resonance (NMR) spectroscopy and imaging. J Orthop Res. 1993;11:465–478. doi: 10.1002/jor.1100110402. [DOI] [PubMed] [Google Scholar]
- 117.Trattnig S, Mlynarik V, Breitenseher M, et al. MRI visualization of proteoglycan depletion in articular cartilage via intravenous administration of Gd-DTPA. Magn Reson Imaging. 1999;17:577–583. doi: 10.1016/s0730-725x(98)00215-x. [DOI] [PubMed] [Google Scholar]
- 118.Allen RG, Burstein D, Gray ML. Monitoring glycosaminoglycan replenishment in cartilage explants with gadolinium-enhanced magnetic resonance imaging. J Orthop Res. 1999;17:430–436. doi: 10.1002/jor.1100170320. [DOI] [PubMed] [Google Scholar]
- 119.Williams A, Oppenheimer RA, Gray ML, et al. Differential recovery of glycosaminoglycan after IL-1-induced degradation of bovine articular cartilage depends on degree of degradation. Arthritis Res Ther. 2003;5:R97–105. doi: 10.1186/ar615. [DOI] [PMC free article] [PubMed] [Google Scholar]
- 120.Nieminen MT, Rieppo J, Silvennoinen J, et al. Spatial assessment of articular cartilage proteoglycans with Gd-DTPA-enhanced T1 imaging. Magn Reson Med. 2002;48:640–648. doi: 10.1002/mrm.10273. [DOI] [PubMed] [Google Scholar]
- 121.Tiderius CJ, Tjornstrand J, Akeson P, et al. Delayed gadolinium-enhanced MRI of cartilage (dgemric): intra- and interobserver variability in standardized drawing of regions of interest. Acta Radiol. 2004;45:628–634. doi: 10.1080/02841850410008379. [DOI] [PubMed] [Google Scholar]
- 122.Bashir A, Gray ML, Boutin RD, et al. Glycosaminoglycan in articular cartilage: in vivo assessment with delayed Gd(DTPA)(2−)-enhanced MR imaging. Radiology. 1997;205:551–558. doi: 10.1148/radiology.205.2.9356644. [DOI] [PubMed] [Google Scholar]
- 123.Hargreaves BA, Gold GE, Beaulieu CF, et al. Comparison of new sequences for high-resolution cartilage imaging. Magn Reson Med. 2003;49:700–709. doi: 10.1002/mrm.10424. [DOI] [PubMed] [Google Scholar]
- 124.Gillis A, Bashir A, McKeon B, et al. Magnetic resonance imaging of relative glycosaminoglycan distribution in patients with autologous chondrocyte transplants. Invest Radiol. 2001;36:743–748. doi: 10.1097/00004424-200112000-00010. [DOI] [PubMed] [Google Scholar]
- 125.Vasara AI, Nieminen MT, Jurvelin JS, et al. Indentation stiffness of repair tissue after autologous chondrocyte transplantation. Clin Orthop Relat Res. 2005;433:233–242. doi: 10.1097/01.blo.0000150567.00022.2e. [DOI] [PubMed] [Google Scholar]
- 126.Tiderius CJ, Olsson LE, Leander P, et al. Delayed gadolinium-enhanced MRI of cartilage (dGEMRIC) in early knee osteoarthritis. Magn Reson Med. 2003;49:488–492. doi: 10.1002/mrm.10389. [DOI] [PubMed] [Google Scholar]
- 127.Nojiri T, Watanabe N, Namura T, et al. Utility of delayed gadolinium-enhanced MRI (dgemric) for qualitative evaluation of articular cartilage of patellofemoral joint. Knee Surg Sports Traumatol Arthrosc. 2006;14:718–723. doi: 10.1007/s00167-005-0013-6. [DOI] [PubMed] [Google Scholar]
- 128.Williams A, Sharma L, McKenzie CA, et al. Delayed gadolinium-enhanced magnetic resonance imaging of cartilage in knee osteoarthritis: findings at different radiographic stages of disease and relationship to malalignment. Arthritis Rheum. 2005;52:3528–3535. doi: 10.1002/art.21388. [DOI] [PubMed] [Google Scholar]
- 129.Tiderius CJ, Svensson J, Leander P, et al. DGEMRIC (delayed gadolinium-enhanced MRI of cartilage) indicates adaptive capacity of human knee cartilage. Magn Reson Med. 2004;51:286–290. doi: 10.1002/mrm.10714. [DOI] [PubMed] [Google Scholar]
- 130.Roos EM, Dahlberg L. Positive effects of moderate exercise on glycosaminoglycan content in knee cartilage: a four-month, randomized, controlled trial in patients at risk of osteoarthritis. Arthritis Rheum. 2005;52:3507–3514. doi: 10.1002/art.21415. [DOI] [PubMed] [Google Scholar]
- 131.Tiderius CJ, Olsson LE, de Verdier H, et al. Gd-DTPA2-enhanced MRI of femoral knee cartilage: a dose-response study in healthy volunteers. Magn Reson Med. 2001;46:1067–1071. doi: 10.1002/mrm.1300. [DOI] [PubMed] [Google Scholar]
- 132.Williams A, Gillis A, McKenzie C, et al. Glycosaminoglycan distribution in cartilage as determined by delayed gadolinium-enhanced MRI of cartilage (DGEMRIC): potential clinical applications. AJR Am J Roentgenol. 2004;182:167–172. doi: 10.2214/ajr.182.1.1820167. [DOI] [PubMed] [Google Scholar]
- 133.Tiderius CJ, Olsson LE, Nyquist F, et al. Cartilage glycosaminoglycan loss in the acute phase after an anterior cruciate ligament injury: delayed gadolinium-enhanced magnetic resonance imaging of cartilage and synovial fluid analysis. Arthritis Rheum. 2005;52:120–127. doi: 10.1002/art.20795. [DOI] [PubMed] [Google Scholar]
- 134.Young AA, Stanwell P, Williams A, et al. Glycosaminoglycan content of knee cartilage following posterior cruciate ligament rupture demonstrated by delayed gadolinium-enhanced magnetic resonance imaging of cartilage (Dgemric). A case report. J Bone Joint Surg [Am] 2005;87:2763–2767. doi: 10.2106/JBJS.D.02923. [DOI] [PubMed] [Google Scholar]
- 135.Stevens K, Hishioka H, Steines D, et al. Contrast enhanced MRI measurement of GAG concentrations in articular cartilage of knees with early osteoarthritis. Proceedings of the Radiological Society of North America. 2001:275. [Google Scholar]
- 136.Kim YJ, Jaramillo D, Millis MB, et al. Assessment of early osteoarthritis in hip dysplasia with delayed gadolinium-enhanced magnetic resonance imaging of cartilage. J Bone Joint Surg Am. 2003;85-A:1987–1992. doi: 10.2106/00004623-200310000-00019. [DOI] [PubMed] [Google Scholar]
- 137.Cunningham T, Jessel R, Zurakowski D, et al. Delayed gadolinium-enhanced magnetic resonance imaging of cartilage to predict early failure of Bernese periacetabular osteotomy for hip dysplasia. J Bone Joint Surg [Am] 2006;88:1540–1548. doi: 10.2106/JBJS.E.00572. [DOI] [PubMed] [Google Scholar]
- 138.Samosky JT, Burstein D, Eric Grimson W, et al. Spatially-localized correlation of Dgemric-measured GAG distribution and mechanical stiffness in the human tibial plateau. J Orthop Res. 2005;23:93–101. doi: 10.1016/j.orthres.2004.05.008. [DOI] [PubMed] [Google Scholar]
- 139.Baldassarri M, Goodwin JS, Farley ML, et al. Relationship between cartilage stiffness and GAG content: correlation and prediction. J Orthop Res. 2007;25:904–912. doi: 10.1002/jor.20378. [DOI] [PubMed] [Google Scholar]
- 140.Kurkijarvi JE, Nissi MJ, Kiviranta I, et al. Delayed gadolinium-enhanced MRI of cartilage (Dgemric) and T2 characteristics of human knee articular cartilage: topographical variation and relationships to mechanical properties. Magn Reson Med. 2004;52:41–46. doi: 10.1002/mrm.20104. [DOI] [PubMed] [Google Scholar]
- 141.Nissi MJ, Toyras J, Laasanen MS, et al. Proteoglycan and collagen sensitive MRI evaluation of normal and degenerated articular cartilage. J Orthop Res. 2004;22:557–564. doi: 10.1016/j.orthres.2003.09.008. [DOI] [PubMed] [Google Scholar]
- 142.Mayerhoefer ME, Welsch GH, Mamisch TC, et al. The in vivo effects of unloading and compression on T1-Gd (Dgemric) relaxation times in healthy articular knee cartilage at 3.0 Tesla. Eur Radiol. 2010;20:443–449. doi: 10.1007/s00330-009-1559-3. [DOI] [PubMed] [Google Scholar]
- 143.Trattnig S, Mamisch TC, Pinker K, et al. Differentiating normal hyaline cartilage from post-surgical repair tissue using fast gradient echo imaging in delayed gadolinium-enhanced MRI (Dgemric) at 3 Tesla. Eur Radiol. 2008;18:1251–1259. doi: 10.1007/s00330-008-0859-3. [DOI] [PubMed] [Google Scholar]
- 144.Kurkijarvi JE, Mattila L, Ojala RO, et al. Evaluation of cartilage repair in the distal femur after autologous chondrocyte transplantation using T2 relaxation time and Dgemric. Osteoarthritis Cartilage. 2007;15:372–378. doi: 10.1016/j.joca.2006.10.001. [DOI] [PubMed] [Google Scholar]
- 145.Miyata S, Homma K, Numano T, et al. Assessment of fixed charge density in regenerated cartilage by Gd-DTPA-enhanced MRI. Magn Reson Med Sci. 2006;5:73–78. doi: 10.2463/mrms.5.73. [DOI] [PubMed] [Google Scholar]
- 146.Trattnig S, Marlovits S, Gebetsroither S, et al. Three-dimensional delayed gadolinium-enhanced MRI of cartilage (dGEMRIC) for in vivo evaluation of reparative cartilage after matrix-associated autologous chondrocyte transplantation at 3.0T: preliminary results. J Magn Reson Imaging. 2007;26:974–982. doi: 10.1002/jmri.21091. [DOI] [PubMed] [Google Scholar]
- 147.Watanabe A, Wada Y, Obata T, et al. Delayed gadolinium-enhanced MR to determine glycosaminoglycan concentration in reparative cartilage after autologous chondrocyte implantation: preliminary results. Radiology. 2006;239:201–108. doi: 10.1148/radiol.2383050173. [DOI] [PubMed] [Google Scholar]
- 148.Domayer SE, Welsch GH, Nehrer S, et al. T2 mapping and dGEMRIC after autologous chondrocyte implantation with a fibrin-based scaffold in the knee: preliminary results. Eur J Radiol. 2010;73(3):636–642. doi: 10.1016/j.ejrad.2008.12.006. [DOI] [PubMed] [Google Scholar]
- 149.Andreisek G, White LM, Yang Y, et al. Delayed gadolinium-enhanced MR imaging of articular cartilage: Three-dimensional T1 mapping with variable flip angles and B1 correction. Radiology. 2009;252(3):865–873. doi: 10.1148/radiol.2531081115. [DOI] [PubMed] [Google Scholar]
- 150.Studler U, White LM, Andreisek G, et al. Impact of motion on T1 mapping acquired with inversion recovery fast spin echo and rapid spoiled gradient recalled-echo pulse sequences for delayed gadolinium-enhanced MRI of cartilage (Dgemric) in volunteers. J Magn Reson Imaging. 2010;32:394–398. doi: 10.1002/jmri.22249. [DOI] [PubMed] [Google Scholar]
- 151.Siversson C, Tiderius C-J, Neuman P, et al. Repeatability of T1-quantification in dGEMRIC for three different acquisition techniques: two-dimensional inversion recovery, three-dimensional look locker, and three-dimensional variable flip angle. J Magn Reson Imaging. 2010;31:1203–1209. doi: 10.1002/jmri.22159. [DOI] [PubMed] [Google Scholar]
- 152.McKenzie CA, Williams A, Prasad PV, et al. Three-dimensional delayed gadolinium-enhanced MRI of cartilage (DGEMRIC) at 1.5T and 3.0T. J Magn Reson Imaging. 2006;24:928–933. doi: 10.1002/jmri.20689. [DOI] [PubMed] [Google Scholar]
- 153.Bellin MF, Van Der Molen AJ. Extracellular gadolinium-based contrast media: an overview. Eur J Radiol. 2008;66:160–167. doi: 10.1016/j.ejrad.2008.01.023. [DOI] [PubMed] [Google Scholar]
- 154.Idee JM, Port M, Medina C, et al. Possible involvement of gadolinium chelates in the pathophysiology of nephrogenic systemic fibrosis: a critical review. Toxicology. 2008;248:77–88. doi: 10.1016/j.tox.2008.03.012. [DOI] [PubMed] [Google Scholar]
- 155.Kallen AJ, Jhung MA, Cheng S, et al. Gadolinium-containing magnetic resonance imaging contrast and nephrogenic systemic fibrosis: a case-control study. Am J Kidney Dis. 2008;51:966–975. doi: 10.1053/j.ajkd.2007.12.036. [DOI] [PubMed] [Google Scholar]
- 156.Marckmann P, Skov L, Rossen K, et al. Nephrogenic systemic fibrosis: suspected causative role of gadodiamide used for contrast-enhanced magnetic resonance imaging. J Am Soc Nephrol. 2006;17:2359–2362. doi: 10.1681/ASN.2006060601. [DOI] [PubMed] [Google Scholar]
- 157.Nainani N, Panesar M. Nephrogenic systemic fibrosis. Am J Nephrol. 2008;29:1–9. doi: 10.1159/000149628. [DOI] [PubMed] [Google Scholar]
- 158.Wiginton CD, Kelly B, Oto A, et al. Gadolinium-based contrast exposure, nephrogenic systemic fibrosis, and gadolinium detection in tissue. AJR Am J Roentgenol. 2008;190:1060–1068. doi: 10.2214/AJR.07.2822. [DOI] [PubMed] [Google Scholar]
- 159.Li W, Scheidegger R, Wu Y, et al. Accuracy of T1 measurement with 3-D Look-Locker technique for DGEMRIC. J Magn Reson Imaging. 2008;27:678–682. doi: 10.1002/jmri.21244. [DOI] [PubMed] [Google Scholar]
- 160.Kimelman T, Vu A, Storey P, et al. Three-dimensional T1 mapping for dGEMRIC at 3.0T using the Look Locker method. Invest Radiol. 2006;41:198–203. doi: 10.1097/01.rli.0000195842.49255.ea. [DOI] [PubMed] [Google Scholar]
- 161.Gold GE, Chen CA, Koo S, et al. Recent advances in MRI of articular cartilage. AJR Am J Roentgenol. 2009;193:628–638. doi: 10.2214/AJR.09.3042. [DOI] [PMC free article] [PubMed] [Google Scholar]
- 162.Lehner KB, Rechl HP, Gmeinwieser JK, et al. Structure, function, and degeneration of bovine hyaline cartilage: assessment with MR imaging in vitro. Radiology. 1989;170:495–499. doi: 10.1148/radiology.170.2.2911674. [DOI] [PubMed] [Google Scholar]
- 163.Lusse S, Claassen H, Gehrke T, et al. Evaluation of water content by spatially resolved transverse relaxation times of human articular cartilage. Magn Reson Imaging. 2000;18:423–430. doi: 10.1016/s0730-725x(99)00144-7. [DOI] [PubMed] [Google Scholar]
- 164.Lusse S, Knauss R, Werner A, et al. Action of compression and cations on the proton and deuterium relaxation in cartilage. Magn Reson Med. 1995;33:483–489. doi: 10.1002/mrm.1910330405. [DOI] [PubMed] [Google Scholar]
- 165.Shapiro EM, Borthakur A, Kaufman JH, et al. Water distribution patterns inside bovine articular cartilage as visualized by 1H magnetic resonance imaging. Osteoarthritis Cartilage. 2001;9:533–538. doi: 10.1053/joca.2001.0428. [DOI] [PubMed] [Google Scholar]
- 166.Fragonas E, Mlynarik V, Jellus V, et al. Correlation between biochemical composition and magnetic resonance appearance of articular cartilage. Osteoarthritis Cartilage. 1998;6:24–32. doi: 10.1053/joca.1997.0089. [DOI] [PubMed] [Google Scholar]
- 167.Nieminen MT, Toyras J, Rieppo J, et al. Quantitative MR microscopy of enzymatically degraded articular cartilage. Magn Reson Med. 2000;43:676–681. doi: 10.1002/(sici)1522-2594(200005)43:5<676::aid-mrm9>3.0.co;2-x. [DOI] [PubMed] [Google Scholar]
- 168.Watrin A, Ruaud JP, Olivier PT, et al. T2 mapping of rat patellar cartilage. Radiology. 2001;219:395–402. doi: 10.1148/radiology.219.2.r01ma32395. [DOI] [PubMed] [Google Scholar]
- 169.Watrin-Pinzano A, Ruaud JP, Cheli Y, et al. T2 mapping: an efficient MR quantitative technique to evaluate spontaneous cartilage repair in rat patella. Osteoarthritis Cartilage. 2004;12:191–200. doi: 10.1016/j.joca.2003.10.010. [DOI] [PubMed] [Google Scholar]
- 170.Henkelman RM, Stanisz GJ, Kim JK, et al. Anisotropy of NMR properties of tissues. Magn Reson Med. 1994;32:592–601. doi: 10.1002/mrm.1910320508. [DOI] [PubMed] [Google Scholar]
- 171.Rubenstein JD, Kim JK, Morova-Protzner I, et al. Effects of collagen orientation on MR imaging characteristics of bovine articular cartilage. Radiology. 1993;188:219–226. doi: 10.1148/radiology.188.1.8511302. [DOI] [PubMed] [Google Scholar]
- 172.Grunder W, Wagner M, Werner A. MR-microscopic visualization of anisotropic internal cartilage structures using the magic angle technique. Magn Reson Med. 1998;39:376–382. doi: 10.1002/mrm.1910390307. [DOI] [PubMed] [Google Scholar]
- 173.Xia Y, Farquhar T, Burton-Wurster N, et al. Diffusion and relaxation mapping of cartilage-bone plugs and excised disks using microscopic magnetic resonance imaging. Magn Reson Med. 1994;31:273–282. doi: 10.1002/mrm.1910310306. [DOI] [PubMed] [Google Scholar]
- 174.Xia Y. Relaxation anisotropy in cartilage by NMR microscopy (muMRI) at 14-micron resolution. Magn Reson Med. 1998;39:941–949. doi: 10.1002/mrm.1910390612. [DOI] [PubMed] [Google Scholar]
- 175.Xia Y, Farquhar T, Burton-Wurster N, et al. Origin of cartilage laminae in MRI. J Magn Reson Imaging. 1997;7:887–894. doi: 10.1002/jmri.1880070518. [DOI] [PubMed] [Google Scholar]
- 176.Goodwin DW, Dunn JF. High-resolution magnetic resonance imaging of articular cartilage: correlation with histology and pathology. Top Magn Reson Imaging. 1998;9:337–347. [PubMed] [Google Scholar]
- 177.Mlynarik V, Degrassi A, Toffanin R, et al. A method for generating magnetic resonance microimaging T2 maps with low sensitivity to diffusion. Magn Reson Med. 1996;35:423–425. doi: 10.1002/mrm.1910350321. [DOI] [PubMed] [Google Scholar]
- 178.Kim DJ, Suh JS, Jeong EK, et al. Correlation of laminated MR appearance of articular cartilage with histology, ascertained by artificial landmarks on the cartilage. J Magn Reson Imaging. 1999;10:57–64. doi: 10.1002/(sici)1522-2586(199907)10:1<57::aid-jmri8>3.0.co;2-4. [DOI] [PubMed] [Google Scholar]
- 179.Xia Y. Heterogeneity of cartilage laminae in MR imaging. J Magn Reson Imaging. 2000;11:686–693. doi: 10.1002/1522-2586(200006)11:6<686::aid-jmri16>3.0.co;2-#. [DOI] [PubMed] [Google Scholar]
- 180.Nieminen MT, Rieppo J, Toyras J, et al. T2 relaxation reveals spatial collagen architecture in articular cartilage: a comparative quantitative MRI an polarized light microscopic study. Magn Reson Med. 2001;46:487–493. doi: 10.1002/mrm.1218. [DOI] [PubMed] [Google Scholar]
- 181.Xia Y, Moody JB, Alhadlaq H. Orientational dependence of T2 relaxation in articular cartilage: a microscopic MRI (microMRI) study. Magn Reson Med. 2002;48:460–469. doi: 10.1002/mrm.10216. [DOI] [PubMed] [Google Scholar]
- 182.Goodwin DW, Wadghiri YZ, Zhu H, et al. Macroscopic structure of articular cartilage of the tibial plateau: influence of a characteristic matrix architecture on MRI appearance. AJR Am J Roentgenol. 2004;182:311–318. doi: 10.2214/ajr.182.2.1820311. [DOI] [PubMed] [Google Scholar]
- 183.Konig H, Sauter R, Delmling M, et al. Cartilage disorders: a comparison of spin-echo, CHESS, and FLASH sequence MR images. Radiology. 1987;164:753–758. doi: 10.1148/radiology.164.3.3615875. [DOI] [PubMed] [Google Scholar]
- 184.Broderick L, Turner D, Renfrew D, et al. Severity of articular cartilage abnormality in patients with osteoarthritis: evaluation with fast spin-echo MR vs. arthroscopy. AJR Am J Roentgenol. 1994;162:99–103. doi: 10.2214/ajr.162.1.8273700. [DOI] [PubMed] [Google Scholar]
- 185.Peterfy CG. Imaging of the disease process. Curr Opin Rheumatol. 2002;14:590–596. doi: 10.1097/00002281-200209000-00020. [DOI] [PubMed] [Google Scholar]
- 186.Shinar H, Seo Y, Ikoma K, et al. Mapping of the fiber orientation in articular cartilage at rest and under pressure studied by 2H double quantum filtered MRI. Magn Reson Med. 2002;48:322–330. doi: 10.1002/mrm.10195. [DOI] [PubMed] [Google Scholar]
- 187.Keinan-Adamsky K, Shinar H, Navon G. The effect of detachment of the articular cartilage from its calcified zone on the cartilage microstructure, assessed by 2H-spectroscopic double quantum filtered MRI. J Orthop Res. 2005;23:109–117. doi: 10.1016/j.orthres.2004.06.005. [DOI] [PubMed] [Google Scholar]
- 188.Xia Y. Magic-angle effect in magnetic resonance imaging of articular cartilage: a review. Invest Radiol. 2000;35:602–621. doi: 10.1097/00004424-200010000-00007. [DOI] [PubMed] [Google Scholar]
- 189.Krasnosselskaia LV, Fullerton GD, Dodd SJ, et al. Water in tendon: orientational analysis of the free induction decay. Magn Reson Med. 2005;54:280–288. doi: 10.1002/mrm.20540. [DOI] [PubMed] [Google Scholar]
- 190.Bydder M, Rahal A, Fullerton GD, et al. The magic angle effect: a source of artifact, determinant of image contrast, and technique for imaging. J Magn Reson Imaging. 2007;25:290–300. doi: 10.1002/jmri.20850. [DOI] [PubMed] [Google Scholar]
- 191.Cameron IL, Hunter KE, Ord VA, et al. Relationships between ice crystal size, water content and proton NMR relaxation times in cells. Physiol Chem Phys Med NMR. 1985;17:371–386. [PubMed] [Google Scholar]
- 192.Xia Y. Averaged and depth-dependent anisotropy of articular cartilage by microscopic imaging. Semin Arthritis Rheum. 2008;37:317–327. doi: 10.1016/j.semarthrit.2007.07.001. [DOI] [PubMed] [Google Scholar]
- 193.Shirazi R, Shirazi-Adl A. Deep vertical collagen fibrils play a significant role in mechanics of articular cartilage. J Orthop Res. 2008;26:608–615. doi: 10.1002/jor.20537. [DOI] [PubMed] [Google Scholar]
- 194.Korhonen RK, Julkunen P, Wilson W, et al. Importance of collagen orientation and depth-dependent fixed charge densities of cartilage on mechanical behavior of chondrocytes. J Biomech Eng. 2008;130:021003. doi: 10.1115/1.2898725. [DOI] [PubMed] [Google Scholar]
- 195.Julkunen P, Korhonen RK, Nissi MJ, et al. Mechanical characterization of articular cartilage by combining magnetic resonance imaging and finite-element analysis--a potential functional imaging technique. Phys Med Biol. 2008;53:2425–2438. doi: 10.1088/0031-9155/53/9/014. [DOI] [PubMed] [Google Scholar]
- 196.Bae WC, Wong VW, Hwang J, et al. Wear-lines and split-lines of human patellar cartilage: relation to tensile biomechanical properties. Osteoarthrits Cartilage. 2008;16:841–845. doi: 10.1016/j.joca.2007.11.015. [DOI] [PMC free article] [PubMed] [Google Scholar]
- 197.Federico S, Herzog W. On the anisotropy and inhomogeneity of permeability in articular cartilage. Biomech Model Mechanobiol. 2007;7:367–378. doi: 10.1007/s10237-007-0091-0. [DOI] [PubMed] [Google Scholar]
- 198.Alhadlaq HA, Xia Y. The structural adaptations in compressed articular cartilage by microscopic MRI (microMRI) T(2) anisotropy. Osteoarthritis Cartilage. 2004;12:887–894. doi: 10.1016/j.joca.2004.07.006. [DOI] [PubMed] [Google Scholar]
- 199.Xia Y. Averaged properties of articular cartilage from multidisciplinary microscopic imaging study. Conf Proc IEEE Eng Med Biol Soc. 2005;3:3161–3164. doi: 10.1109/IEMBS.2005.1617146. [DOI] [PubMed] [Google Scholar]
- 200.Mosher TJ, Dardzinski BJ. Cartilage MRI T2 relaxation time mapping: overview and applications. Semin Musculoskelet Radiol. 2004;8:355–368. doi: 10.1055/s-2004-861764. [DOI] [PubMed] [Google Scholar]
- 201.Bi X, Yang X, Bostrom MP, et al. Fourier transform infrared imaging and MR microscopy studies detect compositional and structural changes in cartilage in a rabbit model of osteoarthritis. Anal Bioanal Chem. 2007;387:1601–1612. doi: 10.1007/s00216-006-0910-7. [DOI] [PMC free article] [PubMed] [Google Scholar]
- 202.Mow VC, Holmes MH, Lai WM. Fluid transport and mechanical properties of articular cartilage: a review. J Biomech. 1984;17:377–394. doi: 10.1016/0021-9290(84)90031-9. [DOI] [PubMed] [Google Scholar]
- 203.Smith HE, Mosher TJ, Dardzinski BJ, et al. Spatial variation in cartilage T2 of the knee. J Magn Reson Imaging. 2001;14:50–55. doi: 10.1002/jmri.1150. [DOI] [PubMed] [Google Scholar]
- 204.Xia Y. Resolution “scaling law” in MRI of articular cartilage. Osteoarthritis Cartilage. 2007;15:363–365. doi: 10.1016/j.joca.2006.12.004. [DOI] [PMC free article] [PubMed] [Google Scholar]
- 205.Van Breuseghem I, Bosmans HT, Elst LV, et al. T2 mapping of human femorotibial cartilage with turbo mixed MR imaging at 1.5 T: feasibility. Radiology. 2004;233:609–614. doi: 10.1148/radiol.2332030891. [DOI] [PubMed] [Google Scholar]
- 206.Quaia E, Toffanin R, Guglielmi G, et al. Fast T2 mapping of the patellar articular cartilage with gradient and spin-echo magnetic resonance imaging at 1.5 T: validation and initial clinical experience in patients with osteoarthritis. Skeletal Radiol. 2008;37:511–517. doi: 10.1007/s00256-008-0478-8. [DOI] [PubMed] [Google Scholar]
- 207.Bittersohl B, Hosalkar HS, Hughes T, et al. Feasibility of T2* mapping for the evaluation of hip joint cartilage at 1.5T using a three-dimensional (3D), gradient-echo (GRE) sequence: a prospective study. Magn Reson Med. 2009;62(4):896–901. doi: 10.1002/mrm.22096. [DOI] [PubMed] [Google Scholar]
- 208.Williams A, Qian A, Bear D, et al. Assessing degeneration of human articular cartilage with ultra-short echo time (UTE) T2* mapping. Osteoarthritis Cartilage. 2010;18(4):539–546. doi: 10.1016/j.joca.2010.02.001. [DOI] [PMC free article] [PubMed] [Google Scholar]
- 209.David-Vaudey E, Ghosh S, Ries M, et al. T2 relaxation time measurements in osteoarthritis. Magn Reson Imaging. 2004;22:673–682. doi: 10.1016/j.mri.2004.01.071. [DOI] [PubMed] [Google Scholar]
- 210.Gahunia HK, Lemaire C, Cross AR, et al. Osteoarthritis in rhesus macaques: assessment of cartilage matrix quality by quantitative magnetic resonance imaging. Agents Actions Suppl. 1993;39:255–259. doi: 10.1007/978-3-0348-7442-7_31. [DOI] [PubMed] [Google Scholar]
- 211.Gahunia HK, Babyn P, Lemaire C, et al. Osteoarthritis staging: comparison between magnetic resonance imaging, gross pathology and histopathology in the rhesus macaque. Osteoarthritis Cartilage. 1995;3:169–180. doi: 10.1016/s1063-4584(05)80051-2. [DOI] [PubMed] [Google Scholar]
- 212.Spandonis Y, Heese FP, Hall LD. High resolution MRI relaxation measurements of water in the articular cartilage of the meniscectomized rat knee at 4.7T. Magn Reson Imaging. 2004;22:943–951. doi: 10.1016/j.mri.2004.02.010. [DOI] [PubMed] [Google Scholar]
- 213.Watrin-Pinzano A, Ruaud JP, Cheli Y, et al. Evaluation of cartilage repair tissue after biomaterial implantation in rat patella using T2 mapping. Magma. 2004;17:219–228. doi: 10.1007/s10334-004-0071-7. [DOI] [PubMed] [Google Scholar]
- 214.Mosher TJ, Smith H, Dardzinski B, et al. MR imaging and T2 mapping of femoral cartilage: in vivo determination of the magic angle effect. AJR Am J Roentgenol. 2001;177:665–669. doi: 10.2214/ajr.177.3.1770665. [DOI] [PubMed] [Google Scholar]
- 215.Dardzinski BJ, Laor T, Schmithorst VJ, et al. Mapping T2 relaxation time in the pediatric knee: feasibility with a clinical 1.5-T MR imaging system. Radiology. 2002;225:233–239. doi: 10.1148/radiol.2251011461. [DOI] [PubMed] [Google Scholar]
- 216.Dardzinski BJ, Mosher TJ, Li S, et al. Spatial variation of T2 in human articular cartilage. Radiology. 1997;205:546–550. doi: 10.1148/radiology.205.2.9356643. [DOI] [PubMed] [Google Scholar]
- 217.Yao W, Qu N, Lu Z, et al. The application of T1 and T2 relaxation time and magnetization transfer ratios to the early diagnosis of patellar cartilage osteoarthritis. Skeletal Radiol. 2009;38:1055–1062. doi: 10.1007/s00256-009-0769-8. [DOI] [PubMed] [Google Scholar]
- 219.Watanabe A, Boesch C, Siebenrock K, et al. T2 mapping of hip articular cartilage in healthy volunteers at 3T: a study of topographic variation. J Magn Reson Imaging. 2007;26:165–171. doi: 10.1002/jmri.21014. [DOI] [PubMed] [Google Scholar]
- 220.Nishii T, Tanaka H, Sugano N, et al. Evaluation of cartilage matrix disorders by T2 relaxation time in patients with hip dysplasia. Osteoarthritis Cartilage. 2008;16:227–233. doi: 10.1016/j.joca.2007.06.003. [DOI] [PubMed] [Google Scholar]
- 221.Welsch GH, Mamisch TC, Weber M, et al. High-resolution morphological and biochemical imaging of articular cartilage of the ankle joint at 3.0T using a new dedicated phased array coil: in vivo reproducibility study. Skeletal Radiol. 2008;37:519–526. doi: 10.1007/s00256-008-0474-z. [DOI] [PubMed] [Google Scholar]
- 222.Lazovic-Stojkovic J, Mosher TJ, Smith HE, et al. Interphalangeal joint cartilage: high-spatial-resolution in vivo MR T2 mapping---a feasibility study. Radiology. 2004;233:292–296. doi: 10.1148/radiol.2331031791. [DOI] [PubMed] [Google Scholar]
- 223.Mosher TJ, Dardzinski BJ, Smith MB. Human articular cartilage: influence of aging and early symptomatic degeneration on the spatial variation of T2-preliminary findings at 3 T. Radiology. 2000;214:259–266. doi: 10.1148/radiology.214.1.r00ja15259. [DOI] [PubMed] [Google Scholar]
- 224.Dray N, Williams A, Prasad PV, et al. T2 in an OA population: Metrics for reporting data? [abstract 1995]. Proc Ann Meeting Int Soc Magn Resonance Med (ISMRM); Miami, FL. 2005. [Google Scholar]
- 225.Dunn TC, Lu Y, Jin H, et al. T2 relaxation time of cartilage at MR imaging: comparison with severity of knee osteoarthritis. Radiology. 2004;232:592–598. doi: 10.1148/radiol.2322030976. [DOI] [PMC free article] [PubMed] [Google Scholar]
- 226.Blumenkrantz G, Dunn TC, Carballido-Gamio J, et al. Spatial heterogeneity of cartilage T2 in osteoarthritic patients. OARSI; Boston, MA. 2005. [Google Scholar]
- 227.Goebel JC, Watrin-Pinzano A, Bettembourg-Brault I, et al. Age-related quantitative MRI changes in healthy cartilage: preliminary results. Biorheology. 2006;43:547–551. [PubMed] [Google Scholar]
- 228.Mosher TJ, Liu Y, Yang QX, et al. Age dependency of cartilage magnetic resonance imaging T2 relaxation times in asymptomatic women. Arthritis Rheum. 2004;50:2820–2828. doi: 10.1002/art.20473. [DOI] [PubMed] [Google Scholar]
- 229.Mosher TJ, Collins CM, Smith HE, et al. Effect of gender on in vivo cartilage magnetic resonance imaging T2 mapping. J Magn Reson Imaging. 2004;19:323–328. doi: 10.1002/jmri.20013. [DOI] [PubMed] [Google Scholar]
- 230.Stahl R, Blumenkrantz G, Carballido-Gamio J, et al. MRI-derived T2 relaxation times and cartilage morphometry of the tibio-femoral joint in subjects with and without osteoarthritis during a 1-year follow-up. Osteoarthritis Cartilage. 2007;15:1225–1234. doi: 10.1016/j.joca.2007.04.018. [DOI] [PubMed] [Google Scholar]
- 231.Blumenkrantz G, Lindsey CT, Dunn TC, et al. A pilot, two-year longitudinal study of the interrelationship between trabecular bone and articular cartilage in the osteoarthritic knee. Osteoarthritis Cartilage. 2004;12:997–1005. doi: 10.1016/j.joca.2004.09.001. [DOI] [PubMed] [Google Scholar]
- 232.Blumenkrantz G, Dunn TC, Ries MD, et al. Cartilage T2 as a marker of progression of osteoarthritis.[abstract 2004]. Proc Ann Meet Am Coll Rheumatol; San Antonio, TX. 2004. [Google Scholar]
- 233.Apprich S, Welsch GH, Mamisch TC, et al. Detection of degenerative cartilage disease: comparison of high-resolution morphological MR and quantitative T2 mapping at 3.0 Tesla. Osteoarthritis Cartilage. 2010 doi: 10.1016/j.joca.2010.06.002. [DOI] [PubMed] [Google Scholar]
- 234.Shiomi T, Nishii T, Myoui A, et al. Influence of knee positions on T2, T2*, and DGEMRIC mapping in porcine knee cartilage. Magn Reson Med. 2010 doi: 10.1002/mrm.22469. [DOI] [PubMed] [Google Scholar]
- 235.Friedrich KM, Shepard T, Chang G, et al. Does joint alignment affect the T2 values of cartilage in patients with knee osteoarthritis? Eur Radiol. 2010;20:1532–1538. doi: 10.1007/s00330-009-1689-7. [DOI] [PMC free article] [PubMed] [Google Scholar]
- 236.Grunder W, Kanowski M, Wagner M, et al. Visualization of pressure distribution within loaded joint cartilage by application of angle-sensitive NMR microscopy. Magn Reson Med. 2000;43:884–891. doi: 10.1002/1522-2594(200006)43:6<884::aid-mrm15>3.0.co;2-u. [DOI] [PubMed] [Google Scholar]
- 237.Alhadlaq HA, Xia Y. Modifications of orientational dependence of microscopic magnetic resonance imaging T(2) anisotropy in compressed articular cartilage. J Magn Reson Imaging. 2005;22:665–673. doi: 10.1002/jmri.20418. [DOI] [PubMed] [Google Scholar]
- 238.Nag D, Liney GP, Gillespie P, et al. Quantification of T(2) relaxation changes in articular cartilage with in situ mechanical loading of the knee. J Magn Reson Imaging. 2004;19:317–322. doi: 10.1002/jmri.20000. [DOI] [PubMed] [Google Scholar]
- 239.Stehling C, Liebl H, Krug R, et al. Patellar cartilage: T2 values and morphologic abnormalities at 3.0-T MR imaging in relation to physical activity in asymptomatic subjects from the Osteoarthritis Initiative. Radiology. 2010;254(2):509–520. doi: 10.1148/radiol.09090596. [DOI] [PMC free article] [PubMed] [Google Scholar]
- 240.Mosher TJ, Liu Y, Torok CM. Functional cartilage MRI T2 mapping: evaluating the effect of age and training on knee cartilage response to running. Osteoarthritis Cartilage. 2010;18:358–364. doi: 10.1016/j.joca.2009.11.011. [DOI] [PMC free article] [PubMed] [Google Scholar]
- 241.Mosher TJ, Smith HE, Collins C, et al. Change in knee cartilage T2 at MR imaging after running: a feasibility study. Radiology. 2005;234:245–249. doi: 10.1148/radiol.2341040041. [DOI] [PubMed] [Google Scholar]
- 242.Welsch GH, Mamisch TC, Domayer SE, et al. Cartilage T2 assessment at 3-T MR imaging: in vivo differentiation of normal hyaline cartilage from reparative tissue after two cartilage repair procedures---initial experience. Radiology. 2008;247:154–161. doi: 10.1148/radiol.2471070688. [DOI] [PubMed] [Google Scholar]
- 243.Domayer SE, Kutscha-Lissberg F, Welsch G, et al. T2 mapping in the knee after microfracture at 3.0T: correlation of global T2 values and clinical outcome---preliminary results. Osteoarthritis Cartilage. 2008;16:903–908. doi: 10.1016/j.joca.2007.11.014. [DOI] [PubMed] [Google Scholar]
- 244.Trattnig S, Mamisch TC, Welsch GH, et al. Quantitative T2 mapping of matrix-associated autologous chondrocyte transplantation at 3 Tesla: an in vivo cross-sectional study. Invest Radiol. 2007;42:442–448. doi: 10.1097/01.rli.0000262088.67368.49. [DOI] [PubMed] [Google Scholar]
- 245.Trattnig S, Millington SA, Szomolanyi P, et al. MR imaging of osteochondral grafts and autologous chondrocyte implantation. Eur Radiol. 2007;17:103–118. doi: 10.1007/s00330-006-0333-z. [DOI] [PMC free article] [PubMed] [Google Scholar]
- 246.White LM, Sussman MS, Hurtig M, et al. Cartilage T2 assessment: differentiation of normal hyaline cartilage and reparative tissue after arthroscopic cartilage repair in equine subjects. Radiology. 2006;241:407–414. doi: 10.1148/radiol.2412051750. [DOI] [PubMed] [Google Scholar]
- 247.Kangarlu A, Gahunia HK. Magnetic resonance imaging characterization of osteochondral defect repair in a goat model at 8T. Osteoarthritis Cartilage. 2006;14:52–62. doi: 10.1016/j.joca.2005.08.006. [DOI] [PubMed] [Google Scholar]
- 248.Welsch GH, Trattnig S, Hughes T, et al. T2 and T2* mapping in patients after matrix-associated autologous chondrocyte transplantation: initial results on clinical use with 3.0-Tesla MRI. Eur Radiol. 2010;20:1515–1523. doi: 10.1007/s00330-009-1669-y. [DOI] [PubMed] [Google Scholar]
- 249.Mamisch TC, Trattnig S, Quirbach S, et al. Quantitative T2 mapping of knee cartilage: differentiation of healthy control cartilage and cartilage repair tissue in the knee with unloading—intial results. Radiology. 2010;254(3):818–826. doi: 10.1148/radiol.09090335. [DOI] [PubMed] [Google Scholar]
- 250.Quirbach S, Trattnig S, Marlovits S, et al. Initial results of in vivo high-resolution morphological and biochemical cartilage imaging of patients after matrix-associated autologous chondrocyte transplantation (MACT) of the ankle. Skeletal Radiol. 2009;38(3):751–760. doi: 10.1007/s00256-009-0682-1. [DOI] [PubMed] [Google Scholar]
- 251.Welsch GH, Trattnig S, Domayer S, et al. Multimodal approach in the use of clinical scoring, morphological MRI and biochemical T2-mapping and diffusion-weighted imaging in their ability to assess differences between cartilage repair tissue after microfracture therapy and matrix-associated autologous chondrocyte transplantation: a pilot study. Osteoarthritis Cartilage. 2009;17(9):1219–1227. doi: 10.1016/j.joca.2009.03.018. [DOI] [PubMed] [Google Scholar]
- 252.Robson MD, Gatehouse PD, Bydder M, et al. Magnetic resonance: an introduction to ultrashort TE (UTE) imaging. J Comput Assist Tomogr. 2003;27:825–846. doi: 10.1097/00004728-200311000-00001. [DOI] [PubMed] [Google Scholar]
- 253.Bae WC, Dwek JR, Znamirowski R, et al. Ultrashort echo time MR imaging of osteochondral junction of the knee at 3T: identification of anatomic structures contributing to signal intensity. Radiology. 2010;254(3):837–845. doi: 10.1148/radiol.09081743. [DOI] [PMC free article] [PubMed] [Google Scholar]
- 254.Bydder M, Du J, Takahashi AM, et al. Chemical shift artifact in center-out radial sampling: a potential pitfall in clinical diagnosis [abst]. Proceedings of the Fifteenth Meeting of the International Society for Magnetic Resonance in Medicine; Berkeley, Calif: International Society for Magnetic Resonance in Medicine; 2007. p. 1811. [Google Scholar]
- 255.Gatehouse PD, Thomas RW, Robson MD, et al. Magnetic resonance imaging of the knee with ultrashort TE pulse sequences. Magn Reson Imaging. 2004;22:1061–1067. doi: 10.1016/j.mri.2004.08.018. [DOI] [PubMed] [Google Scholar]
- 256.Gatehouse PD, Bydder GM. Magnetic resonance imaging of short T2 components in tissue. Clin Radiol. 2003;58(1):1–19. doi: 10.1053/crad.2003.1157. [DOI] [PubMed] [Google Scholar]
- 257.Gatehouse PD, He T, Puri BK, et al. Contrast-enhanced MRI of the menisci of the knee using ultrashort echo time (UTE) pulse sequences: imaging of the red and white zones. Br J Radiol. 2004;77:641–647. doi: 10.1259/bjr/31774546. [DOI] [PubMed] [Google Scholar]
- 258.Gold GE, Thedens DR, Pauly JM, et al. MR imaging of articular cartilage of the knee: new methods using ultrashort TEs. AJR Am J Roentgenol. 1998;170:1223–1226. doi: 10.2214/ajr.170.5.9574589. [DOI] [PubMed] [Google Scholar]
- 259.Filho GH, Du J, Pak BC, et al. Quantitative characterization of the Achilles tendon in cadaveric specimens: T1 and T2* measurements using ultrashort-TE MRI at 3T. AJR Am J Roentgenol. 2009;192:W117–W124. doi: 10.2214/AJR.07.3990. [DOI] [PubMed] [Google Scholar]
- 260.Lyons TJ, Stoddart RW, McClure SF, et al. The tidemark of the chondroosseous junction of the normal human knee joint. J Mol Histol. 2005;36(3):207–215. doi: 10.1007/s10735-005-3283-x. [DOI] [PubMed] [Google Scholar]
- 261.Ferguson VL, Bushby AJ, Boyde A. Nanomechanical properties and mineral concentration in articular calcified cartilage and subchondral bone. J Anat. 2003;203:191–199. doi: 10.1046/j.1469-7580.2003.00193.x. [DOI] [PMC free article] [PubMed] [Google Scholar]
- 262.Li BH, Marshall D, Roe M, et al. The electron microscope appearance of the subchondral bone plate in the human femoral head in osteoarthritis and osteoporosis. J Anat. 1999;195:101–110. doi: 10.1046/j.1469-7580.1999.19510101.x. [DOI] [PMC free article] [PubMed] [Google Scholar]
- 263.Burr DB. Anatomy and physiology of the mineralized tissues: role in the pathogenesis of osteoarthritis. Osteoarthritis Cartilage. 2004;12:S20–30. doi: 10.1016/j.joca.2003.09.016. [DOI] [PubMed] [Google Scholar]
- 264.Martel-Pelletier J. Pathophysiology of osteoarthritis. Osteoarthritis Cartilage. 2004;12:S31–33. doi: 10.1016/j.joca.2003.10.002. [DOI] [PubMed] [Google Scholar]
- 265.Muir P, McCarthy J, Radtke CL, et al. Role of enchondral ossification of articular cartilage and functional adaptation of the subchondral plate in the development of fatigue microcracking of joints. Bone. 2006;38:342–349. doi: 10.1016/j.bone.2005.08.020. [DOI] [PubMed] [Google Scholar]
- 266.Squires GR, Okouneff S, Ionescu M, et al. The pathobiology of focal lesion development in aging human articular cartilage and molecular matrix changes characteristic of osteoarthritis. Arthritis Rheum. 2003;48:1261–1270. doi: 10.1002/art.10976. [DOI] [PubMed] [Google Scholar]
- 267.Donohue JM, Buss D, Oegema TR, et al. The effects of indirect blunt trauma on adult canine articular cartilage. J Bone Joint Surg Am. 1983;65:948–957. [PubMed] [Google Scholar]
- 268.Wansapura JP, Daniel BL, Pauly J, et al. Temperature mapping of frozen tissue using eddy current compensated half excitation RF pulses. Magn Reson Med. 2001;46(5):985–992. doi: 10.1002/mrm.1285. [DOI] [PubMed] [Google Scholar]
- 269.Noll DC, Pauly JM, Meyer CH, et al. Deblurring for non-2D Fourier transform magnetic resonance imaging. Magn Reson Med. 1992;25(2):319–333. doi: 10.1002/mrm.1910250210. [DOI] [PubMed] [Google Scholar]
- 270.Lu A, Daniel BL, Pauly KB. Improved slice excitation for ultrashort TE imaging with B0 and linear eddy current correction [abstr]. Proceedings of the Fourteenth Meeting of the International Society for Magnetic Resonance in Medicine; Berkeley, Calif: International Society for Magnetic Resonance in Medicine; 2006. p. 2381. [Google Scholar]
- 271.Hwang J, Bae WC, Shieu W, et al. Increased hydraulic conductance of human articular cartilage and subchondral bone plate with progression of osteoarthritis. Arthritis Rheum. 2008;58(12):3831–3842. doi: 10.1002/art.24069. [DOI] [PMC free article] [PubMed] [Google Scholar]
- 272.Frisbie DD, Morisset S, Ho CP, et al. Effects of calcified cartilage on healing of chondral defects treated with microfracture in horses. Am J Sports Med. 2006;34(11):1824–1831. doi: 10.1177/0363546506289882. [DOI] [PubMed] [Google Scholar]
- 273.Koskinen SK, Komu ME. Low-field strength magnetization transfer contrast imaging of the patellar cartilage. Acta Radiol. 1993;34:124–126. [PubMed] [Google Scholar]
- 274.Regatte RR, Akella SV, Reddy R. Depth-dependent proton magnetization transfer in articular cartilage. J Magn Reson Imaging. 2005;22:318–323. doi: 10.1002/jmri.20377. [DOI] [PubMed] [Google Scholar]
- 275.Yao L, Gentili A, Thomas A. Incidental magnetization transfer contrast in fast spin-echo imaging of cartilage. J Magn Reson Imaging. 1996;6:180–184. doi: 10.1002/jmri.1880060132. [DOI] [PubMed] [Google Scholar]
- 276.Dixon WT, Engels H, Castillo M, et al. Incidental magnetization transfer contrast in standard multislice imaging. Magn Reson Imaging. 1990;8:417–422. doi: 10.1016/0730-725x(90)90050-c. [DOI] [PubMed] [Google Scholar]
- 277.Maier CF, Tan SG, Hariharan H, et al. T2 quantitation of articular cartilage at 1.5T. J Magn Reson Imaging. 2003;17:358–364. doi: 10.1002/jmri.10263. [DOI] [PubMed] [Google Scholar]
- 278.Watanabe A, Boesch C, Obata T, et al. Effect of multislice acquisition on T1 and T2 measurements of articular cartilage at 3T. J Magn Reson Imaging. 2007;26:109–117. doi: 10.1002/jmri.20962. [DOI] [PubMed] [Google Scholar]
- 279.Martirosian P, Boss A, Deimling M, et al. Systematic variation of off-resonance prepulses for clinical magnetization transfer contrast imaging at 0.2, 1.5, and 3.0 Tesla. Invest Radiol. 2008;43:16–26. doi: 10.1097/RLI.0b013e3181559949. [DOI] [PubMed] [Google Scholar]
- 280.Vahlensieck M, Traber F, Giesecke J, et al. Magnetization transfer contrast (MTC): optimizing off-resonance and on-resonance frequency MTC methods at 0.5 and 1.5T. Biomed Tech (Berl) 2001;46:10–17. doi: 10.1515/bmte.2001.46.1-2.10. [DOI] [PubMed] [Google Scholar]
- 281.Peterfy CG, van Dijke CF, Janzen DL, et al. Quantification of articular cartilage in the knee with pulsed saturation transfer subtraction and fat-suppressed MR imaging: optimization and validation. Radiology. 1994;192:485–491. doi: 10.1148/radiology.192.2.8029420. [DOI] [PubMed] [Google Scholar]
- 282.Hohe J, Faber S, Stammberger T, et al. A technique for 3D in vivo quantification of proton density and magnetization transfer coefficients of knee joint cartilage. Osteoarthritis Cartilage. 2000;8:426–433. doi: 10.1053/joca.1999.0318. [DOI] [PubMed] [Google Scholar]
- 283.Vahlensieck M, Dombrowski F, Leutner C, et al. Magnetization transfer contrast (MTC) and MTC-subtraction: enhancement of cartilage lesions and intracartilaginous degeneration in vitro. Skeletal Radiol. 1994;23:535–539. doi: 10.1007/BF00223085. [DOI] [PubMed] [Google Scholar]
- 284.Palmieri F, De Keyzer F, Maes F, et al. Magnetization transfer analysis of cartilage repair tissue: a preliminary study. Skeletal Radiol. 2006;35:903–908. doi: 10.1007/s00256-006-0146-9. [DOI] [PubMed] [Google Scholar]
- 285.Kim DK, Ceckler TL, Hascall VC, et al. Analysis of water-macromolecule proton magnetization transfer in articular cartilage. Magn Reson Med. 1993;29:211–215. doi: 10.1002/mrm.1910290209. [DOI] [PubMed] [Google Scholar]
- 286.Lattanzio PJ, Marshall KW, Damyanovich AZ, et al. Macromolecule and water magnetization transfer in articular cartilage. Magn Reson Med. 2000;44:840–851. doi: 10.1002/1522-2594(200012)44:6<840::aid-mrm4>3.0.co;2-k. [DOI] [PubMed] [Google Scholar]
- 287.Seo GS, Aoki J, Moriya H, et al. Hyaline cartilage: in vivo and in vitro assessment with magnetization transfer imaging. Radiology. 1996;201:525–530. doi: 10.1148/radiology.201.2.8888253. [DOI] [PubMed] [Google Scholar]
- 288.Toffanin R, Mlynarik V, Russo S, et al. Proteoglycan depletion and magnetic resonance parameters of articular cartilage. Arch Biochem Biophys. 2001;390:235–242. doi: 10.1006/abbi.2001.2338. [DOI] [PubMed] [Google Scholar]
- 289.Potter K, Butler JJ, Horton WE, et al. Response of engineered cartilage tissue to biochemical agents as studied by proton magnetic resonance microscopy. Arthritis Rheum. 2000;43:1580–1590. doi: 10.1002/1529-0131(200007)43:7<1580::AID-ANR23>3.0.CO;2-G. [DOI] [PubMed] [Google Scholar]
- 290.Li W, Hong L, Hu L, et al. Magnetization transfer imaging provides a quantitative measure of chondrogenic differentiation and tissue development. Tissue Eng Part C: Methods. 2010 doi: 10.1089/ten.tec.2009.0777. [DOI] [PMC free article] [PubMed] [Google Scholar]
- 291.Laurent D, O’Byrne E, Wasvary J, et al. In vivo MRI of cartilage pathogenesis in surgical models of osteoarthritis. Skeletal Radiol. 2006;35:555–564. doi: 10.1007/s00256-006-0133-1. [DOI] [PubMed] [Google Scholar]
- 292.Laurent D, Wasvary J, O’Byrne E, et al. In vivo qualitative assessments of articular cartilage in the rabbit knee with high-resolution MRI at 3T. Magn Reson Med. 2003;50:541–549. doi: 10.1002/mrm.10566. [DOI] [PubMed] [Google Scholar]
- 293.Laurent D, Wasvary J, Yin J, et al. Quantitative and qualitative assessment of articular cartilage in the goat knee with magnetization transfer imaging. Magn Reson Imaging. 2001;19:1279–1286. doi: 10.1016/s0730-725x(01)00433-7. [DOI] [PubMed] [Google Scholar]
- 294.Wolff SD, Chesnick S, Frank JA, et al. Magnetization transfer contrast: MR imaging of the knee. Radiology. 1991;179:623–628. doi: 10.1148/radiology.179.3.2027963. [DOI] [PubMed] [Google Scholar]
- 295.Niitsu M, Hirohata H, Yoshioka H, et al. Magnetization transfer contrast on gradient echo MR imaging of the temporomandibular joint. Acta Radiol. 1995;36:295–299. [PubMed] [Google Scholar]
- 296.Peterfy CG, Majumdar S, Lang P, et al. MR imaging of the arthritic knee: improved discrimination of cartilage, synovium, and effusion with pulsed saturation transfer and fat-suppressed T1-weighted sequences. Radiology. 1994;191:413–419. doi: 10.1148/radiology.191.2.8153315. [DOI] [PubMed] [Google Scholar]
- 297.Mori R, Ochi M, Sakai Y, et al. Clinical significance of magnetic resonance imaging (MRI) for focal chondral lesions. Magn Reson Imaging. 1999;17:1135–1140. doi: 10.1016/s0730-725x(99)00033-8. [DOI] [PubMed] [Google Scholar]
- 298.Welsch GH, Trattnig S, Scheffler K, et al. Magnetization transfer contrast and T2 mapping in the evaluation of cartilage repair tissue with 3T MRI. J Magn Reson Imaging. 2008;28(4):979–986. doi: 10.1002/jmri.21516. [DOI] [PubMed] [Google Scholar]
- 299.Kneeland JB. MRI probes biophysical structure of cartilage. Diagn Imaging (San Franc) 1996;18:36–40. [PubMed] [Google Scholar]
- 300.Butts K, Pauly J, de Crespigny A, et al. Isotropic diffusion-weighted and spiral-navigated interleaved EPI for routine imaging of acute stroke. Magn Reson Med. 1997;38:741–749. doi: 10.1002/mrm.1910380510. [DOI] [PubMed] [Google Scholar]
- 301.Xia Y, Farquhar T, Burton-Wurster N, et al. Self-diffusion monitors degraded cartilage. Arch Biochem Biophys. 1995;323:323–328. doi: 10.1006/abbi.1995.9958. [DOI] [PubMed] [Google Scholar]
- 302.Mamisch TC, Menzel MI, Welsch GH, et al. Steady-state diffusion imaging for MR in-vivo evaluation of reparative cartilage after matrix-associated autologous chondrocyte transplantation at 3 tesla—preliminary results. Eur J Radiol. 2008;65(1):72–79. doi: 10.1016/j.ejrad.2007.09.015. [DOI] [PubMed] [Google Scholar]
- 303.Friedrich KM, Mamisch TC, Plank C, et al. Diffusion-weighted imaging for the follow-up of patients after matrix-associated autologous chondrocyte transplantation. Eur J Radiol. 2010;73(3):622–628. doi: 10.1016/j.ejrad.2008.12.017. [DOI] [PubMed] [Google Scholar]


