

Abstract
Mitochondrial DNA (mtDNA) depletion syndrome (MDS), an autosomal recessive condition, is characterized by variable organ involvement with decreased mtDNA copy number and activities of respiratory chain enzymes in affected tissues. MtDNA depletion has been associated with mutations in nine autosomal genes, including thymidine kinase (TK2), which encodes a ubiquitous mitochondrial protein. To study the pathogenesis of TK2-deficiency, we generated mice harboring an H126N Tk2 mutation. Homozygous Tk2 mutant (Tk2−/−) mice developed rapidly progressive weakness after age 10 days and died between ages 2 and 3 weeks. Tk2−/− animals showed Tk2 deficiency, unbalanced dNTP pools, mtDNA depletion and defects of respiratory chain enzymes containing mtDNA-encoded subunits that were most prominent in the central nervous system. Histopathology revealed an encephalomyelopathy with prominent vacuolar changes in the anterior horn of the spinal cord. The H126N TK2 mouse is the first knock-in animal model of human MDS and demonstrates that the severity of TK2 deficiency in tissues may determine the organ-specific phenotype.
INTRODUCTION
By virtue of containing its own DNA, the mitochondrion is a unique mammalian organelle. Mitochondrial DNA (mtDNA) is present in 103–104 copies per cell and encodes 37 genes required for mitochondrial protein synthesis and respiratory chain enzymes (1). Maintenance of this genome is under the control of nuclear DNA (nDNA) genes, which, when mutated can cause depletion or multiple deletions of mtDNA (2–5). mtDNA depletion syndrome (MDS) encompasses a clinically heterogeneous group of diseases characterized by severe reductions in mtDNA copy number (2). Primary mtDNA depletion is inherited as an autosomal recessive trait and may affect single organs, characteristically muscle or liver, or multiple tissues.
In contrast to nDNA synthesis, which is linked to cell cycle, mtDNA replication is constitutive and consequently requires a constant supply of deoxynucleoside triphosphates (dNTPs) (6,7). In post-mitotic cells, the mitochondrial nucleotide salvage pathway is a major source of dNTPs and requires thymidine kinase 2 (TK2), encoded by TK2, to phosphorylate pyrimidine nucleosides and deoxyguanosine kinase (dGK), encoded by DGUOK, for phosphorylation of purine nucleosides. Both TK2 and dGK are encoded in nDNA and targeted to mitochondria. Mutations in either TK2 or dGK impair the mitochondrial nucleotide salvage pathway leading to mtDNA depletion. TK2 mutations have been associated with severe infantile myopathy, a milder myopathy with later onset and longer survival, rigid spine syndrome and spinal muscular atrophy (SMA)-like motor neuron disease while DGUOK mutations cause hepatocerebral disease (8–12). The tissue-specificity of MDS is not well-understood. It has been proposed that muscle is vulnerable to TK2 deficiency because of low basal expression of TK2 in this tissue (13,14); however, this hypothesis fails to account for the central nervous system (CNS) involvement in patients with SMA-like disorders. To elucidate the tissue-specific effects of TK2 deficiency, we produced and characterized a Tk2 mutant mouse.
RESULTS
We generated Tk2 mutant mice using homologous recombination to introduce into mouse embryonic stem (ES) cells an H126N (c.378–379CG>AA) mutation, which is homologous to the human H121N TK2 mutation (10) (Supplementary Material, Fig. S1). Heterozygous H126N Tk2 mice (Tk2+/−) did not show an overt phenotype; equal numbers of male and female mice were born and grew and survived normally compared to wild-type littermates (Fig. 1A). Mating of Tk2+/− mice produced the expected mendelian distribution of wild-type Tk2+/+, Tk2+/− and homozygous Tk2 mutant mice (Tk2−/−) (22:58:25). Tk2−/− pups had normal birth weights, sex distribution and early growth; however, after post-natal day 10, the homozygous mutant animals showed growth deceleration compared to their Tk2+/+ and Tk2+/− littermates (Fig. 1A), had reduced spontaneous activity, generalized coarse tremor and severely impaired gait (Supplementary Material, Movie S1) and rapidly developed weakness causing death or prompting sacrifice of animals due to distress at about 14 days of life (Fig. 1B). Open-field measurements of locomotory activity over 15 min demonstrated that 12-day-old Tk2−/− mice (n = 6) traveled 13±12% (mean±SD) relative to Tk2+/+ littermates (n = 4) (Fig. 2) (P < 0.002).
Figure 1.

Tk2−/− mice show growth retardation and early mortality. (A) Body weight of the mice with increasing age. Squares represent wild-type Tk2+/+ mice (n = 16); circles, Tk2+/− mice and triangles, Tk2−/− mice. (B) Kaplan–Meier curves showing percentages of surviving mice at the indicated ages. Squares represent wild-type Tk2+/+ mice (n = 30) and triangles, 10 Tk2−/− mice (n = 10).
Figure 2.

Tk2−/− mice show reduced locomotor activity on open-field testing. (A) Representative 15 min open-field test of 12-day-old mice Tk2+/+ and Tk2−/− littermates. (B) Average distance walked (cm) by 12-day-old Tk2+/+ (n = 4) and Tk2−/− (n = 6) mice, *P < 0.002.
Tk2−/− mice have significantly reduced Tk2 activity in all tissues tested; compared to tissues from wild-type littermates, Tk2 activity in Tk2−/− liver was 12%, heart 4%, muscle 3% and brain had 1.7% as determined by a radiochemical assay (15) (Fig. 3).
Figure 3.

Tk2−/− mice have reduced Tk2 activity in multiple tissues. Tk2 activity expressed as percent of the global TK activity (Tk1+Tk2) in Tk2−/− and wild-type mice. The experiments were performed in duplicate of whole extracts. Data are expressed as mean±SD of n = 3, **P<0.01 versus Tk2+/+.
To assess the effects of Tk2 deficiency, deoxynucleoside triphosphate pools were measured using a radioisotope polymerase extension assay (16,17) in isolated mitochondria of brain and liver (other organs could not be tested due to insufficient quantities of tissue). In brain mitochondria of Tk2−/− mice, dTTP concentrations were ∼20% of levels in wild-type littermates (P < 0.001) while other dNTPs were unchanged (Fig. 4A). By contrast, liver mitochondria of Tk2−/− mice showed reduced levels of dCTP (33% relative to wild-type; P < 0.001) and a trend towards lower dTTP (29% of wild-type; P > 0.05) (Fig. 4B).
Figure 4.

Tk2-deficiency alters mitochondrial dNTP pools. Levels of dATP, dTTP, dCTP and dGTP in mitochondria from mouse brain (A) and liver (B). All mice were sacrificed between 12 and 18 days old. Data are expressed as mean±SD of n = 5, ***P<0.001 versus Tk2+/+.
To determine the effects of dNTP pool imbalances on mtDNA levels, the real-time quantitative PCR analysis using mtDNA and nuclear GADPH gene specific primers was performed (18). Levels of mtDNA were decreased in the 12-day-old Tk2−/− mice (n = 5) compared to wild-type littermates (n = 5) and paralleled the degree of Tk2 deficiency. Depletion of mtDNA was most prominent in brain (12.5% of controls) and spinal cord (15%), less prominent in heart (20%), muscle (32%), kidney (60%) and not significant in liver (75%) (Fig. 5).
Figure 5.

Tk2−/− mice show depletion of mtDNA in multiple tissues. Tk2−/− mice showed partial depletion of mitochondrial DNA in all tissues tested (in decreasing order of severity brain, spinal cord, heart, muscle, kidney and liver). Data are expressed as mean±SD of n = 5. *P<0.05 versus Tk2+/+, **P < 0.01 versus Tk2+/+, ***P < 0.001 versus Tk2+/+.
In contrast to the widespread defects of mtDNA, only brain showed decreased activities of respiratory chain enzymes with mtDNA-encoded subunits normalized to activity of citrate synthase (CS), a marker of mitochondrial mass (19,20); complex I activity was 40% and complex IV activity was 55% of wild-type mice (P ≤ 0.005) (Fig. 6A). The respiratory chain dysfunction caused bioenergetic defects in brain of Tk2−/− mice (n = 3) relative to wild-type littermates (n = 3) as demonstrated by reductions in ATP [Tk2−/−: 10.7 ± 0.7 nmol/mg-protein (mean±SD); Tk2+/+: 13.9 ± 0.2; P < 0.01] and ATP/ADP ratio [Tk2−/−: 6.5 ± 0.3 nmol/mg-protein (mean±SD); Tk2+/+: 8.2 ± 0.2; P < 0.01] (17,21).
Figure 6.

Tk2−/− mice have decreased activities of respiratory chain enzymes and reduced steady-state levels of mtDNA-encoded proteins in brain, but not visceral organs or muscle. (A) Brain of Tk2−/− mice showed decreased activities of mitochondrial complexes I and IV normalized to citrate synthase and expressed in terms of percent of activity in wild-type mice. (B) Reduced levels of mtDNA-encoded subunits subunit 6 of NADH dehydrogenase (complex I) and subunit I of cytochrome c oxidase (complex IV) in brain were detected by western blot performed with whole tissue protein extracts (30 µg/lane) from three 12–14-day-old Tk2+/+ (lanes 1–3) and three Tk2−/− (lanes 4–6) mice using Rodent Total OXPHOS Complexes Detection Kit cocktail of antibodies (MitoSciences, Eugene, OR, USA). Western blots performed with other tissues under the same conditions are shown in supplemental data (Supplementary Material, Fig. S2). All mice were sacrificed between ages 12 and 18 days. Data are expressed as mean±SD of five mice per group. **P < 0.01 versus Tk2+/+, CI, complex I; CIV, complex IV; CS, citrate synthase.
The western blot analysis of respiratory chain components, normalized to the nDNA encoded 20 kDa-subunit of succinate dehydrogenase, showed significant reductions in Tk2−/− brain (n = 5) of subunit 6 of complex I (ND6) [73% of levels in controls±6% (mean±SD) (P < 0.001)] and subunit I of cytochrome c oxidase (COX I) [67% ± 2% (P < 0.01)] (Fig. 6B). The decreases in steady-state levels of these mtDNA-encoded polypeptides corresponded to the diminished activities of respiratory chain complexes I and IV in Tk2−/− brain. In Tk2−/− heart (n = 6), milder decreases of ND6 (89.5% ± 8%) and COX I (91% ± 4%) were observed (Supplementary Material, Fig. S2 and Table S1). By contrast, in Tk2−/− and Tk2+/+ mice, levels of the nDNA-encoded polypeptides core 2 subunit of complex III (Core 2) and subunit Vα of ATP synthase (C-Vα) were similar in all the tissues studied except brain, where Tk2−/− showed slightly reduced Core 2 [88 ± 4% (P < 0.01)]. In kidney, liver and skeletal muscle, levels of respiratory chain proteins were comparable in Tk2−/− and Tk2+/+ mice (Supplementary Material, Fig. S2 and Table S1). Spinal cord samples were too small for protein measurements.
In 12-day-old Tk2−/− (n = 4) mice, hematoxylin and eosin (H–E) stain of brain was unremarkable (Fig. 7A and B), but spinal cord neurons had abnormal vacuolar changes that were absent in Tk2+/+ (n = 3) littermates (Fig. 7E and F). Immunohistochemistry with primary anti-glial fibrillary acid protein (GFAP) antibody (22) applied to Tk2−/− brain and spinal cord revealed numerous astrocytes with enlarged cell bodies and processes indicating the presence of activated glial cells, particularly in the white matter of spinal cord and brain cortex (Fig. 7C, D, G and H). Histological examination of skeletal muscle, heart and kidney did not reveal any differences between Tk2−/− and wild-type mice. Specifically, in muscle, COX-deficient fibers and abnormal proliferation of mitochondria were not observed (not shown).
Figure 7.
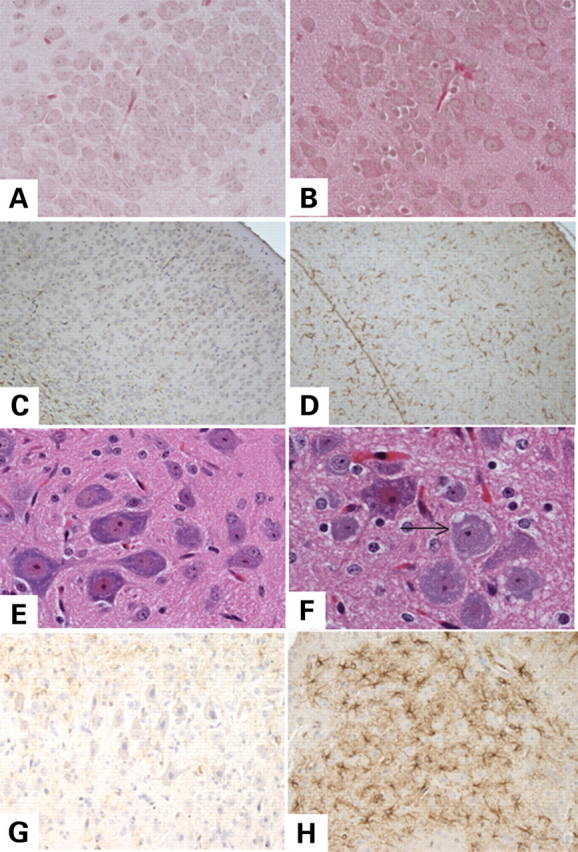
Histological studies show vacuolar changes and gliosis in spinal cord and gliosis in brain of Tk2−/− mice. Hematoxylin and eosin (H–E) staining of wild-type (A) and Tk2−/− brain (B) and wild-type spinal cord (E) appeared normal in contrast to the Tk2−/− anterior spinal cord (F) which showed vacuolar changes in neurons (arrows). Anti-glial fibrillary acid protein (anti-GFAP) antibody staining of wild-type spinal cord (G) and brain (C) showed normal astrocytes while Tk2−/− mice show abnormal and striking gliotic changes evident as large numbers of GFAP immunoreactive astrocytes with large cell bodies and processes in both Tk2−/− brain (D) and spinal cord (H).
DISCUSSION
Depletion of mtDNA in humans has been associated with mutations in nine nuclear genes, of which six [THYM, encoding thymidine phosphorylase; TK2; DGUOK; SUCLA2 and SUCLG1, encoding α and β subunits of succinyl-CoA synthase (SCS-A); and RRM2B encoding p53-controlled subunit of riboncleotide reductase] are involved in homeostasis of the mitochondrial nucleotide pool (5,9,10,23–27). In addition, mtDNA depletion can be caused by mutations in POLG encoding the catalytic subunit of mitochondrial polymerase γ; PEO1, encoding a mitochondrial T4-phage-like helicase (twinkle); and MPV17, encoding an inner mitochondrial membrane protein of unknown function (18,25,28–30).
To better characterize the pathogenesis of TK2 mutations, we generated Tk2 H126N knockin mutant mice. This mutation, which is analogous to a human H121N mutation, has been identified in homozygosity in a child with congenital-onset myopathy causing death at age 4 years (10,31) and in compound heterozygosity with a T113M Tk2 mutation in two siblings with rapidly progressive myopathies beginning at age 12–16 months (32). Skeletal muscle of the patients revealed low Tk2 activity (37–45% of controls), while mtDNA depletion (6–37% of controls), COX-negative fibers and reduced activities of mitochondrial respiratory chain complexes I, III and IV containing mtDNA-encoded subunits indicated significant mitochondrial pathology in this tissue.
Compared to patients with the H121N TK2 mutation, Tk2−/− mice showed more severely reduced Tk2 activity in all tissues tested, 1.7–12% relative to activities in wild-type littermates. In vitro assessments of human H121N mutant TK2 have revealed slight effects on the Km values for thymidine and deoxycytidine and only 2–3-fold lower Vmax values compared to normal TK2, but 2–4-fold increased Km values to ATP and 10-fold lower Ki of deoxycytidine inhibition of deoxythymidine phosphorylation (33). Thus, the severely reduced Tk2 activity in Tk2−/− mice may be due to: (i) reduced stability of the protein in vivo; (ii) deoxycytidine inhibition of deoxythymidine phosphorylation; (iii) decreased ATP binding to Tk2 or (iv) a combination of these effects.
In contrast to the muscle-specific phenotype observed in patients with the H121N Tk2 mutation, a rapidly progressive encephalomyelopathy developed in mice with homozygous H126N Tk2 mutation. Biochemical analyses of the Tk2−/− mice provided insights into the selective vulnerability of the CNS. In wild-type mice, Tk2 accounted for ∼60% of total brain Tk activity suggesting that CNS is more dependant on the mitochondrial pyrimidine salvage pathway than other tissues and therefore, deficiency of Tk2 activity may have greater consequences in brain than in muscle, liver and heart. In support of this hypothesis, Tk2 deficiency produced greater reductions of mitochondrial dTTP, mtDNA levels (12.5% relative to controls) and respiratory chain activities in brain than in other tissues, while histological abnormalities were only detected in the CNS. On the other hand, levels of dTTP in mitochondria were only moderately lower in brain (20% relative to controls) than in liver (29%), which also showed decreased dCTP in mitochondria (33%). It is likely that the post-mitotic status of most mature neurons contributes to the severe pathology in CNS. Quiescent cells in the G0-phase are more dependent upon the Tk2-mediated mitochondrial pyrimidine salvage pathway than mitotically active cells that express enzymes of the cytosolic salvage, including Tk1, and de novo nucleotide synthesis pathways and hence have expanded dNTP pools, particularly during the S-phase, for DNA synthesis in the nucleus and mitochondria (34). Thus, while overall dNTP levels are only moderately lower in the affected brain and spinal cord compared to unaffected liver, quiescent neurons, due to their presumably low levels of TK1 and dTTP, are likely to be more vulnerable to Tk2 deficiency than replicating hepatocytes. In addition, mutations in the RRM2B gene encoding the p53-regulated small subunit of ribonucleotide reductase cause mtDNA depletion manifesting as multisystemic diseases indicating that de novo synthesis of nucleotides is also crucial for mtDNA maintenance (25) and is therefore likely to compensate for lack of Tk2 activity in some tissues.
Noteworthy, despite partial depletion of mtDNA in heart (20% of controls), muscle (32%), kidney (60%) and liver (75%) in Tk2−/− mice, activities of mitochondrial respiratory chain enzymes and levels of mtDNA-encoded polypeptides were maintained at levels similar to controls indicating transcriptional or translational compensation for the mtDNA defect. Transcriptional compensation for partial mtDNA depletion has been observed in heterozygous TFAM knockout mice (35) and in skeletal muscle of patients with Tk2 mutations (36–38).
In summary, the H126N Tk2 knockin mutant mouse manifests a severe and rapidly progressive encephalomyelopathy with severe Tk2 deficiency, imbalances of mitochondrial dNTP pools and mtDNA depletion in multiple tissues, but most prominently in brain. In addition, defects of respiratory chain enzyme activities and histological alterations were restricted to the CNS. Thus, the severity of the Tk2 deficiency in the CNS appears to account for the tissue-specific phenotype of this animal model of mtDNA depletion. The H126N Tk2 knockin mouse is a useful tool to assess pathomechanisms and potential therapies for human TK2 deficiency and reinforces the notion that the mitochondrial pyrimidine salvage pathway is essential for the maintenance of mitochondrial nucleotide pools and mtDNA in multiple tissues.
Furthermore, our observations, coupled with the fact that human mutations in six genes involved in nucleoside/nucleotide metabolism cause mtDNA depletion, indicate that salvage and de novo nucleotide synthesis pathways are required to maintain mtDNA and that dNTP pool size is a critical factor regulating mtDNA copy number (5,9,10,23–27).
METHODS AND MATERIALS
Generation of Tk2 knockin mice
DNA from BAC clone RB23-478D9 (BACPAC Resource Center, Oakland, CA, USA) containing murine Tk2, was digested with SpeI and MfeI restriction enzymes and the 5.4 kb fragment containing exons IV–VI of Tk2 was isolated by agarose gel electrophoresis (Supplementary Material, Fig. S1). This DNA fragment was subcloned into pUC18 plasmid. Using site-directed mutagenesis (QuikChange XL Site-Directed Mutagenesis, Stratagene, La Jolla, CA, USA), we converted nucleotides 378–379 of the Tk2 cDNA sequence from GC to AA to introduce a H126N mutation in Tk2. A BglII restriction site was converted into a PacI site, into which a phosphoglycerate kinase promoter neomycin cassette, flanked by two loxP sequences (LPN), was inserted. In addition, diptheria toxin (DT) gene was introduced into a SbfI restriction site. The resulting construct, pUC18 mTk2 E5* LPN, was used as a replacement vector to introduce the mutated exon V of Tk2 into male SvJ129 ES cells. Of 192 transfected ES clones isolated by G418 antibiotic resistance, three recombinants were identified by a combination of PCR screening and southern blot analysis. Two clones were microinjected into C57BL/6J blastocysts and we obtained three chimeric mice. We confirmed the presence of the Tk2 knockin mutation by screening tail DNA and obtained germline transmission of the mutation by mating the mice with C57BL/6J female mice. We mated heterozygous Tk2 knockin (Tk2mut) mice with Cre-expressing (Cre+) mice to eliminate the LPN cassette.
Open-field test
The open-field test was performed to quantitate locomotor activity in 12-day-old Tk2−/− and wild-type littermates. Activity was quantified in five Plexiglas open-field boxes 43 × 43 cm2 (MED Associates, Georgia, VT, USA) enclosed in sound attenuating cabinets. Two sets of 16 pulse-modulated infrared photobeams were placed on opposite walls 2.5 cm apart to record xy ambulatory movements. Activity chambers were computer interfaced for data sampling at 100 ms resolution. Overall motor activity was quantified as the total distance traveled (cm). The path length traveled by each animal was recorded and summed for each minute interval during the test session, which was 15 min in total length.
Tk2 activity measurements
Whole tissue extracts were obtained in 0.5 mm PMSF, 50 mm Tris/HCl (pH 7.6), 2 mm DTT, 5 mm Benzamidin, 5% NP-40 and 2.5% Glycerol. Tk2 activity was determined by radiochemical method using the DE-81 filter paper technique as previously described (15). Each reaction was carried out with 60 µg of whole extract in a 100 µl final volume of 50 mm Tris/HCl (pH 7.6), 5 mm MgCl2, 5 mm ATP, 2 mm DTT and 10 mm NaF. The substrate for TK activity was 1 µM 3H-Thymidine and the inhibitor for Tk2 was 50 µM cold deoxycytidine.
Mitochondria isolation and mt-dNTPs pool determination
We measured mt-dNTPs pool by the DNA polymerase assay as previously described (17). Briefly, homogenates of liver and brain were centrifuged at 1000 × g for 3 min at 4°C (twice) and the subsequent supernatants were centrifuged at 9000 × g (liver) or 15 000 × g (brain) for 5 min at 4°C (twice). The mitochondrial pellets were suspended in 200 µl of cold water and an aliquot of 10 µl was taken to measure proteins. Then, the dNTPs were extracted with 60% methanol and after evaporation the dry residue was re-suspended in 60 µl of water (17). To measure the dNTPs pool, 2 µM of [3H]-dATP or [3H]-dTTP was used in each reaction. The results were expressed in absolute amount (pmol/mg prots).
mtDNA quantification
Mouse mtDNA was quantified by real-time PCR using an ABI PRISM 7000 sequence detection system as previously described (18). The primers and probe for murine COX I gene (mtDNA) and mouse glyceraldehyde-3-phosphate dehydrogenase (nDNA) were used for that propose. The values mtDNA levels were normalized by nDNA and the data were expressed in terms of percent considering 100% the value of the wild-type mice.
Mitochondrial respiratory chain complex activities
To measure the complex activities, 40–70 mg tissue was homogenized in 500 µl of CPT medium (0.5 M Tris–HCl, 0.15 M KCl, pH 7.5), sonicated for 10 sec and centrifuged at 1000 × g during 10 min at 4°C. The supernatant was used for protein determination and enzymatic assays. Complex I activity was measured following the oxidation of NADH at 340 nm (20). Briefly, a solution containing 25 mm KH2PO4—5 mm MgCl2 (pH 7.2), 2 mm KCN, 2.5 mg/ml BSA, 2 µg/ml antimycin A, 0.13 mm NADH and 65 µM CoQ1 was incubated at 30°C. After 3 min, the reaction started by addition of 300 µg of sample protein, and the increase of absorbance was followed for an additional 2 min. The residual activity in presence of rotenone (10 µg/ml) was subtracted to the total activity. The results were expressed in nmol of oxidized NADH/min/mg prot. Complex IV or COX activity was measured following the reduction of cytochrome c (cyt c) at 550 nm (19). Briefly, 60 µg of sample protein were incubated at 30°C in a medium containing 10 mm KH2PO4 (pH 6.5), 0.25 M sucrose, 1 mg/ml BSA and 0.1% reduced cyt c, and the reaction was followed during 2 min. To inhibit the reaction, 500 mm KCN was used. The results were expressed in nmol of oxidized cyt c/min/mg prot. CS activity was measured following the reduction of 100 mm 5,5′-dithiobis(2-nitrobenzoic acid) at 412 nm (30°C) in the presence of 60 µg of sample protein, 300 mm acetyl CoA, 10 mm Tris–Cl (pH % = 7.5) and 500 mm oxalacetic acid (19). The results were expressed in nmol of TNB/min/mg prot. The results of CI and CIV activities were normalized by CS activity.
Adenine nucleotide levels
Adenine nucleotides concentrations were measured as described (17,21) with slight modifications. Briefly, the mouse was sacrificed and the brain was rapidly extracted and frozen in liquid nitrogen. Then, 50 mg of tissue was homogenized in 500 µl of ice-cold 0.5 M perchloric acid and centrifuged at 16 000 × g for 10 min at 4°C. The pellets were stored at –80°C for protein measurement and adenine nucleotides were measured in the resultant supernatants into an Alliance HPLC (Waters Corporation, Milford, MA, USA) with an Alltima C18NUC reverse-phase column (Alltech Associates, Deerfield, IL, USA). After stabilizing the column with the mobile phase, samples (50 µl) were injected onto the HPLC system. The mobile phase consisted of 0.2 M ammonium phosphate buffer pH 3.5 (phase A) and 30% methanol in 0.2 M ammonium phosphate buffer, pH 3.5 (phase B). The time schedule for the binary gradient was as previously reported (17). Standard curves for AMP, ADP and ATP were constructed with 15, 30 and 60 µM of each nucleotide. Absorbance of the samples was measured with an UV detector at 260 nm wavelength and the concentration of each nucleotide in the samples was calculated based on the peak area. Adenine nucleotide levels were expressed in nmol/mg prot.
Western blot analyses
Thirty micrograms of whole tissues extracts, prepared as described in Tk2 enzyme assay, were electrophoresed in a SDS-12%-PAGE gel, transferred to Immun-Blot™ PVDF membranes (Biorad, Hercules, CA, USA) and probed with Rodent Total OXPHOS Complexes Detection Kit cocktail of antibodies (MitoSciences, Eugene, OR, USA). Protein–antibody interaction were detected with peroxidase-conjugated mouse anti-mouse IgG antibody (Sigma-Aldrich, St Louis, MO, USA), using SuperSignal® chemi-luminiscence detection kit (Thermo Fisher, Waltham, MA, USA). Quantification of proteins was carried out using NIH ImageJ 1.37V software. Average gray value was calculated within selected areas as the sum of the gray values of all the pixels in the selection divided by the number of pixels.
Histological studies
Four Tk2−/− and three Tk2+/+ mice were sacrificed at age 12 days for histological studies. Brains and spinal cords were removed and paraffin embedded. To evaluate structural alterations, sections were stained with H–E.
For immunohistochemistry, six-micron serial sections of brain and spinal cord were cut in a cryostat and deparaffinized with xylene. Sections were incubated with a polyclonal antibody against GFAP. Immunostaining was performed on sections of the cerebral cortex, hippoccampus, choroid plexus, cerebellum, cervical and lumbar spinal cord using avidin–biotin peroxidase complex as described (22). Sections were examined with an Olympus BX51 microscope with a computer assisted image analysis system and the images were scanned under equal light conditions with the Q-capture computer program (22). Muscle, heart and kidney were removed and frozen in liquid nitrogen. Six micron-thick sections were cut in a cryostat. Gomori trichrome and H–E stains were performed to visualize histological features and mitochondria.
SUPPLEMENTARY MATERIAL
FUNDING
The work was supported in part by the Muscular Dystrophy Association USA and the FUNDISMUN Foundation. The authors are supported by grants from the Muscular Dystrophy Association, National Institutes of Health and the Marriott Mitochondrial Disorder Clinical Research Fund (MMDCRF). L.C.L. and A.G.C. are supported by postdoctoral fellowships from the Ministerio de Educacion y Ciencia, Spain.
Supplementary Material
ACKNOWLEDGEMENT
We thank Drs S. DiMauro, E.A. Schon, and A. Andreu for useful comments.
Conflict of Interest statement. The authors have no conflicts of interests.
REFERENCES
- 1.Anderson S., Bankier A., Barrell B. Sequence and organization of the human mitochondrial genome. Nature. 1981;290:457–465. doi: 10.1038/290457a0. [DOI] [PubMed] [Google Scholar]
- 2.Moraes C.T., Shanske S., Tritschler H.J., Aprille J.R., Andreetta F., Bonilla E., Schon E.A., DiMauro S. MtDNA depletion with variable tissue expression: a novel genetic abnormality in mitochondrial diseases. Am. J. Hum. Genet. 1991;48:492–501. [PMC free article] [PubMed] [Google Scholar]
- 3.Hirano M., Marti R., Ferreiro-Barros C., Vilà M.R., Tadesse S., Nishigaki Y., Nishino I., Vu T.H. Defects of intergenomic communication: autosomal disorders that cause multiple deletions and depletion of mitochondrial DNA. Semin. Cell Develop. Biol. 2001;12:417–427. doi: 10.1006/scdb.2001.0279. [DOI] [PubMed] [Google Scholar]
- 4.Spinazzola A., Zeviani M. Disorders of nuclear-mitochondrial intergenomic communication. Biosci. Rep. 2007;27:39–51. doi: 10.1007/s10540-007-9036-1. [DOI] [PubMed] [Google Scholar]
- 5.Nishino I., Spinazzola A., Hirano M. Thymidine phosphorylase gene mutations in MNGIE, a human mitochondrial disorder. Science. 1999;283:689–692. doi: 10.1126/science.283.5402.689. [DOI] [PubMed] [Google Scholar]
- 6.Bogenhagen D., Clayton D.A. Mouse L cell mitochondrial DNA molecules are selected randomly for replication throughout the cell cycle. Cell. 1977;11:719–727. doi: 10.1016/0092-8674(77)90286-0. [DOI] [PubMed] [Google Scholar]
- 7.Hirano M., Martí R., Vilà M.R., Nishigaki Y. MtDNA maintenance and stability genes: MNGIE and mtDNA depletion syndromes. In: Köhler C., Bauer M.F., editors. Mitochondrial Function and Biogenetics. Vol. 8. Berlin: Springer-Verlag; 2004. pp. 177–200. [Google Scholar]
- 8.Mancuso M., Filosto M., Bonilla E., Hirano M., Shanske S., Vu T.H., DiMauro S. Mitochondrial myopathy of childhood associated with mitochondrial DNA depletion and a homozygous mutation (T77M) in the TK2 gene. Arch. Neurol. 2003;60:1007–1009. doi: 10.1001/archneur.60.7.1007. [DOI] [PubMed] [Google Scholar]
- 9.Mandel H., Szargel R., Labay V., Elpeleg O., Saada A., Shalata A., Anbinder Y., Berkowitz D., Hartman C., Barak M., et al. The deoxyguanosine kinase gene is mutated in individuals with depleted hepatocerebral mitochondrial DNA. Nat. Genet. 2001;29:337–341. doi: 10.1038/ng746. [DOI] [PubMed] [Google Scholar]
- 10.Saada A., Shaag A., Mandel H., Nevo Y., Eriksson S., Elpeleg O. Mutant mitochondrial thymidine kinase in mitochondrial DNA depletion myopathy. Nat. Genet. 2001;29:342–344. doi: 10.1038/ng751. [DOI] [PubMed] [Google Scholar]
- 11.Salviati L., Sacconi S., Mancuso M., Otaegui D., Camano P., Marina A., Rabinowitz S., Shiffman R., Thompson K., Wilson C.M., et al. Mitochondrial DNA depletion and dGK gene mutations. Ann. Neurol. 2002;52:311–317. doi: 10.1002/ana.10284. [DOI] [PubMed] [Google Scholar]
- 12.Oskoui M., Davidzon G., Pascual J., Erazo R., Gurgel-Giannetti J., Krishna S., Bonilla E., De Vivo D.C., Shanske S., DiMauro S. Clinical spectrum of mitochondrial DNA depletion due to mutations in the thymidine kinase 2 gene. Arch. Neurol. 2006;63:1122–1126. doi: 10.1001/archneur.63.8.1122. [DOI] [PubMed] [Google Scholar]
- 13.Saada A., Shaag A., Elpeleg O. mtDNA depletion myopathy: elucidation of the tissue specificity in the mitochondrial thymidine kinase (TK2) deficiency. Mol. Genet. Metab. 2003;79:1–5. doi: 10.1016/s1096-7192(03)00063-5. [DOI] [PubMed] [Google Scholar]
- 14.Rylova S.N., Mirzaee S., Albertioni F., Eriksson S. Expression of deoxynucleoside kinases and 5′-nucleotidases in mouse tissues: implications for mitochondrial toxicity. Biochem. Pharmacol. 2007;74:169–175. doi: 10.1016/j.bcp.2007.03.029. [DOI] [PubMed] [Google Scholar]
- 15.Arner E.S., Spasokoukotskaja T., Eriksson S. Selective assays for thymidine kinase 1 and 2 and deoxycytidine kinase and their activities in extracts from human cells and tissues. Biochem. Biophys. Res. Commun. 1992;188:712–718. doi: 10.1016/0006-291x(92)91114-6. [DOI] [PubMed] [Google Scholar]
- 16.Sherman P.A., Fyfe J.A. Enzymatic assay for deoxyribonucleoside triphosphates using synthetic oligonucleotides as template primers. Anal. Biochem. 1989;180:222–226. doi: 10.1016/0003-2697(89)90420-x. [DOI] [PubMed] [Google Scholar]
- 17.Ferraro P., Nicolosi L., Bernardi P., Reichard P., Bianchi V. Mitochondrial deoxynucleotide pool sizes in mouse liver and evidence for a transport mechanism for thymidine monophosphate. Proc. Natl Acad. Sci. USA. 2006;103:18586–18591. doi: 10.1073/pnas.0609020103. [DOI] [PMC free article] [PubMed] [Google Scholar]
- 18.Spinazzola A., Viscomi C., Fernandez-Vizarra E., Carrara F., D’Adamo P., Calvo S., Marsano R.M., Donnini C., Weiher H., Strisciuglio P., et al. MPV17 encodes an inner mitochondrial membrane protein and is mutated in infantile hepatic mitochondrial DNA depletion. Nat. Genet. 2006;38:570–575. doi: 10.1038/ng1765. [DOI] [PubMed] [Google Scholar]
- 19.Barrientos A. In vivo and in organello assessment of OXPHOS activities. Methods. 2002;26:307–316. doi: 10.1016/S1046-2023(02)00036-1. [DOI] [PubMed] [Google Scholar]
- 20.Kirby D.M., Thorburn D.R., Turnbull D.M., Taylor R.W. Biochemical assays of respiratory chain complex activity. Methods Cell Biol. 2007;80:93–119. doi: 10.1016/S0091-679X(06)80004-X. [DOI] [PubMed] [Google Scholar]
- 21.Manfredi G., Yang L., Gajewski C.D., Mattiazzi M. Measurements of ATP in mammalian cells. Methods. 2002;26:317–326. doi: 10.1016/S1046-2023(02)00037-3. [DOI] [PubMed] [Google Scholar]
- 22.Tanji K., Vu T.H., Schon E.A., DiMauro S., Bonilla E. Kearns-Sayre syndrome: unusual pattern of expression of subunits of the respiratory chain in the cerebellar system. Ann. Neurol. 1999;45:377–383. doi: 10.1002/1531-8249(199903)45:3<377::aid-ana14>3.0.co;2-m. [DOI] [PubMed] [Google Scholar]
- 23.Elpeleg O., Miller C., Hershkovitz E., Bitner-Glindzicz M., Bondi-Rubinstein G., Rahman S., Pagnamenta A., Eshhar S., Saada A. Deficiency of the ADP-forming succinyl-CoA synthase activity is associated with encephalomyopathy and mitochondrial DNA depletion. Am. J. Hum. Genet. 2005;76:1081–1086. doi: 10.1086/430843. [DOI] [PMC free article] [PubMed] [Google Scholar]
- 24.Nishigaki Y., Martí R., Hirano M. ND5 is a hot-spot for multiple atypical mitochondrial DNA deletions in mitochondrial neurogastrointestinal encephalomyopathy. Hum. Mol. Genet. 2004;13:91–101. doi: 10.1093/hmg/ddh010. [DOI] [PubMed] [Google Scholar]
- 25.Bourdon A., Minai L., Serre V., Jais J.P., Sarzi E., Aubert S., Chretien D., de Lonlay P., Paquis-Flucklinger V., Arakawa H., et al. Mutation of RRM2B, encoding p53-controlled ribonucleotide reductase (p53R2), causes severe mitochondrial DNA depletion. Nat. Genet. 2007;39:776–780. doi: 10.1038/ng2040. [DOI] [PubMed] [Google Scholar]
- 26.Ostergaard E., Christensen E., Kristensen E., Mogensen B., Duno M., Shoubridge E.A., Wibrand F. Deficiency of the alpha subunit of succinate-coenzyme A ligase causes fatal infantile lactic acidosis with mitochondrial DNA depletion. Am. J. Hum. Genet. 2007;81:383–387. doi: 10.1086/519222. [DOI] [PMC free article] [PubMed] [Google Scholar]
- 27.Moraes C.T. What regulates mitochondrial DNA copy number in animal cells? Trends Genet. 2001;17:199–205. doi: 10.1016/s0168-9525(01)02238-7. [DOI] [PubMed] [Google Scholar]
- 28.Hakonen A.H., Isohanni P., Paetau A., Herva R., Suomalainen A., Lonnqvist T. Recessive Twinkle mutations in early onset encephalopathy with mtDNA depletion. Brain. 2007;130:3032–3040. doi: 10.1093/brain/awm242. [DOI] [PubMed] [Google Scholar]
- 29.Naviaux R.K., Nguyen K.V. POLG mutations associated with Alpers’ syndrome and mitochondrial DNA depletion. Ann. Neurol. 2004;55:706–712. doi: 10.1002/ana.20079. [DOI] [PubMed] [Google Scholar]
- 30.Sarzi E., Goffart S., Serre V., Chretien D., Slama A., Munnich A., Spelbrink J.N., Rotig A. Twinkle helicase (PEO1) gene mutation causes mitochondrial DNA depletion. Ann. Neurol. 2007;62:579–587. doi: 10.1002/ana.21207. [DOI] [PubMed] [Google Scholar]
- 31.Nevo Y., Soffer D., Kutai M., Zelnik N., Saada A., Jossiphov J., Messer G., Shaag A., Shahar E., Harel S., et al. Clinical characteristics and muscle pathology in myopathic mitochondrial DNA depletion. J. Child Neurol. 2002;17:499–504. doi: 10.1177/088307380201700705. [DOI] [PubMed] [Google Scholar]
- 32.Mancuso M., Salviati L., Sacconi S., Otaegui D., Camano P., Marina A., Bacman S., Moraes C.T., Carlo J.R., Garcia M., et al. Mitochondrial DNA depletion: mutations in thymidine kinase gene with myopathy and SMA. Neurology. 2002;59:1197–1202. doi: 10.1212/01.wnl.0000028689.93049.9a. [DOI] [PubMed] [Google Scholar]
- 33.Wang L., Saada A., Eriksson S. Kinetic properties of mutant human thymidine kinase 2 suggest a mechanism for mitochondrial DNA depletion myopathy. J. Biol. Chem. 2003;278:6963–6968. doi: 10.1074/jbc.M206143200. [DOI] [PubMed] [Google Scholar]
- 34.Ferraro P., Pontarin G., Crocco L., Fabris S., Reichard P., Bianchi V. Mitochondrial deoxynucleotide pools in quiescent fibroblasts: a possible model for mitochondrial neurogastrointestinal encephalomyopathy (MNGIE) J. Biol. Chem. 2005;280:24472–24480. doi: 10.1074/jbc.M502869200. [DOI] [PubMed] [Google Scholar]
- 35.Larsson N.G., Wang J., Wilhelmsson H., Oldfors A., Rustin P., Lewandoski M., Barsh G.S., Clayton D.A. Mitochondrial transcription factor A is necessary for mtDNA maintenance and embryogenesis in mice. Nat. Genet. 1998;18:231–236. doi: 10.1038/ng0398-231. [DOI] [PubMed] [Google Scholar]
- 36.Barthelemy C., Ogier de Baulny H., Diaz J., Cheval M.A., Frachon P., Romero N., Goutieres F., Fardeau M., Lombes A. Late-onset mitochondrial DNA depletion: DNA copy number, multiple deletions, and compensation. Ann. Neurol. 2001;49:607–617. [PubMed] [Google Scholar]
- 37.Vilà M.R., Segovia-Silvestre T., Gamez J., Marina A., Naini A.B., Meseguer A., Lombes A., Bonilla E., DiMauro S., Hirano M., et al. Reversion of mtDNA depletion in a patient with TK2 deficiency. Neurology. 2003;60:1203–1205. doi: 10.1212/01.wnl.0000055928.58122.47. [DOI] [PubMed] [Google Scholar]
- 38.Vilà M.R., Villarroya J., Garcia-Arumi E., Castellote A., Meseguer A., Hirano M., Roig M. Selective muscle fiber loss and molecular compensation in mitochondrial myopathy due to TK2 deficiency. J. Neurol. Sci. 2008;267:137–141. doi: 10.1016/j.jns.2007.10.019. [DOI] [PMC free article] [PubMed] [Google Scholar]
Associated Data
This section collects any data citations, data availability statements, or supplementary materials included in this article.