

Abstract
We have developed a next generation, miniaturized platform to diagnose disease at the point-of-care using diagnostic magnetic resonance (DMR-3). Utilizing a rapidly growing library of functionalized magnetic nanoparticles, DMR has previously been demonstrated as a versatile tool to quantitatively and rapidly detect disease biomarkers in unprocessed biological samples. A major hurdle for bringing DMR to the point-of-care has been its sensitivity to temperature variation. As an alternative to costly and bulky mechanisms to control temperature, we have implemented an automated feedback system to track and compensate for the temperature drift, which enables reliable and robust DMR measurements in realistic clinical environments (4–50 °C). Furthermore, the new system interfaces with a mobile device to facilitate system control and data sharing over wireless networks. With such features, the DMR-3 platform can function as a self-contained laboratory even in resource-limited, remote settings. The clinical potential of the new system is demonstrated by detecting trace amounts of proteins and as few as 10 bacteria (Staphylococcus aureus) in a short time frame (<30 min).
Introduction
The development of automated and inexpensive tools to transfer medical tests from specialized laboratories directly to the point of medical care promises to revolutionize patient care, enable rapid response to pandemics, and dramatically lower healthcare costs.1–5 Diagnostic magnetic resonance (DMR) technology has been developed as a versatile platform to quantitatively and rapidly detect molecular biomarkers in native biological samples.6–10 Based on the principle of nuclear magnetic resonance (NMR), DMR measures the transverse relaxation time (T2) of samples, in which biological targets of interest are labeled with target-specific magnetic nanoparticles (MNPs). Samples that contain MNP-labeled biological targets have shorter T2 values, as the NMR signal decays faster in the time domain.9,11 The analytical capability of DMR has been demonstrated by detecting and profiling a wide range of biological targets, including small molecules,12 proteins,13 nucleic acids (~1 pM),14,15 pathogens,8 and cancer cells (~1 cell).7,10
We herein report on the development of a next generation DMR-3 system optimized for point-of-care operation in the field. One fundamental hurdle for bringing DMR out of the laboratory has been its inherent sensitivity to temperature, which originates from the temperature-dependent fluctuation of the magnetic field (B) of the permanent magnet in the system.16 The drift in B leads to corresponding changes in the Larmor frequency (f0) of the NMR signal, causing artifacts in the measured T2 values. In a laboratory setting, the problem can be addressed by controlling the environmental and system temperatures. Such a solution, however, significantly increases the cost and size of the DMR system, making it less practical for point-of-care applications. Here we present a new, electronic-based approach to overcome this challenge; by implementing a feedback system that tracks and automatically compensates for variations in f0, we significantly improve the robustness and reliability of DMR measurements without the need for temperature control. Furthermore, the system is interfaced with a mobile device for easy use by medical personnel and for data logging/sharing via a wireless connection. The system is compact, fully programmable, and self-contained, enabling it to be used as a versatile portable laboratory in resource-limited, remote settings.
The next-generation DMR-3 system is demonstrated as a rapid, robust diagnostic platform for point-of-care medicine. The DMR system was used to reliably and accurately measure T2 over a wide range of temperature variations (4 to 50 °C). The clinical utility of the DMR system was demonstrated by detecting trace amounts of proteins (1 nM) and identifying a small number of pathogens (~10 colony-forming units of Staphylococcus aureus).
Methods
A DMR measurement begins by labeling a sample with target-specific MNPs. The binding of MNPs onto the target of interest renders the target superparamagnetic. When placed in static, polarizing magnetic fields for NMR detection, MNPs produce local dipole fields with strong spatial dependence, which accelerates the transverse relaxation of water protons. Magnetically labeled objects consequently cause the NMR signal to decay faster, leading to a shorter T2, than non-targeted objects. The detection sensitivity of DMR has been significantly enhanced in recent years by miniaturizing NMR probes7,16 and synthesizing highly magnetic nanoparticles.8
Miniaturized DMR system—NMR probes
A photograph and the schematic of the portable DMR system are shown in Fig. 1a. The portable magnet, microcoil, and RF (radio frequency) matching circuit are packaged into a custom-machined, thermally insulating PMMA (polymethylmethacrylate) housing. A solenoidal microcoil and RF matching network are used to excite and read-out the NMR signal. A permanent NdFeB magnet (PM1055, Metrolab) provides the static NMR field (B = 0.5 T). A small form-factor enclosure containing the entire NMR electronics sits next to the magnet and microcoil assembly. The custom electronics provides the NMR pulse sequences, collects the NMR signal, and communicates with external terminals.
Fig. 1.

New portable diagnostic magnetic resonance (DMR) system. (a) A photograph of the new system (DMR-3) including the custom electronics, permanent magnet assembly, and microcoil. All necessary components were packaged for portable operation. (b) A schematic cutaway of the magnet assembly and microcoil, showing how samples can easily be loaded using a disposable container. The microcoil is embedded in a polymer with the entire coil-bore accessible, and the sample container has a thin wall (25 μm) to maximize the sample filling factor. (c) Block diagram of the custom-designed electronics for the portable DMR. The system is self-contained for standalone operation. (d) For user-inputs and data sharing, the system communicates with external devices (e.g., smartphones, tabletop computers).
The solenoidal microcoil is engineered to maximize the signal-to-noise ratio of the DMR measurement. The microcoil is embedded in a PDMS (polydimethylsiloxane) block to maximize the sample-filling factor, the fraction of the coil volume occupied by the samples.8 The solenoid coil is constructed by wrapping a fine copper wire around a polyethylene tube and subsequently immersing it into a polymer (PDMS). Following polymer curing, the tube is retracted to create access for the sample. Samples are loaded into thin-wall (thickness 25 μm) polyimide tubes (B000FMWT7A; Small Parts), and introduced into the coil bore for NMR detection (Fig. 1b). Modular coils made in a variety of sizes can be plugged into the system to optimally accommodate available sample volumes (1–100 μL).
Miniaturized DMR system—NMR electronics
The NMR electronics are designed to generate NMR pulse sequences, to measure the DMR signal, and to communicate with external terminals. Commercial integrated circuit (IC) chips are assembled to create a cost-effective ($100), modular platform with a small form-factor (20 cm × 12 cm × 5 cm). Compared to our previous prototype that uses a custom-designed IC chip,17 the current design offers much improved programmability to enable the automatic system tuning and versatile NMR measurements (described below).
The electronics consists of four functional parts (Fig. 1c): a microcontroller unit (MCU), an RF generator, a data acquisition unit, and an RF transceiver. The MCU (TMS320F28235; Texas Instruments) orchestrates the operation of the other units, processes raw data, and communicates with external terminals for data transfer and user-control. The RF signal for NMR excitation is generated by a direct digital synthesis chip (AD9954; Analog Devices). Pulse sequences for NMR measurements are created by modulating the RF signal using voltage-controlled switches (ADG1419BRMZ; Analog Devices) on the transceiver. The NMR signal received from the probe is processed in the RF transceiver for heterodyne detection (Fig. S1†). The signal is first amplified by low-noise amplification (AD604; Analog Devices), followed by the frequency downconversion to audio frequencies (1–10 kHz) using a mixer (ADE-6; Mini Circuits). The down-converted signal is further conditioned by a low-pass filter and an amplifier (AD604; Analog Devices), and is sent to the data acquisition unit (AD7625; Analog Devices) for digitization. The MCU finally processes the digital data and transfers them to external terminals (computer or mobile devices) via a standard communication channel (e.g., universal serial bus, WiFi). The terminal has a user-friendly graphical interface (Fig. 1d) to facilitate the control of the system and data analysis. Measured data can also be reported electronically through wireless networks. This capacity could be used for real-time tracking of the spread of a pandemic (example: SARS, flu), or for remote access to an individual patient’s information by doctors.
Temperature compensation
The new DMR system is designed to track and compensate for the drift of the Larmor frequency caused by temperature variations. The Larmor frequency f0 = γB/(2π), where γ is the gyromagnetic constant, is directly proportional to the field strength of the external magnet B, which is highly susceptible to environmental temperature. For example, a 1 °C increase in temperature causes the magnetic field from the NdFeB magnet to drop ~0.1% from its initial value, and accordingly f0 decreases by 0.1%. For the magnet used in the system (B = 0.5 T), the 1 °C increase leads to ~20 kHz drop in f0. Such changes in frequency could distort measured signals; the down-converted NMR signals can drift beyond the passband (<30 kHz) of the low-pass filter and be significantly attenuated, leading to artifacts in the measured NMR signal profile.
The new DMR system compensates for temperature changes by monitoring f0 and automatically adjusting the RF frequency f for sample excitation. The algorithm for the proposed active tracking is shown in Fig. 2a. The measurement begins with a coarse search for f0. Using an initial fi for the frequency of RF excitation, an NMR spin echo is measured and transformed into the frequency domain (Fig. 2b) via fast Fourier transformation (FFT). The spectral power (P) of the peak in the measured bandwidth (1–30 kHz) is then compared to a predefined threshold Pth for the reliable peak identification. If P < Pth, the coarse search continues by incrementing f by Δf. Otherwise, the tracking proceeds to a fine tuning routine. For the fine tuning, the frequency offset fd (=| f − f0 |) is measured in the FFT domain, and f is adjusted iteratively to reach the target fd (=3 kHz). Note that the target fd value can be chosen to minimize the noise figure of the amplifiers and hence maximize the overall signal-to-noise of the electronics. Once the f0 and f are determined, NMR measurements are performed to determine the longitudinal (T1) and the transverse (T2) relaxation times using inversion-recovery and Carr–Purcell–Meiboom–Gill (CPMG) pulse sequences, respectively, (Fig. 2c). For subsequent measurements, the tracking time is minimized by using the f0 from the previous measurement as the starting value (fi) and by skipping the coarse search. This temperature tracking technique is similar to the conventional field frequency lock system used for NMR spectroscopy, that automatically adjusts the magnetic field strength to keep the Larmor frequency constant.18 Our technique lets the field vary, but keeps the frequency offset fd constant by adjusting the RF frequency f for sample excitation.
Fig. 2.

Automated temperature tracking in the new portable DMR-3 system. (a) The measurement starts by searching for the Larmor frequency f0 at the given environmental setting, using the successive tracking routines (coarse and fine). Once f0 is determined, a full NMR detection is performed using pulse sequences, and the resulting signal is processed to obtain the longitudinal (T1) or the transverse (T2) relaxation time. (b) The tracking algorithm. For a given RF excitation with the frequency f, a single spin echo is recorded and analyzed via fast Fourier transform (FFT). In the frequency domain, the spectral shape of the echo signal is compared against a tuning criterion. If test fails, f is increased by Δf, and the whole process is repeated. For the coarse tracking, the routine checks whether the height (P) of a spectral peak is larger than the predetermined threshold (Pth). For the fine tuning, the frequency difference fd (=|f − f0|) is compared to an optimal offset value (3 kHz). (c) Measured data at each stage of the measurement routine: (i) a single echo used for the resonance tracking; (ii) the echo signal in the frequency domain showing how P and fd are defined for the coarse and the fine tuning, respectively; (iii) an NMR signal obtained using CPMG (Carr–Purcell–Meiboom–Gill) pulse sequences with fd = 3 kHz and (iv) the processed NMR signal to obtain the T2 value.
The temperature compensation strategy is enabled by the programmability of the direct digital synthesizer and the MCU, which quickly and automatically executes the tracking algorithm. The MCU offers an inexpensive (<$20) solution that offers high processing power to execute a complex algorithm in real-time on a portable device. The direct digital synthesis chip provides a programmable, stable, and clean radiofrequency source. These highly advanced, cost-effective electronics make it possible to avoid the use of bulky, power-consuming parts (e.g., a heated container) for temperature control. The resulting DMR system can thus be portable and power-efficient for point-of-care applications.
Preparation of magnetic nanoparticles
To demonstrate the portable DMR system, we used cross-linked iron oxide (CLIO) nanoparticles as magnetic agents. Detailed protocols on particle synthesis have been reported.19,20 In brief, CLIO particles consist of ferrite cores (7 nm in diameter) covered with a layer of 10 kDa dextran. The dextran layer is cross-linked with epichlorohydrin to stabilize the coating, and subsequently aminated to provide primary amine groups (CLIO–NH2). On average, 36 primary amines are available per CLIO for further conjugation. The hydrodynamic diameter of CLIO, measured by dynamic light scattering (Zetasizer 1000HS; Malvern Instruments), is 38 nm.
To render CLIO target-specific, the particle surface was modified with affinity ligands. For example, biotin was immobilized on CLIO to detect avidin. To biotinylate CLIO–NH2, 0.23 mg sulfosuccinimidyl-6-(biotinamido)hexanoate (sulfo-NHS-LC-biotin) was mixed with 0.5 mg CLIO in 1.25 mL PBS (phosphate buffered saline) solution (pH 7.2) for 3 h at room temperature. The biotinylated CLIO was purified using membrane filtration (Amicon Mw 30 000; Millipore) and with Sephadex G-50 (GE Healthcare) using PBS (pH 7.2) as the eluent buffer.
For bacterial targeting (Staphylococcus aureus; S. aureus), we conjugated CLIO with vancomycin, an antibiotic that recognizes D-alanyl-D-alanine moieties in the bacterial cell wall.20 CLIO (2 mg Fe) was first mixed with 0.17 mg succinic anhydride in PBS (pH 8) for 3 h to convert the amine groups into carboxylate groups. The succinylated CLIO was then activated with 2 mg EDC (1-ethyl-3-(3-dimethylaminopropyl)carbodiimide) and 2 mg sulfo-NHS (N-hydroxysulfosuccinimide) in MES buffer solution (pH 6) for 60 min, and purified using a membrane filter and Sephadex G-50 in PBS. The activated CLIO conjugates were mixed with 7.4 mg vancomycin in PBS (pH 7.2) for 2 h. The CLIO–vancomycin conjugates were purified using a membrane filter and Sephadex G-100 in PBS.
Avidin detection
To detect avidin (Av) in solution, we used biotinylated CLIO (CLIO–biotin). Beginning with a stock concentration of 1 mg mL−1 [Av] (ImmunoPure Avidin; Pierce Biotechnology) in PBS, dilutions were created spanning logarithmically from 800 nM [Av] to 2 nM [Av]. These samples were incubated with 0.2 mM [Fe] CLIO–biotin. Following 30 minute incubation at room temperature, DMR measurements were performed on 2 μL samples.
Bacterial detection
S. aureus was used as a model target for bacterial detection. Bacterial specimen was purchased (strain #25923; ATCC) and cultured in vendor recommended media (m Staphylococcus broth; BD). The density of bacteria was estimated by measuring the optical density (OD) at 600 nm. Beginning with a bacteria concentration of 5 × 10⁵ CFU mL−1, serial dilutions were created spanning logarithmically from 5 × 10⁵ CFU mL−1 to 103 CFU mL−1. These samples were incubated (15 min, 20 °C) with 0.2 mM [Fe] vancomycin conjugated CLIO. Following the incubation, the excess CLIO was removed via centrifugation (2000g), and the samples were resuspended in PBS. DMR measurements were performed on 2 μL samples.
Diagnostic magnetic resonance (DMR) measurement parameters
The following CPMG pulse sequences were used for T2 measurements. For short T2 (<300 ms): the number of pulses: 400; pulse width: 50 μs; TE (echo time): 2.5 ms; TR (repetition time): 1 s and the number of averages: 10. For long T2 (>300 ms): the number of pulses: 500; pulse width: 50 μs; TE: 4 ms; TR: 5 s and the number of averages: 10. For the T1 measurements, the following inversion recovery parameters were used: the number of spin inversion-recovery data points: 200, pulse width: 50 μs, and the number of averages/spin inversion recovery: 10.
Results
Robust NMR measurements in realistic point-of-care environments
We first evaluated the DMR-3 system for its ability to compensate for temperature variations. Fig. 3a shows a comparative example wherein the transverse relaxation time (T2) of the same sample was measured with and without temperature compensation. The sample was prepared by adding MNPs (CLIO–NH2) into a PBS buffer to obtain T2 ≈ 100 ms. When f0 was allowed to drift due to typical fluctuations in room temperature (ΔT ≈ 2 °C), but the RF frequency f for the sample excitation was fixed, T2 values varied up to 200% relative to its starting value. However, when |f0 − f| was held constant (3 kHz) by tracking f0 and adjusting f, the T2 variations were significantly reduced to <1%. These results illustrate the importance of keeping a constant frequency offset (|f0 − f|) for robust, reliable DMR measurements. For a typical DMR measurement in clinical conditions, temperature tracking allows a more robust and reliable measurement of T2, with an average error of ~1% compared to ~50% without temperature tracking.
Fig. 3.
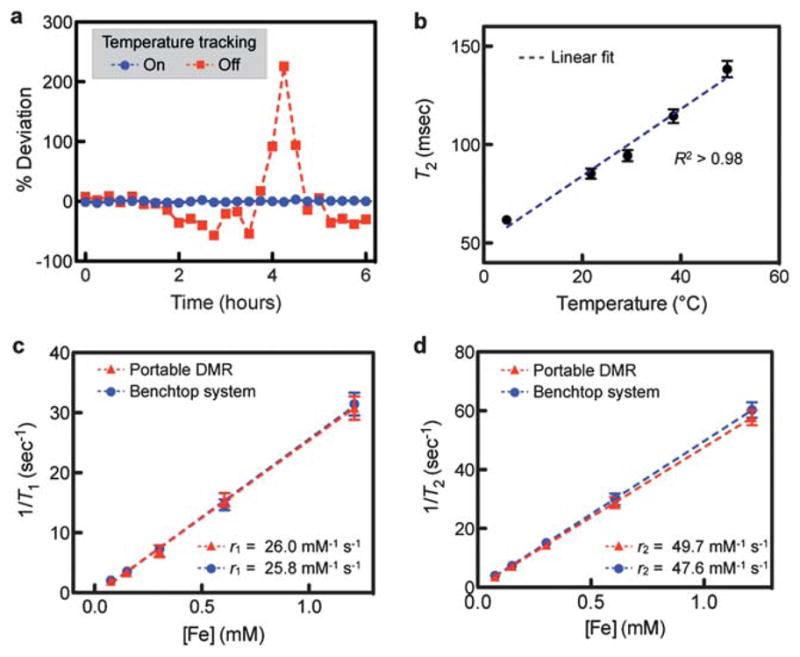
Evaluation of the new DMR-3 system. (a) The effect of temperature on DMR measurements was investigated in a room with a typical temperature fluctuation of 2 °C. With the temperature tracking off (red), T2 values of the same sample showed >200% variations. With the temperature tracking on (blue), the variations were <1%. (b) The robust DMR measurements across a range of different environmental settings (4–50 °C) were demonstrated. The reported T2 values of the same sample containing CLIO showed the expected linear dependence on temperature. (c and d) The portable DMR was benchmarked against a benchtop relaxometer. The longitudinal (T1) and the transverse (T2) relaxation times of CLIO solutions were measured, and the corresponding relaxivities (r1 and r2) were obtained. The excellent agreement between two systems confirmed the accuracy of the new DMR-3 system. All measurements were in triplicate, and the data are displayed as mean ± s.e.m. CLIO: cross-linked iron oxide nanoparticles.
The DMR-3 system was next tested in environmental settings with a wide range of temperature differences (4–50 °C). To determine the measurement accuracy, we utilized the linear dependence of T2 on temperature.21 Fig. 3b shows the T2 values of a sample measured at different environmental temperatures. For a given environment setting, the DMR system was operated with the temperature tracking on, to compensate for minute temperature variations (~1 °C). The results show a linear relationship (R2 > 98%) as theoretically predicted, demonstrating reliable measurements over a wide range of temperatures. The portable DMR thus can be utilized for robust diagnostics in various settings: medical clinics in both the developed and developing world, military settings, and in the field by emergency medical first responders.
System benchmarking
The accuracy of the portable DMR system was verified by comparing its performance to a large benchtop NMR relaxometer (Minispec mq20; Bruker) operating at a similar external field (B) of 0.47 T (Fig. 3c and d). Samples with varying amounts of CLIO were prepared, and their longitudinal (T1) and transverse (T2) relaxation times were measured, using the inverse recovery and CPMG pulse sequences, respectively. We then calculated the r1 and r2 relaxivities, the capacities of MNPs to induce T1 and T2 changes, by plotting the relaxation rates (R1 = 1/T1 and R2 = 1/T2) against metal concentrations. The measured r1 and r2 showed an excellent agreement between the portable DMR and the benchtop system, reporting statistically the same values (P > 0.4). In contrast to the benchtop equipment, however, the portable DMR system used much smaller volumes of samples (2 vs. 300 μL), and operated without using a bulky, heated container for temperature control.
DMR-based diagnostic assays
To demonstrate rapid, sensitive diagnosis of disease markers with the new DMR, we detected two representative types of targets: small molecules and bacteria. Depending on the size of the detection target, different assay modes are employed. For molecular sensing (e.g., protein in solution), the DMR assay utilizes the phenomenon of magnetic relaxation switching, in which MNPs are cross-linked with target molecules to form nanometre-scale clusters.6 For larger objects (e.g., bacteria, mammalian cells), targets are labeled with MNPs, and unbound particles are removed prior to measurements.7,9 The DMR assay is a modular platform; by modifying the functional ligands on MNPs, the same DMR system can measure many different biological targets, including small molecules,12 proteins,13 nucleic acids,14,15 pathogens,8 and cancer cells.7,10
The DMR’s capability to perform molecular detection was characterized using the avidin–biotin interaction as a model system, which was chosen for comparison with our previous results. Into the solution of biotinylated CLIO, an increasing amount of avidin was added, which led to the formation of larger particle clusters. Correspondingly, the T2 values of samples showed avidin-dose dependent decreases (Fig. 4a). The detection limit was ~140 pg (2 fmol of avidin) or 1 nM, a sensitivity similar to those previously achieved.7,17
Fig. 4.

Demonstration of sensing operations. The DMR-3 system can be used to rapidly detect various biological targets in small sample volumes (2 μL). (a) Molecular detection. When biotinylated MNPs were incubated with a varying amount of avidin, the T2 values changed in the avidin-dose dependent manner due to the formation of nanoscale clusters. For a 2 μL detection volume, the mass sensitivity limit is measured to be 140 pg (2 fmol). (b) Sensitive detection of pathogens. Using CLIO functionalized with vancomycin as a magnetic sensing agent, Staphylococcus aureus (S. aureus; inset) was detected. The detection limit was about 10 CFU (colony forming unit) in a 2 μL detection volume. All DMR detection was performed in triplicate with the temperature tracking on, and the data are displayed as mean ± s.e.m.
We next demonstrated the potential application of the portable DMR to detect pathogens in point-of-care settings. S. aureus (Fig. 4b, inset) was chosen as a model organism. For magnetic labeling, the bacterial solution was incubated with CLIO functionalized with vancomycin. The antibiotic recognizes the peptide moieties on the bacterial surface. Control samples were prepared by incubating samples with non-modified CLIO. The measured T2 changes (ΔT2) were bacterial-concentration dependent (Fig. 4b), and the portable DMR could reliably detect as few as ~10 bacteria in a 2 μL sample volume. Importantly, the DMR measurement was simpler and faster (30 minutes) than cultivation or biochemical methods.
Discussion
A new portable DMR-3 system is presented here that can reliably, sensitively and rapidly identify a range of biomarkers in realistic, point-of-care environments. The system (1) automatically tunes its measurement settings for consistent NMR readout, (2) provides an easy-to-use interface for data collection and sharing, and (3) offers sensitive and yet cost-effective diagnosis. Therefore, our detection strategy overcomes a considerable technological barrier to transfer benchtop application of DMR technology to the bedside. With such capabilities, the DMR-3 system, for example, can be an essential tool for personalized medicine by enabling the early detection of malignancies and the monitoring of treatment efficacy.3 It can also offer a much needed rapid and accurate diagnostic for infectious diseases in resource-limited settings, mitigating a huge burden in public health.5
Further work is in progress to combine the portable DMR-3 with advanced magnetic nanoparticles and fluid-handling for specific medical applications. Especially, we are interested in deploying the portable DMR for tuberculosis (TB) diagnosis. It was projected that an inexpensive tool that can rapidly detect Mycobacterium tuberculosis with high sensitivity and specificity at the primary care level could save more than 400 000 lives annually.22 The new DMR system, combined with highly magnetized nanoparticles and microfluidic-based filtration,8,23 will be a promising TB detection platform, offering sensitivity far superior to the conventional smear microscopy. Furthermore, using the new DMR-3, a diagnosis can be obtained immediately (<30 min), reducing delays in treatment and simplifying patient treatment. Additionally, the diagnosis can be easily stored and shared electronically, enabling medical decisions to be made remotely and for real-time tracking and mapping of the disease spread.
Supplementary Material
Acknowledgments
The authors gratefully thank J. MacArthur (Harvard) for his help in the implementation of DMR electronics; N. Sergeyev for CLIO synthesis; H. Shao, M. Fernandez-Suarez and S. Fortune for helpful discussions. This work is supported in part by National Institutes of Health Grants 2R01-EB004626, HHSN268201000044C, U54-CA119349, and T32-CA79443.
Footnotes
Electronic supplementary information (ESI) available.
References
- 1.Yager P, Domingo GJ, Gerdes J. Annu Rev Biomed Eng. 2008;10:107–144. doi: 10.1146/annurev.bioeng.10.061807.160524. [DOI] [PubMed] [Google Scholar]
- 2.Chin CD, Linder V, Sia SK. Lab Chip. 2007;7:41–57. doi: 10.1039/b611455e. [DOI] [PubMed] [Google Scholar]
- 3.Cheng M, Cuda G, Bunimovich Y, Gaspari M, Heath J, Hill H, Mirkin C, Nijdam A, Terracciano R, Thundat T. Curr Opin Chem Biol. 2006;10:11–19. doi: 10.1016/j.cbpa.2006.01.006. [DOI] [PubMed] [Google Scholar]
- 4.Giljohann DA, Mirkin CA. Nature. 2009;462:461–464. doi: 10.1038/nature08605. [DOI] [PMC free article] [PubMed] [Google Scholar]
- 5.Urdea M, Penny LA, Olmsted SS, Giovanni MY, Kaspar P, Shepherd A, Wilson P, Dahl CA, Buchsbaum S, Moeller G, Burgess DCH. Nature. 2006;444:73–79. doi: 10.1038/nature05448. [DOI] [PubMed] [Google Scholar]
- 6.Perez JM, Josephson L, O’Loughlin T, Hogemann D, Weissleder €R. Nat Biotechnol. 2002;20:816–820. doi: 10.1038/nbt720. [DOI] [PubMed] [Google Scholar]
- 7.Lee H, Sun E, Ham D, Weissleder R. Nat Med. 2008;14:869–874. doi: 10.1038/nm.1711. [DOI] [PMC free article] [PubMed] [Google Scholar]
- 8.Lee H, Yoon TJ, Weissleder R. Angew Chem, Int Ed. 2009;48:5657–5660. doi: 10.1002/anie.200901791. [DOI] [PMC free article] [PubMed] [Google Scholar]
- 9.Lee H, Yoon TJ, Figueiredo JL, Swirski FK, Weissleder R. Proc Natl Acad Sci U S A. 2009;106:12459–12464. doi: 10.1073/pnas.0902365106. [DOI] [PMC free article] [PubMed] [Google Scholar]
- 10.Haun JB, Devaraj NK, Hilderbrand SA, Lee H, Weissleder R. Nat Nanotechnol. 2010;5:660–665. doi: 10.1038/nnano.2010.148. [DOI] [PMC free article] [PubMed] [Google Scholar]
- 11.Gueron M. J Magn Reson. 1975;19:58–66. [Google Scholar]
- 12.Tsourkas A, Hofstetter O, Hofstetter H, Weissleder R, Josephson L. Angew Chem, Int Ed. 2004;116:2449–2453. doi: 10.1002/anie.200352998. [DOI] [PubMed] [Google Scholar]
- 13.Perez JM, Josephson L, O’Loughlin T, Högemann D, Weissleder R. Nat Biotechnol. 2002;20:816–820. doi: 10.1038/nbt720. [DOI] [PubMed] [Google Scholar]
- 14.Josephson L, Perez JM, Weissleder R. Angew Chem, Int Ed. 2001;113:3304–3306. doi: 10.1002/1521-3773(20010903)40:17<3204::AID-ANIE3204>3.0.CO;2-H. [DOI] [PubMed] [Google Scholar]
- 15.Grimm J, Perez JM, Josephson L, Weissleder R. Cancer Res. 2004;64:639–643. doi: 10.1158/0008-5472.can-03-2798. [DOI] [PubMed] [Google Scholar]
- 16.Danieli E, Perlo J, Blümich B, Casanova F. Angew Chem. 2010;49:4113–4135. doi: 10.1002/anie.201000221. [DOI] [PubMed] [Google Scholar]
- 17.Sun N, Liu Y, Lee H, Weissleder R, Ham D. IEEE J Solid-State Circuits. 2009;44:1629–1643. [Google Scholar]
- 18.Hofer DC, Kahwaty VN, Valentino CR. 4110681. US Pat. :1978.
- 19.Josephson L, Tung C, Moore A, Weissleder R. Bioconjugate Chem. 1999;10:186–191. doi: 10.1021/bc980125h. [DOI] [PubMed] [Google Scholar]
- 20.Barna J, Williams D, Stone D, Leung T, Doddrell D. J Am Chem Soc. 1984;106:4895–4902. [Google Scholar]
- 21.Gillis P, Moiny F, Brooks RA. Magn Reson Med. 2002;47:257–263. doi: 10.1002/mrm.10059. [DOI] [PubMed] [Google Scholar]
- 22.Keeler E, Perkins MD, Small P, Hanson C, Reed S, Cunningham J, Aledort JE, Hillborne L, Rafael ME, Girosi F, Dye C. Nature. 2006;444:49–57. doi: 10.1038/nature05446. [DOI] [PubMed] [Google Scholar]
- 23.Issadore D, Shao H, Chung J, Newton A, Pittet M, Weissleder R, Lee H. Lab Chip. 2011;11:147–151. doi: 10.1039/c0lc00149j. [DOI] [PMC free article] [PubMed] [Google Scholar]
Associated Data
This section collects any data citations, data availability statements, or supplementary materials included in this article.