

Abstract
The validity of Asperger disorder as a distinct syndrome from autism is unclear partly due to the paucity of differentiating neurobiological evidence. Frontal lobe cortical folding between these disorders was compared using the gyrification index. Twenty-three boys underwent structural magnetic resonance imaging: six with high-functioning autism, nine with Asperger disorder, and eight controls. Using the first coronal slice anterior to the corpus callosum, total and outer cortical contours were traced to calculate the gyrification index. This index was also calculated for superior and inferior regions to examine dorsolateral prefrontal and orbitofrontal cortices, respectively. Analysis of variance revealed differences in the left inferior gyrification index, which was higher in the autism group compared to Asperger and control groups. There were no differences in age, intelligence quotient, and brain volume. These preliminary findings suggest that cortical folding may be abnormally high in the frontal lobe in autism but not Asperger disorder, suggesting distinct frontal lobe neuropathology.
Keywords: Cortical folding, pervasive developmental disorders, gyrification index, children
INTRODUCTION
Pervasive developmental disorders are characterized by severe impairment in several areas of development including reciprocal social interaction and communication. These disorders currently include autistic disorder, Rett disorder, childhood disintegrative disorder, Asperger disorder, and pervasive developmental disorder not otherwise specified. Although recognized in the Diagnostic and Statistical Manual of Mental Disorders1 as distinct clinical entities, the diagnostic boundaries between these disorders can be quite obscure. Asperger disorder and autistic disorder are both characterized by social impairment and repetitive patterns of behaviors.1 While significant cognitive impairment and language delay must not be present for a diagnosis of Asperger disorder, a history of such deficits is essential for the diagnosis of autistic disorder, especially in individuals with high-functioning autism. Hence, in the absence of a detailed developmental history or clear information about language development, a definitive diagnosis cannot be readily made.
The similarity between Asperger disorder and high-functioning autism has fueled a controversy in the classification of pervasive developmental disorders with challenges in the distinction between the two. While the Diagnostic and Statistical Manual of Mental Disorders1 identifies the two as separate disorders, there is emerging evidence pointing to autistic disorder and Asperger disorder being on a continuum, with the latter on the end of the continuum with least impairment. This view has been challenged by the alternate perspective that they are distinct disorders with separate neurobiological underpinnings. Evidence supporting both views comes from comparative studies assessing language, communication, neuropsychological profiles, motor skills, epidemiological factors, and core symptoms.2 Based on the existing body of evidence, the validity of Asperger disorder as a distinct syndrome, separate from autistic disorder, has not yet been either conclusively established or refuted.3 Clearly, more neuropsychological and neurobiological research is needed to further elucidate the relationship between these pervasive developmental disorders.
The objective of this preliminary study was to compare the cortical gyrification pattern of the frontal lobe in individuals with high-functioning autism and Asperger disorder, using a direct quantitative measure of cortical folding known as the gyrification index. The gyrification index is a measure of the degree of cerebral convolution and is determined by analyzing coronal slices of the brain, taking the ratio between the total cortical contour and the outer cortical contour. Traditionally, it is a postmortem technique used to study ontogeny and phylogeny, serving as a measure of the brain’s complexity.4 However, the gyrification index has been incorporated into the in vivo study of neuropsychiatric disorders using magnetic resonance imaging (MRI) morphometric techniques.5 To date, a comparative study of the cortical gyrification pattern in autistic disorder and Asperger disorder has not yet been performed. The information provided by such examination may shed light on neurobiological differences between the two disorders, which could aid in assessing the validity of Asperger disorder as a separate entity from autistic disorder.
METHODS
Participants consisted of six children and adolescents with high-functioning autism, nine with Asperger disorder, and eight healthy controls. The study was confined to right-handed males because the sample size was too small to accommodate for the structural variability associated with handedness and gender. Subjects with high-functioning autism and Asperger disorder were referred to a research clinic and met the following inclusion criteria: (1) diagnosis through expert clinical evaluation and two structured research diagnostic instruments including the Autism Diagnostic Interview-Revised6 and the Autism Diagnostic Observation Schedule;7 (2) full-scale intelligence quotient (IQ) ≥70 determined using the age-appropriate version of the Wechsler Intelligence Scale;8,9 and (3) absence of any neurological disorders. Individuals who met Autism Diagnostic Interview-Revised and Autism Diagnostic Observation Schedule criteria with no early history of language abnormalities were characterized as having Asperger disorder. Controls consisted of medically healthy individuals recruited from communities through advertisements in areas socially and economically comparable to the communities from which pervasive developmental disorder subjects originated. In addition, controls were free from neuropsychiatric disorders, had full-scale IQ ≥70, and negative family histories for neurological or psychiatric disorders. After procedures were fully explained, all subjects or their legal guardians provided written informed consent, and verbal assent was obtained from all subjects. This protocol received approval from the University Institutional Review Board.
MRI scans were acquired using a General Electric (Milwaukee, Wisconsin, USA) 1.5-T Signa scanner. Imaging protocol included a 1.5-mm spoiled gradient-recalled echo in steady-state coronal series (repetition time = 35 milliseconds, echo time = 5 milliseconds, number of excitations = 1, flip angle = 45 degrees). To preserve patient anonymity, data were coded with an alpha-numeric identifier. MRI scans were analyzed using the BRAINS2 software package.10 Before analysis, all scans were aligned so the coronal plane was orthogonal to the anterior-posterior commissure line. Determining the gyrification index typically involves the manual measurement of the cortical folding patterns in multiple coronal slices, which is a very laborious process. Taking into consideration the preliminary nature of this investigation, the first frontal coronal slice anterior to the genu of the corpus callosum was used. This slice was chosen because the corpus callosum is a large and distinct landmark that is easy to visualize across all scans. The gyrification index was measured bilaterally using a novel manual tracing technique (Figures 1 and 2), which has been implemented in previously published studies.5,11 Both hemispheres were divided into superior and inferior portions, giving rise to four subregions: left superior, left inferior, right superior, and right inferior. The superior portion was taken as the upper two thirds of the brain as seen in the coronal slice. The inferior portion was taken as the lower one third of the brain.
Figure 1.
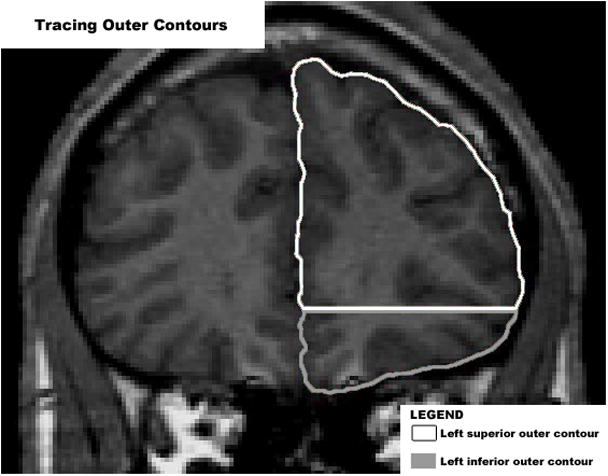
Using the first coronal slice anterior to the corpus callosum, outer cortical contours were manually traced for the computation of the gyrification index.
Figure 2.

Using the first coronal slice anterior to the corpus callosum, total cortical contours were manually traced for the computation of the gyrification index.
Total and outer contours were manually traced for each region as previously described.5,11 The outer contour was taken as the superficially exposed cortical contour (Figure 1). It was traced in close approximation to the pial surface along the outer gyral ridge while passing over the sulcal grooves. The length of the outer contour was essentially the superficial perimeter of the brain. The length of the total contour was calculated in several steps (Figure 2). First, all sulcal grooves were traced with a single line starting at the outer contour and ending at the deepest point in the groove. The total contour was then calculated by adding together the length of the outer contour and the sum of the sulcal lengths multiplied by two (multiplication by two accounts for entry to and exit from the sulcus). Buried gyri were also included in this calculation. These buried gyri had the characteristics of regular gyri except they did not communicate with the outer surface. They were traced with a single line that did not communicate with the outer contour. The total length of these single lines was also multiplied by a factor of two and included in the calculation of the total contour length. Finally, the gyrification index was computed by dividing the length of the total contour by the length of the outer contour. All measurements were performed by the same rater (R.J.), who was blind to the diagnoses of all study subjects. Reliability testing was conducted on 10 randomly selected brain scans between two raters (R.J. and L.H.) and revealed an acceptable interclass correlation coefficient of >0.90.
Measurements of total brain volume were made on a Gateway 2000 graphics workstation (North Sioux City, South Dakota, USA) using customized graphics software.12 A semi-automated thresholding procedure was used for segmenting the brain from cerebral spinal fluid and extracerebral tissue, as described elsewhere.13 Measurements were performed blind to diagnosis. Interrater reliability for obtaining brain volumes with this procedure yielded an interclass correlation coefficient of 0.99 on 10 brains.
A two-tailed statistical significance level was set at p <0.05 for all analyses. One-way analysis of variance was implemented to detect between-group differences in all variables including left inferior gyrification index, left superior gyrification index, left total gyrification index, right inferior gyrification index, right superior gyrification index, right total gyrification index, total bilateral gyrification index, total brain volume, age, verbal IQ, performance IQ, and full-scale IQ. If statistically significant, the variable in question was compared between all three groups using Student’s t test.
RESULTS
Using one-way analysis of variance, there were no significant differences in age, performance IQ, verbal IQ, full-scale IQ, or total brain volume between the three groups (Table 1). However, analysis of variance revealed group differences in gyrification index measurements (Table 2). Three of these measures approached statistical significance, including left total gyrification index, right inferior gyrification index, and total bilateral gyrification index; however, only the left inferior gyrification index reached statistical significance. No significant differences were noted in the remaining gyrification measurements including the left superior gyrification index, right superior gyrification index, and right total gyrification index. Pairwise t tests were performed for the left inferior gyrification indices (Table 3). Comparing the left inferior gyrification index, the group with high-functioning autism was significantly higher than both the Asperger and control groups. The Asperger and control groups, however, were not significantly different from each other.
Table 1.
Group comparison (ANOVA) for age, IQ, and total brain volume
| Autism (N = 6) | Asperger (N = 9) | Control (N = 8) | ANOVA | ||
|---|---|---|---|---|---|
| F | p | ||||
| Age | 12.3±2.4 (9.5–16.1) | 13.4±2.7 (10.1–17.0) | 13.0±2.5 (10.1–16.2) | 0.337 | 0.72 |
| Verbal IQ | 102.6±9.4 (91–112) | 114.7±14.9 (89–133) | 113.7±11.0 (101–121) | 1.473 | 0.27 |
| Performance IQ | 110.2±19.1 (95–133) | 114.0±14.3 (92–132) | 106.7±10.1 (95–113) | 0.269 | 0.77 |
| Full-scale IQ | 110.0±15.0 (93–130) | 112.4±16.5 (88–130) | 114.7±12.3 (89–133) | 0.178 | 0.84 |
| Total brain volume | 1433±172 (1297–1726) | 1289±101 (1121–1412) | 1366±120 (1230–1522) | 1.691 | 0.22 |
All subjects are right-handed males. ANOVA = analysis of variance; age in years; volume in ml; mean ± standard deviation, range in parenthesis
Table 2.
Group comparison (ANOVA) for all gyrification index values
| Hemisphere | Region | Autism (N = 6) | Asperger (N = 9) | Control (N = 8) | ANOVA | |
|---|---|---|---|---|---|---|
| F | p | |||||
| Left | Total | 3.09±0.17 (2.87–3.35) | 2.93±0.19 (2.72–3.18) | 2.88±0.08 (2.71–3.00) | 3.097 | 0.067 |
| Superior | 3.00±0.22 (2.71–3.24) | 2.94±0.22 (2.68–3.27) | 2.88±0.10 (2.75–3.04) | 0.697 | 0.510 | |
| Inferior | 3.23±0.29 (2.85–3.73) | 2.93±0.20 (2.59–3.28) | 2.90±0.17 (2.55–3.13) | 4.492 | 0.024 | |
| Right | Total | 3.10±0.15 (2.89–3.31) | 2.93±0.25 (2.57–3.37) | 2.97±0.10 (2.83–3.08) | 1.481 | 0.251 |
| Superior | 3.03±0.15 (2.83–3.25) | 2.91±0.41 (2.34–3.65) | 2.93±0.14 (2.73–3.17) | 0.364 | 0.699 | |
| Inferior | 3.21±0.23 (2.90–3.50) | 2.98±0.20 (2.68–3.33) | 3.05±0.12 (2.84–3.24) | 2.679 | 0.093 | |
| Total bilateral (Left + Right) | 3.09±0.14 (2.91–3.22) | 2.93±0.19 (2.66–3.27) | 2.93±0.06 (2.86–2.98) | 2.815 | 0.084 | |
All subjects are right-handed males. ANOVA = analysis of variance; mean ± standard deviation, range in parenthesis; bold print indicates statistical significance at p <0.05
Table 3.
Pairwise t tests for left inferior gyrification index values
| GROUP (Mean GI±SD) | Autism (3.23±0.29) | Asperger (2.93±0.20) | Control (2.90±0.17) |
|---|---|---|---|
| Autism (3.23±0.29) | NA | t = 2.36, df = 13 p = 0.035 | t = 2.62, df = 12 p = 0.022 |
| Asperger (2.93±0.20) | t = 2.36, df = 13 p = 0.035 | NA | t = −0.28, df = 15 p = 0.781 |
| Control (2.90±0.17) | t = 2.62, df = 12 p = 0.022 | t = −0.28, df = 15 p = 0.781 | NA |
GI = gyrification index, SD = standard deviation, NA = not applicable; bold print indicates statistical significance at p <0.05
DISCUSSION
A limited number of reports exist in the medical literature directly comparing individuals with autistic disorder and Asperger disorder using neuroanatomical measures. Findings of this preliminary study indicate the possible existence of left frontal lobe hypergyria in children and adolescents with high-functioning autism but not Asperger disorder. Interestingly, this increased gyrification is most prominent in the inferior frontal regions (e.g., Broca’s area), which are involved in language production, and is supported by evidence for fundamental differences in language and communication in individuals with autistic disorder when compared to those with Asperger disorder.14,15 The observed differences between the high-functioning autism group when compared to the Asperger and control groups, combined with the apparent similarities of the Asperger and control groups, may support the hypothesis that high-functioning autism and Asperger disorder represent distinct neuropsychiatric disorders with overlapping behavioral and cognitive symptoms.
The results of this investigation are consistent with other neurobiological and clinical studies supporting that Asperger disorder is a distinct disorder separate from autistic disorder. Clinical studies have shown that individuals with autistic disorder and Asperger disorder differ in neuropsychological profiles,16,17 motor skills,16,18 overall prognosis,19 and extent of core symptoms.14,19 Additionally, there is also support from family studies that Asperger disorder may be genetically different from autistic disorder,18 with genetic factors playing a more obvious role in Asperger disorder than in autistic disorder.20
In contrast, there is considerable evidence supporting the similarity between high-functioning autism and Asperger disorder. Neuropathological investigations of a small sample of individuals with Asperger disorder described abnormalities in minicolumn organization similar to the pathology reported in autism.21,22 Gillberg and de Souza reported macrocephaly in subjects with Asperger disorder using head circumference data,23 which is consistent with studies of individuals with autism.24 Lotspeich and colleagues reported that gray matter volume in Asperger disorder was intermediate between those with high-functioning autism and healthy controls.25 This is consistent with the assertion that Asperger disorder exists on the mild end of the autism spectrum and that cerebral gray matter volume increases with the severity of the developmental disability. Finally, clinical investigations have also reported no significant differences between individuals with autistic and Asperger disorders on neuropsychological measures including executive function and motor ability.17,26–28
The findings in this preliminary study must be interpreted in the context of several methodological limitations. First, the sample size is very small, especially for a three-group comparison. Second, the examination was limited to the coronal slice immediately anterior to the corpus callosum, making it difficult to draw final conclusions about the cortical folding of the entire prefrontal cortex. Finally, cortical contours were approximated by a manual tracing technique that is different from the gold standard postmortem method for measuring the gyrification index.4 Therefore, while the findings reported in this preliminary investigation are promising, final conclusions cannot yet be made about different cortical folding patterns between these related developmental disorders. Future studies examining regional differences in cortical folding between autistic and Asperger disorders should implement substantially larger sample sizes across all groups, examining multiple areas spanning the entire prefrontal cortex. They should also include the application of novel morphometric software to closely emulate the gold standard postmortem technique4 for determining the gyrification index.
Acknowledgments
Data presented in this study were collected using facilities associated with the University of Pittsburgh School of Medicine (Pittsburgh, Pennsylvania, USA). The authors acknowledge the help of Ms Lucy Harrison (L.H.) for reliability testing, and gratefully acknowledge the effort and commitment of the participants and their families in this study.
FUNDING
This work was supported in part by National Institute of Mental Health grant MH064027 (Dr Hardan) and by National Institute of Neurological Disorders and Stroke grant NS033355 (Dr Minshew) and National Institute of Child Health and Human Development Collaborative Program of Excellence in Autism grant HD035469 (Dr Minshew).
Footnotes
This article appeared in a journal published by Sage. The attached copy is furnished for non-commercial research and education use. Other uses, including reproduction and distribution, or selling or licensing copies, or posting to personal, institutional or third party websites are prohibited.
REFFERENCES
- 1.American Psychiatric Association. Diagnostic and Statistical Manual of Mental Disorders. 4. Washington, DC: American Psychiatric Association; 2000. (text rev) [Google Scholar]
- 2.Macintosh KE, Dissanayake C. Annotation: the similarities and differences between autistic disorder and Asperger’s disorder. A review of the empirical evidence. J Child Psychol Psychiatry. 2004;45:421–434. doi: 10.1111/j.1469-7610.2004.00234.x. [DOI] [PubMed] [Google Scholar]
- 3.Volkmar FR, Klin A, Schultz RT, et al. Asperger’s disorder. Am J Psychiatry. 2000;157:262–267. doi: 10.1176/appi.ajp.157.2.262. [DOI] [PubMed] [Google Scholar]
- 4.Zilles K, Armstrong E, Schleicher A, Kretschmann HJ. The human pattern of gyrification in the cerebral cortex. Anat Embryol. 1988;179:173–179. doi: 10.1007/BF00304699. [DOI] [PubMed] [Google Scholar]
- 5.Jou RJ, Hardan AY, Keshavan MS. Reduced cortical folding in individuals at high risk for schizophrenia: a pilot study. Schizophr Res. 2005;75:309–313. doi: 10.1016/j.schres.2004.11.008. [DOI] [PubMed] [Google Scholar]
- 6.Lord C, Rutter M, Le Couteur A. Autism Diagnostic Interview-Revised: a revised version of a diagnostic interview for caregivers of individuals with possible pervasive developmental disorders. J Autism Dev Disord. 1994;24:659–685. doi: 10.1007/BF02172145. [DOI] [PubMed] [Google Scholar]
- 7.Lord C, Rutter M, Goode S, et al. Autism Diagnostic Observation Schedule: a standardized observation of communicative and social behavior. J Autism Dev Disord. 1989;19:185–212. doi: 10.1007/BF02211841. [DOI] [PubMed] [Google Scholar]
- 8.Wechsler D. Wechsler Intelligence Scale for Children. 3. San Antonio, Texas: Psychological Corporation; 1991. [Google Scholar]
- 9.Wechsler D. Wechsler Adult Intelligence Scale. 3. San Antonio, Texas: Psychological Corporation; 1997. [Google Scholar]
- 10.Magnotta VA, Harris G, Andreasen NC, et al. Structural MR image processing using the BRAINS2 toolbox. Comput Med Imaging Graph. 2002;26:251–264. doi: 10.1016/s0895-6111(02)00011-3. [DOI] [PubMed] [Google Scholar]
- 11.Hardan AY, Jou RJ, Keshavan MS, et al. Increased frontal cortical folding in autism: a preliminary MRI study. Psychiatry Res. 2004;131:263–268. doi: 10.1016/j.pscychresns.2004.06.001. [DOI] [PubMed] [Google Scholar]
- 12.Aylward EH, Anderson NB, Bylsma FW, et al. Frontal lobe volume in patients with Huntington’s disease. Neurology. 1998;50:252–258. doi: 10.1212/wnl.50.1.252. [DOI] [PubMed] [Google Scholar]
- 13.White T, Andreasen NC, Nopoulos P, Magnotta V. Gyrification abnormalities in childhood-and adolescent-onset schizophrenia. Biol Psychiatry. 2003;54:418–426. doi: 10.1016/s0006-3223(03)00065-9. [DOI] [PubMed] [Google Scholar]
- 14.Eisenmajer R, Prior M, Leekam S, et al. Comparison of clinical symptoms in autism and Asperger’s disorder. J Am Acad Child Adolesc Psychiatry. 1996;35:1523–1531. doi: 10.1097/00004583-199611000-00022. [DOI] [PubMed] [Google Scholar]
- 15.Ghaziuddin M, Gerstein L. Pedantic speaking style differentiates Asperger syndrome from high-functioning autism. J Autism Dev Disord. 1996;26:585–595. doi: 10.1007/BF02172348. [DOI] [PubMed] [Google Scholar]
- 16.Klin A, Volkmar FR, Sparrow SS, et al. Validity and neuropsychological characterization of Asperger syndrome: convergence with nonverbal learning disabilities syndrome. J Child Psychol Psychiatry. 1995;36:1127–1140. doi: 10.1111/j.1469-7610.1995.tb01361.x. [DOI] [PubMed] [Google Scholar]
- 17.Manjiviona J, Prior M. Comparison of Asperger syndrome and high-functioning autistic children on a test of motor impairment. J Autism Dev Disord. 1995;25:23–39. doi: 10.1007/BF02178165. [DOI] [PubMed] [Google Scholar]
- 18.Rinehart NJ, Bradshaw JL, Brereton AV, Tonge BJ. A clinical and neurobehavioural review of high-functioning autism and Asperger’s disorder. Aust N Z J Psychiatry. 2002;36:762–770. doi: 10.1046/j.1440-1614.2002.01097.x. [DOI] [PubMed] [Google Scholar]
- 19.Szatmari P, Archer L, Fisman S, et al. Asperger’s syndrome and autism: differences in behavior, cognition, and adaptive functioning. J Am Acad Child Adolesc Psychiatry. 1995;34:1662–1671. doi: 10.1097/00004583-199512000-00017. [DOI] [PubMed] [Google Scholar]
- 20.Volkmar FR, Klin A, Pauls D. Nosological and genetic aspects of Asperger syndrome. J Autism Dev Disord. 1998;28:457–461. doi: 10.1023/a:1026012707581. [DOI] [PubMed] [Google Scholar]
- 21.Casanova MF, Buxhoeveden DP, Switala AE, Roy E. Asperger’s syndrome and cortical neuropathology. J Child Neurol. 2002;17:142–145. doi: 10.1177/088307380201700211. [DOI] [PubMed] [Google Scholar]
- 22.Casanova MF, van Kooten IA, Switala AE, et al. Minicolumnar abnormalities in autism. Acta Neuropathol. 2006;112:287–303. doi: 10.1007/s00401-006-0085-5. [DOI] [PubMed] [Google Scholar]
- 23.Gillberg C, de Souza L. Head circumference in autism, Asperger syndrome, and ADHD: a comparative study. Dev Med Child Neurol. 2002;44:296–300. doi: 10.1017/s0012162201002110. [DOI] [PubMed] [Google Scholar]
- 24.Piven J, Arndt S, Bailey J, et al. An MRI study of brain size in autism. Am J Psychiatry. 1995;152:1145–1149. doi: 10.1176/ajp.152.8.1145. [DOI] [PubMed] [Google Scholar]
- 25.Lotspeich LJ, Kwon H, Schumann CM, et al. Investigation of neuroanatomical differences between autism and Asperger syndrome. Arch Gen Psychiatry. 2004;61:291–298. doi: 10.1001/archpsyc.61.3.291. [DOI] [PubMed] [Google Scholar]
- 26.Bowler DM, Matthews NJ, Gardiner JM. Asperger’s syndrome and memory: similarity to autism but not amnesia. Neuropsychologia. 1997;35:65–70. doi: 10.1016/s0028-3932(96)00054-1. [DOI] [PubMed] [Google Scholar]
- 27.Klin A. Attributing social meaning to ambiguous visual stimuli in higher-functioning autism and Asperger syndrome: the Social Attribution Task. J Child Psychol Psychiatry. 2000;41:831–846. [PubMed] [Google Scholar]
- 28.Miller JN, Ozonoff S. The external validity of Asperger disorder: lack of evidence from the domain of neuropsychology. J Abnorm Psychol. 2000;109:227–238. [PubMed] [Google Scholar]