Abstract
Accelerated molecular dynamics (aMD) is an enhanced-sampling method that improves the conformational space sampling by reducing energy barriers separating different states of a system. Here we present the implementation of aMD in the parallel simulation program NAMD. We show that aMD simulations performed with NAMD have only a small overhead compared with classical MD simulations. Through example applications to the alanine dipeptide, we discuss the choice of acceleration parameters, the interpretation of aMD results, as well as the advantages and limitations of the aMD method.
Introduction
Molecular dynamics (MD) is a widely used technique in the field of computational biology. Through integration of the Newtonian equations of motion, trajectories of individual atoms are calculated in a MD simulation, from which thermodynamic properties can be obtained using the principles of statistical mechanics. While MD has been successfully applied to study a wide range of biological and chemical problems (1–5), there remains a substantial gap between the timescale of current MD simulations, often on the order of tens to hundreds of nanoseconds, and the timescale of typical biological processes, usually many microseconds, milliseconds, or longer. In order to bridge this gap, various enhanced sampling techniques have been proposed to expedite the sampling of an MD simulation, which often involve modifying the energy landscape of a system to speed up its transitions between different states. Such methods include, for example, conformational flooding (6, 7), hyperdynamics (8, 9), metadynamics (10, 11), and the adaptive biasing force method (12–14). Accelerated molecular dynamics (aMD) (15), inspired by earlier work of Voter (8, 9), also belongs to the class of enhanced sampling methods.
In its original form (15), the aMD method modifies the potential energy landscape by raising energy wells that are below a certain threshold level, while leaving those above this level unaffected. As a result, barriers separating adjacent energy basins are reduced, allowing the system to sample conformational space that cannot be easily accessed in a classical MD (cMD) simulation. aMD was first implemented in the program AMBER (15) and has been applied in the study of several peptide and protein systems (16–22). Here, we describe the implementation of aMD in the parallel MD program NAMD (23), which can be freely downloaded from the official NAMD website (www.ks.uiuc.edu/Research/namd/). We also provide example applications to a model peptide, N-acetyl-N'-methyl-alaninamide, often referred to as alanine dipeptide. Through simulations of this model system in both the gas phase and the fully solvated state, we discuss the choice of aMD parameters and comment on the advantages and limitations of the method. Our results should provide the basis for future aMD development and application studies using the NAMD program.
Methods
Theory
In the original form of aMD (15), when the system’s potential energy falls below a threshold energy, E, a bias potential is added, such that the modified potential, V*(r), is related to the original potential, V (r), via
| (1) |
where ΔV (r) is the boost potential,
| (2) |
In the above equation, E is the threshold energy specified by the user, which controls the portion of the potential surface affected by the bias. The acceleration factor α determines the shape of the modified potential: the smaller α, the more flattened the energy surface becomes. As α increases, the modified potential asymptotically approaches the original potential; as α decreases, the energy surface below E begins to resemble a constant potential. Note that α cannot be set to zero, as in this case the derivative of the modified potential becomes discontinuous (15).
From an aMD simulation, the ensemble average, 〈A〉, of an observable, A(r), can be calculated using the following reweighting procedure:
| (3) |
| (4) |
| (5) |
| (6) |
in which β=1=kBT, where kB is the Boltzmann constant, T is the temperature, and 〈…〉 and 〈…〉* represent the ensemble average in the original (unbiased) and the aMD (biased) ensembles, respectively.
In this work, we used the above reweighting equation to obtain the free energy profiles of alanine dipeptide Φ-Ψ dihedrals. A 2D histogram was constructed with a bin width of 15° using the program VMD (24). An indicator function, δkij, denotes whether the Φ-Ψ dihedrals of the peptide fall in the bin (Φi, Ψj) at snapshot k,
| (7) |
The reweighted histogram at bin (Φi, Ψj) is then given by
| (8) |
where K is the total number of snapshots, and ΔVk is the boost potential at snapshot k. The histogram of cMD simulations can be obtained using the same equation by setting the boost potential to zero. The Φ-Ψ free energy profile is then determined by
| (9) |
where W0 is an arbitrary constant. In this work, W0 was chosen such that the minimum of the free energy profiles was set to zero.
Implementation
Since protein conformational changes tend to be governed by changes in the torsional degrees of freedom, the aMD method was first applied to boost the dihedral potential (15). Later studies extended the method to boost the total potential (25) or both the dihedral and total potential (26). In this work, we implemented two modes of aMD: boosting the dihedral potential (aMDd) or boosting the total potential (aMDT). The aMD implementation, which is based on the upcoming 2.8 release of the NAMD program (23), involves two major modifications of the source code: 1) adding a new reduction class, and 2) adding a new force class for the aMDd mode. The new reduction class, which enables the aMD module to access the system's potential energy right after the force evaluation, separates the aMD routine from that of regular MD, where energy reduction is performed at the end of each timestep. This implementation allows minimal interference between the aMD module and the rest of the program, and guarantees that no performance loss is seen when the aMD option is turned off. The additional force array for the aMDd mode may slightly increase the memory cost, but otherwise has a small impact on the efficiency of the program.
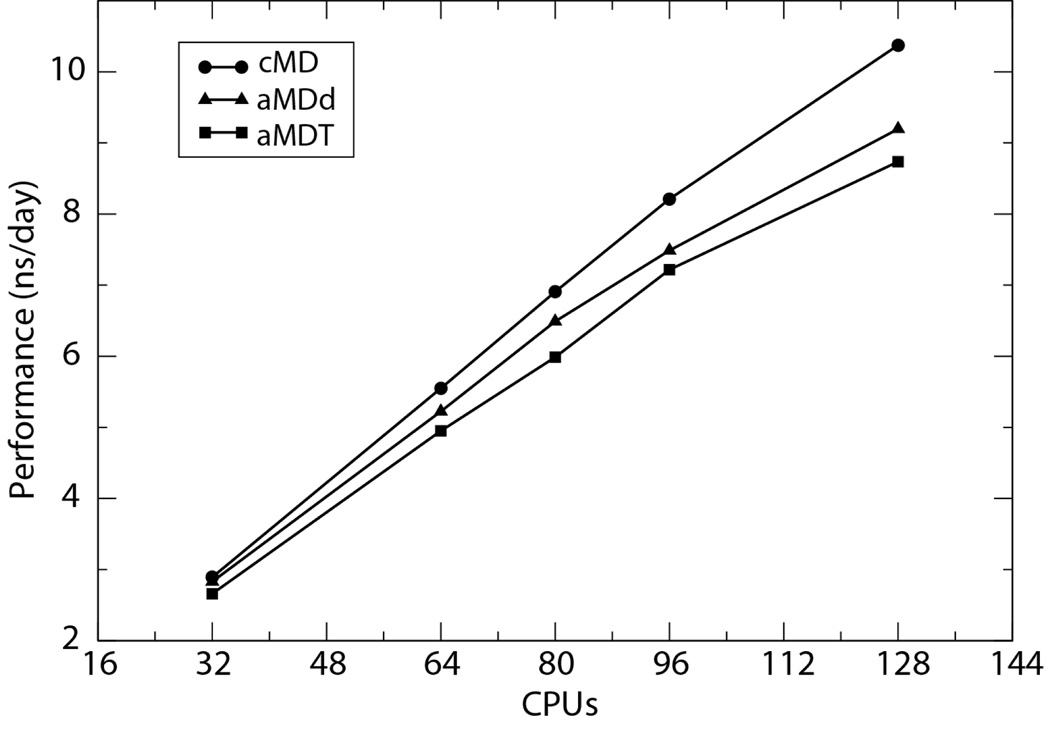
Benchmark simulations on a system of ~60,000 atoms indicate that aMD simulations give performance similar to cMD simulations, although the scaling performance drops more rapidly in aMD as the number of processors increases (Fig 1). A complete list of aMD parameters and more benchmark information are included in the supplementary material. On average, aMDd simulations have a 7% slowdown in comparison to cMD simulations, while a 12% loss in performance is observed in aMDT simulations. This additional performance loss is partly caused by the more frequent long-range interaction energy calculations in the aMDT mode: in both cMD and aMDd simulations, the long-range interaction energy is only calculated when a user-specified number of steps, controlled by the parameter “outputEnergies”, is reached. Such an optimization strategy has to be abandoned in aMDT simulations, which require the system’s total potential energy at every timestep.
Figure 1.
Performance of aMD simulations on a ~60,000-atom system. The simulations were performed on the supercomputer Ranger at the Texas Advanced Computing Center using 2, 4, 5, 6, and 8 nodes, respectively. Each node on Ranger consists of four quad-core AMD opteron processors (16 CPUs).
Alanine dipeptide simulation protocols
We performed cMD and aMD simulations for both gas-phase and solvated alanine dipeptide (Fig 2 a) using the CHARMM force field with CMAP correction (27, 28). A timestep of 1 fs and a large cutoff distance (30Å) were employed for the gas-phase system, the latter of which ensures that all electrostatic interactions were calculated using direct Coulombic summation. The fully solvated alanine dipeptide system, consisting of 475 TIP3P water molecules in a 24×24×24Å3 box, was simulated using a timestep of 2 fs, with bonds involving hydrogens in the peptide constrained using RATTLE (29) and water geometries maintained using SETTLE (30). The multiple-time-stepping algorithm was used, with short-range forces calculated every step and long-range electrostatics calculated every 2 steps using the Particle Mesh Ewald (PME) method (31). The cutoff for short-range non-bonded interactions was set to 12Å, with a switching distance of 10Å. The temperature of both gas-phase and solvated alanine dipeptide system was maintained at 300K using Langevin dynamics. The solvated alanine dipeptide was first simulated under constant pressure (1 atm) for 1 ns, the end structure of which was then used in subsequent cMD and aMD simulations performed in the NVT ensemble.
Figure 2.
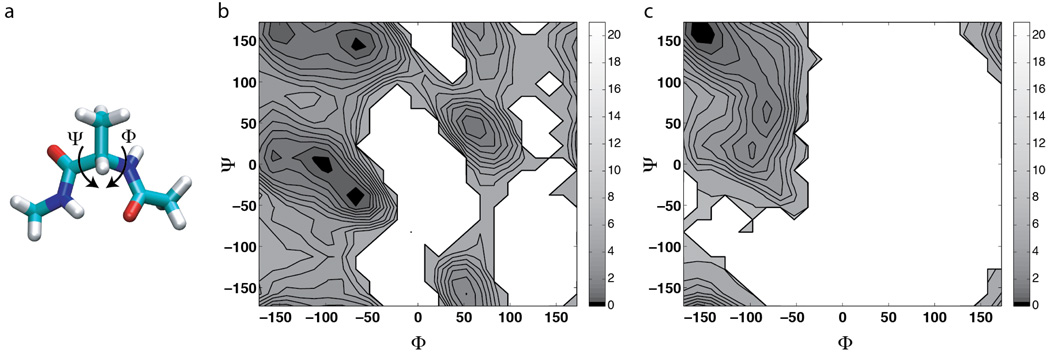
Alanine dipeptide and the Φ-Ψ free energy maps. (a) The Φ-Ψ dihedrals of an alanine dipeptide. (b) Φ-Ψ free energy map of the solvated alanine dipeptide from a 100-ns cMD simulation. (c) Φ-Ψ free energy map of the gas-phase alanine dipeptide from a 250-ns cMD simulation. Contour lines are drawn every 0.5 kcal/mol for energy values between 0 and 5 kcal/mol, and every 2 kcal/mol for values between 5 and 21 kcal/mol.
After completion of the cMD simulation of solvated alanine dipeptide, we used the average dihedral energy (~3 kcal/mol) of the system to determine the acceleration level for aMD simulations. Altogether twelve aMDd simulations and one cMD simulation (100 ns each) were performed for the solvated alanine dipeptide. Twelve aMDd simulations at the same acceleration levels and one cMD simulation (250 ns each) were performed for the gas-phase alanine dipeptide. A sample NAMD configuration file for an aMD simulation of the solvated alanine dipeptide is included in the supplementary material.
Results and Discussion
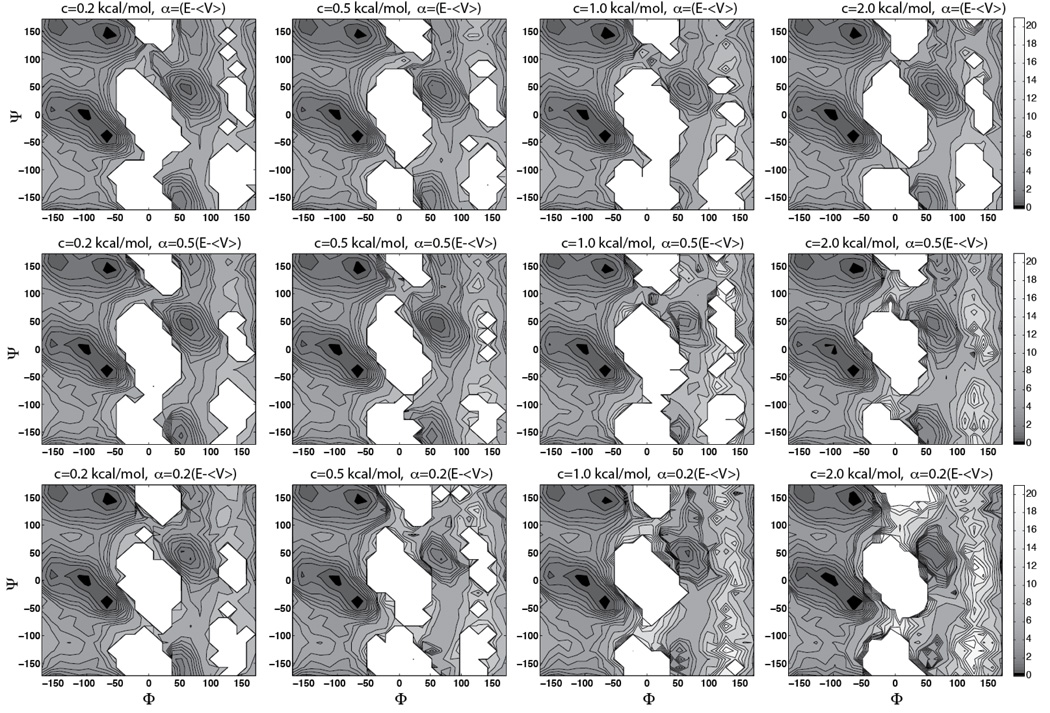
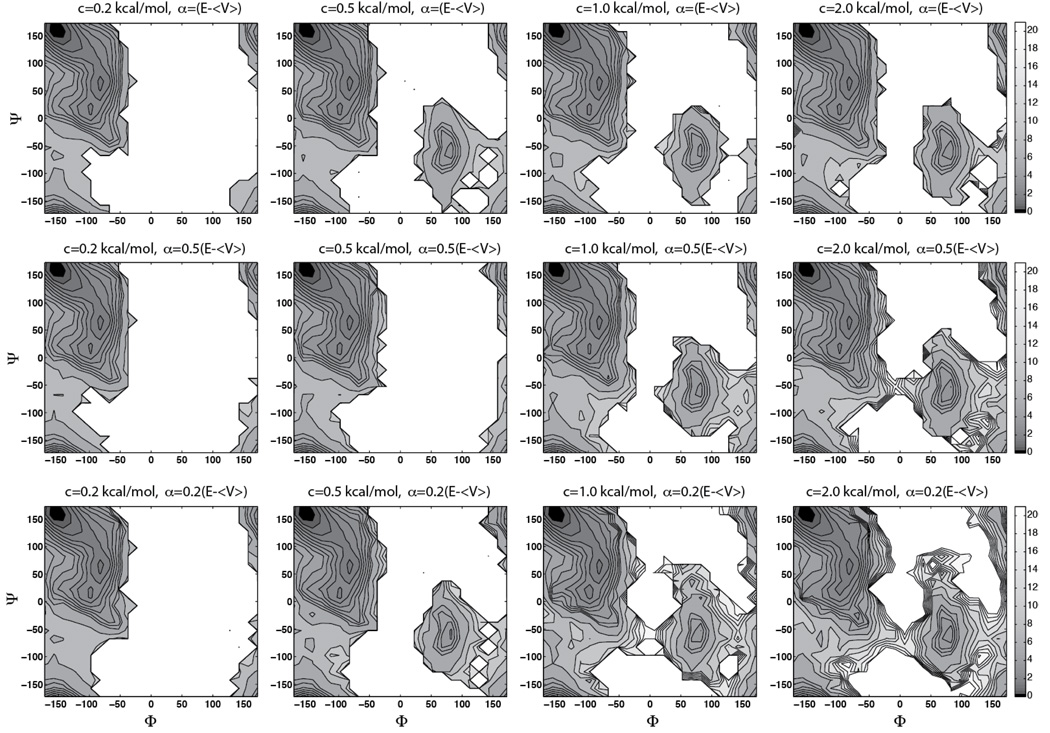
As a canonical representation of protein backbone conformations, the Φ-Ψ dihedrals of alanine dipeptide (Fig 2) have been studied using multiple simulation approaches ((14) and references therein). Despite the simplicity of the system, sampling of the entire Φ-Ψ space is non-trivial for a cMD simulation. To achieve sufficient sampling and ensure convergence, we performed a 100-ns cMD simulation of the solvated alanine dipeptide at 300 K. Twelve 100-ns aMDd simulations were carried out under the same conditions with the acceleration threshold energy E set to 〈V〉 + cN. Here, 〈V〉 represents the average dihedral energy of the system during a cMD simulation, N = 22 is the number of peptide atoms, and c is a constant set to 0.2 kcal/mol, 0.5 kcal/mol, 1.0 kcal/mol, and 2.0 kcal/mol, respectively (see Fig 3). The acceleration factor α was set to 0.2 (E − 〈V〉), 0.5(E − 〈V〉), and E − 〈V〉, respectively. These values were chosen to examine the empirical formula proposed by previous aMD studies using the AMBER force field (32), where E and α were determined using similar equations (15, 17–19, 33). Compared with the solvated alanine dipeptide, sampling of Φ-Ψ space is more challenging in the gas phase, due to stronger intramolecular hydrogen bond interactions (14). Therefore, we performed a 250-ns cMD simulation for the peptide in vacuum, along with twelve 250-ns aMDd simulations using the same acceleration levels mentioned above (Fig 4). All the simulations were performed using the CHARMM force field with CMAP correction (27, 28).
Figure 3.
Φ-Ψ free energy maps of the solvated alanine dipeptide calculated from aMDd simulations. The average dihedral energy of alanine dipeptide in a cMD simulation (〈V〉 =~3 kcal/mol) was used to guide the selection of acceleration levels: the acceleration threshold energy E was set to 〈V〉 + cN, where N = 22 is the number of peptide atoms, and c is set to 0.2 kcal/mol, 0.5 kcal/mol, 1.0 kcal/mol, and 2.0 kcal/mol, respectively. The acceleration factor α was set to 0:2(E − 〈V〉), 0.5(E − 〈V〉), and E − 〈V〉, respectively. Contour line spacing as in Fig 2.
Figure 4.
Φ-Ψ free energy maps of the gas-phase alanine dipeptide calculated from aMDd simulations. The same acceleration levels were used as for the solvated alanine dipeptide simulations (in Fig 3). Contour line spacing as in Fig 2. The energy basins C7eq and C7ax correspond to the regions around (−160°; 160°) and (80°;−60°), respectively.
Comparison of aMD and cMD simulations
As shown in Fig 2, the Φ-Ψ free energy maps of alanine dipeptide exhibit distinct features in the solvated state and the gas phase: the presence of water weakens the intramolecular electrostatic interactions, allowing the peptide to sample more torsional space in the solvated state. In the gas-phase cMD simulation, only 39% of the Φ-Ψ space was sampled; while in the solvated state, the peptide sampled 75% of the Φ-Ψ space. Comparison of the aMD and cMD results shows that most aMD simulations reproduced well the free energy maps in the Φ-Ψ regions sampled by cMD simulations (Fig 3 and Fig 4). In addition, enhanced sampling was achieved in all aMD simulations, with the “amount” of extra sampling depending on the acceleration parameters: aMD sampled 80–90% of the Φ-Ψ space in the solvated system,and 44–84% in the gas-phase alanine dipeptide.
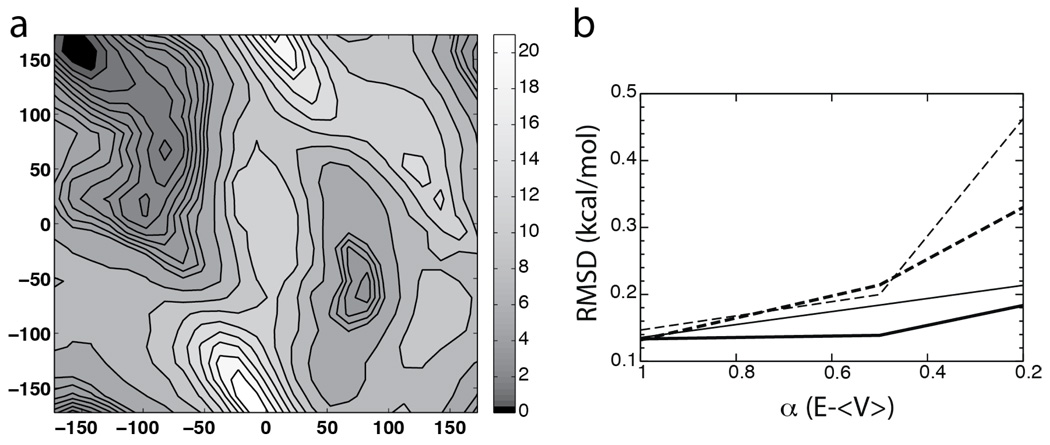
For the gas-phase alanine dipeptide, in addition to the main basin around (−160°, 160°) sampled in the cMD simulation, most aMD simulations were able to sample a second energy basin at (80°,−60°). These two energy basins correspond to the C7eq and C7ax conformations of the alanine dipeptide, respectively (28). As the cMD simulation only sampled the C7eq conformation, to obtain a better reference for comparison with aMD results, we performed a 100-ns metadynamics (10, 11) calculation using the collective variable module recently implemented in NAMD (14). Details of the metadynamics simulation is given in the supplementary material. The resulting free energy map (Fig 5 a), which agrees well with cMD and aMD simulations in regions near the main energy basin, also confirms the second energy basin observed in aMD simulations. To quantify this comparison, we calculated the root-mean-square deviation (RMSD) of aMD free energy profiles with reference to the metadynamics result. Regions in the metadynamics Φ-Ψ map with a free energy value below 5 kcal/mol were used as the reference for RMSD calculations. As shown in Fig 5 b, the overall agreement between the aMD and metadynamics results is reflected by the relatively small RMSD values (0.13 to 0.46 kcal/mol).
Figure 5.
Metadynamics simulation for gas-phase alanine dipeptide. (a) The metadynamics Φ-Ψ free energy map with a resolution of 15°. (b) The RMSD values of aMD simulations with reference to the metadynamics result (see text). The four acceleration threshold energy levels with c = 0.2 kcal/mol, c = 0.5 kcal/mol, c = 1.0 kcal/mol, and c = 2.0 kcal/mol are indicated by thick solid lines, thin solid lines, thick dashed lines and thin dashed lines, respectively.
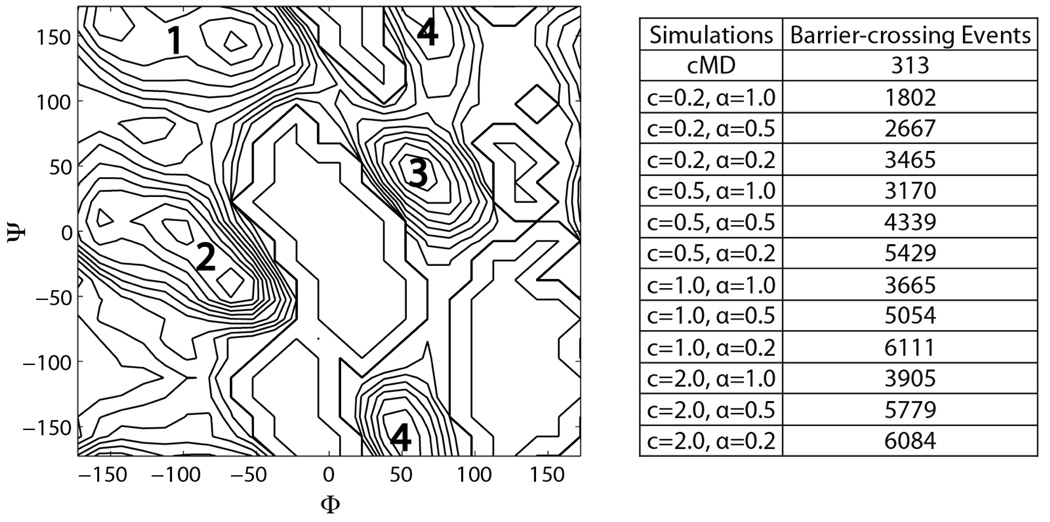
Compared with the gas phase, the enhanced sampling of aMD is less evident in the solvated alanine dipeptide, since the cMD simulation has already produced decent sampling of the Φ-Ψ space (Fig 2 b). Nevertheless, more barrier-crossing events were recorded in the aMD simulations than the cMD simulation: as shown in Fig 6 a, four major energy basins can be identified in the solvated state, located near (−65°, 145°), (−65°,−45°), (60°, 50°), and (50°,−160°), respectively. Quantitatively, these regions are defined as energy basins in the cMD Φ- Ψ free energy map with a value less than 3kcal/mol. A barrier-crossing event is recorded when the peptide switches from one energy basin to another during a simulation. As listed in Fig 6 b, aMD simulations produced up to 19 times more barrier-crossing events than the cMD simulation, suggesting that the conformational space sampling was expedited in aMD. In addition, aMD simulations with higher acceleration levels, i.e., larger E and smallerα, produced more barrier-crossing events, consistent with the results of earlier studies (16, 17).
Figure 6.
Barrier crossing events in cMD and aMD simulations of the solvated alanine dipeptide. (a) The four regions in alanine dipeptide Φ-Ψ free energy map used to define barrier-crossing events: region 1 (−65°, 145°), region 2 (−65°, −45°), region 3 (60°, 50°), and region 4 (50°, −160°). Region 4 includes Ψ angles across the 180°/−180° boundary. (b) Numbers of barrier-crossing events in cMD and aMD simulations. The aMD simulation parameters c and α are in the units of kcal/mol and (E − 〈V〉), respectively.
Choosing aMD parameters
In both solvated and gas-phase alanine dipeptide, higher acceleration levels, e.g., larger E and smallerα, tend to result in higher “amount” of sampling, while lower acceleration levels can reduce the aMD sampling performance. This relation between aMD parameters and sampling performance, which can be expected from the aMD formula, has been demonstrated by previous aMD studies (15, 18). However, it is worth noting that the behavior of an individual aMD simulation may not always follow this general relation. For instance, with c = 0.5 kcal/mol and α = 0.5(E − 〈V〉), the aMD simulation of the gas-phase alanine dipeptide did not sample the second energy basin at (80°,−60°) (Fig 4). This result reflects the stochastic nature of aMD simulations, i.e., although the probability of achieving enhanced sampling increases with higher acceleration levels, the behavior of individual aMD simulations may occasionally deviate from this relation. Indeed, repeating the above aMD simulation, we observed the sampling of the second energy basin in this replica simulation (Fig S1).
In both solvated and gas-phase alanine dipeptide, while the sampling of Φ-Ψ space is enhanced with higher acceleration levels, the statistical uncertainty of the results tends to increase as well. As discussed in previous aMD studies (34), the statistical noise is mainly caused by the exponential terms of ΔV involved in the reweighting process (Eq 6), which significantly amplifies the uncertainty in the boost potential. As a result, the free energy profiles from aMD simulations become more noisy with larger E and smaller α, which can be observed in both solvated and gas-phase aMD simulations (Fig 3 and Fig 4). Comparison with the metadynamics result shows that higher acceleration levels tend to produce larger RMSD values (Fig 5 b). In all aMD simulations, α = 0.2(E −〈V〉) gives the largest RMSD values, and α = E − 〈V〉 gives on average the smallest RMSD.
Overall, the optimal combination of E and α represents a tradeoff between the statistical uncertainty and the sampling performance of an aMD simulation. In the alanine dipeptide simulations, the parameter set c = 0.5 kcal/mol and α = E − 〈V〉 provides enhanced sampling in both gas-phase and solvated-state simulations, with relatively low statistical uncertainty. It is noteworthy that when α is the largest, i.e., α = E − 〈V〉, the increase in E introduces the smallest additional statistical noise: changing c from 0.2 to 0.5 kcal/mol in E = 〈V〉 + cN for the gas-phase simulation allowed the sampling of the second energy basin, while the RMSD compared with the metadynamics result is roughly the same in both aMD simulations (RMSD=~0.13kcal/mol). This result suggests that a useful strategy to find optimal aMD parameters is to screen the threshold energy values while keeping the acceleration factor α constant at a relatively high level.
Advantages and limitations of aMD
As discussed earlier, the exponential averages involved in the reweighting process (Eq. 6) tend to introduce large statistical uncertainties in the aMD results. This issue may be particularly problematic for large proteins, where high acceleration levels may be required to facilitate the system’s escape from the initial state. Several methods have been proposed to resolve this issue, including cumulant expansion (34) and replica exchange aMD (35, 36). Another direction that is being actively pursued is to apply the boost potential to a selective part of the system, which can lower the acceleration level required to achieve enhanced sampling in an aMD simulation (37).
As indicated by the different areas of Φ-Ψ space sampled in the gas-phase aMD (Fig 4) and metadynamics (Fig 5) simulations, while aMD provides enhanced sampling compared to cMD, it’s clearly less efficient in generating the Φ-Ψ free energy map compared with metadynamics. An important difference between the two methods is the usage of a predefined reaction coordinate, which, in this work, is the Φ-Ψ dihedrals of the alanine dipeptide. In aMD, the free energy profile is calculated through post-processing aMD trajectories and collecting statistics along a “post-defined” reaction coordinate. Compared with metadynamics, where a reaction coordinate is always specified prior to the calculation, the sampling effort in aMD tends to be less focused along a specific reaction coordinate. In addition, metadynamics can further benefit from dividing the entire reaction coordinate into separate windows and performing calculations in each window, a commonly-used strategy in enhanced sampling methods (38). As a result, aMD may be generally expected to have a lower efficiency than metadynamics in producing free energy profiles along a chosen reaction coordinate.
However, the lack of predefined reaction coordinates is an advantage of aMD in certain cases: without the need to define a reaction coordinate, the method requires very minimal knowledge of the system being studied. As a result, aMD can be used to explore a system with little prior knowledge of its conformational space and transition states. In fact, previous applications of aMD have used it as a tool to study protein systems with no obvious choice of reaction coordinates (20, 33, 39). Future studies may therefore explore the combination of aMD and other enhanced sampling methods, where the former can be used to probe the system and suggest a possible reaction coordinate, while the latter can be used to obtain the free energy profile along the identified reaction coordinate.
Conclusions
Achieving sufficient sampling of conformational space represents a challenge for most biologically relevant systems studied using MD simulations. The aMD method tackles this problem by modifying the system’s potential energy landscape and reducing barriers separating different states. In this work, we presented the implementation of aMD in the molecular dynamics program NAMD and its application to the model system alanine dipeptide. We showed that aMD simulations performed with NAMD have a small overhead compared with cMD simulations. Through application to the alanine-dipeptide system, we explored the empirical equations used for choosing aMD parameters, and discussed the advantages and limitations of the aMD method. We hope that our NAMD implementation of aMD will provide the basis for future aMD development and application studies.
Supplementary Material
Acknowledgement
We would like to thank Dr. James Phillips, Dr. Peter Freddolino, Dr. César Augusto F. de Oliveira and Dr. Phineus Markwick for valuable suggestions. Work at Univ. of California is supported in part by the National Science Foundation, the National Institutes of Health, Howard Hughes Medical Institute, Center for Theoretical Biological Physics and the National Biomedical Computation Resource. Work at Univ. of Illinois is supported by the National Institutes of Health (R01-GM067887 and P41-RR005969) and the National Science Foundation (PHY0822613). We also appreciate the computational resources provided by the Texas Advanced Computing Center (TG-MCA93S013 and TG-MCB090187).
Footnotes
This is an author-created, un-copyedited version of an article accepted for publication in Computational Science & Discovery. IOP Publishing Ltd is not responsible for any errors or omissions in this version of the manuscript or any version derived from it. The definitive publisher authenticated version is available online at doi: 10.1088/1749-4699/4/1/015002.
References
- 1.Schaeffer R, Fersht A, Daggett V. Curr. Opin. Struct. Biol. 2008;18:4–9. doi: 10.1016/j.sbi.2007.11.007. [DOI] [PMC free article] [PubMed] [Google Scholar]
- 2.Freddolino PL, Schulten K. Biophys. J. 2009;97:2338–2347. doi: 10.1016/j.bpj.2009.08.012. [DOI] [PMC free article] [PubMed] [Google Scholar]
- 3.Gilson M, Zhou H. Annu. Rev. Biophys. Biomol. Struct. 2007;36:21–42. doi: 10.1146/annurev.biophys.36.040306.132550. [DOI] [PubMed] [Google Scholar]
- 4.Lindahl E, Sansom MSP. Curr. Opin. Struct. Biol. 2008;18:425–431. doi: 10.1016/j.sbi.2008.02.003. [DOI] [PubMed] [Google Scholar]
- 5.Khalili-Araghi F, Gumbart J, Wen P-C, Sotomayor M, Tajkhorshid E, Schulten K. Curr. Opin. Struct. Biol. 2009;19:128–137. doi: 10.1016/j.sbi.2009.02.011. [DOI] [PMC free article] [PubMed] [Google Scholar]
- 6.Grubmüller H. Phys Rev E Stat Phys Plasmas Fluids Relat Interdiscip Topics. 1995;52:2893–2906. doi: 10.1103/physreve.52.2893. [DOI] [PubMed] [Google Scholar]
- 7.Lange O, Schäfer L, Grubmüller H. J. Comp. Chem. 2006;27:1693–1702. doi: 10.1002/jcc.20473. [DOI] [PubMed] [Google Scholar]
- 8.Voter A. Phys. Rev. Lett. 1997;78:3908–3911. [Google Scholar]
- 9.Voter A. J. Chem. Phys. 1997;106:4665. [Google Scholar]
- 10.Bussi G, Laio A, Parrinello M. Phys. Rev. Lett. 2006;96:090601. doi: 10.1103/PhysRevLett.96.090601. [DOI] [PubMed] [Google Scholar]
- 11.Leone V, Marinelli F, Carloni P, Parrinello M. Curr. Opin. Struct. Biol. 2010;20:148–154. doi: 10.1016/j.sbi.2010.01.011. [DOI] [PubMed] [Google Scholar]
- 12.Darve E, Pohorille A. J. Chem. Phys. 2001;115:9169–9183. [Google Scholar]
- 13.Darve E, Rodríguez-Gómez D, Pohorille A. J. Chem. Phys. 2008;128:144120. doi: 10.1063/1.2829861. [DOI] [PubMed] [Google Scholar]
- 14.Hénin J, Fiorin G, Chipot C, Klein M. J. Chem. Theor. Comp. 2010;6:35–47. doi: 10.1021/ct9004432. [DOI] [PubMed] [Google Scholar]
- 15.Hamelberg D, Mongan J, McCammon J. J. Chem. Phys. 2004;120:11919–11929. doi: 10.1063/1.1755656. [DOI] [PubMed] [Google Scholar]
- 16.Hamelberg D, Shen T, McCammon J. J. Am. Chem. Soc. 2005;127:1969–1974. doi: 10.1021/ja0446707. [DOI] [PubMed] [Google Scholar]
- 17.Hamelberg D, McCammon J. J. Am. Chem. Soc. 2005;127:13778–13779. doi: 10.1021/ja054338a. [DOI] [PubMed] [Google Scholar]
- 18.de Oliveira C, Hamelberg D, McCammon J. J. Chem. Phys. 2007;127:175105. doi: 10.1063/1.2794763. [DOI] [PubMed] [Google Scholar]
- 19.Markwick P, Bouvignies G, Salmon L, McCammon J, Nilges M, Blackledge M. J. Am. Chem. Soc. 2009;131:16968–16975. doi: 10.1021/ja907476w. [DOI] [PMC free article] [PubMed] [Google Scholar]
- 20.Grant B, Gorfe A, McCammon J. PLoS Comput. Biol. 2009;5:e1000325. doi: 10.1371/journal.pcbi.1000325. [DOI] [PMC free article] [PubMed] [Google Scholar]
- 21.Markwick P, Cervantes C, Abel B, Komives E, Blackledge M, McCammon J. J. Am. Chem. Soc. 2010;132:1220–1221. doi: 10.1021/ja9093692. [DOI] [PMC free article] [PubMed] [Google Scholar]
- 22.Williams S, de Oliveira C, McCammon J. J. Chem. Theor. Comp. 2010;6:560–568. doi: 10.1021/ct9005294. [DOI] [PMC free article] [PubMed] [Google Scholar]
- 23.Phillips JC, Braun R, Wang W, Gumbart J, Tajkhorshid E, Villa E, Chipot C, Skeel RD, Kale L, Schulten K. J. Comp. Chem. 2005;26:1781–1802. doi: 10.1002/jcc.20289. [DOI] [PMC free article] [PubMed] [Google Scholar]
- 24.Humphrey W, Dalke A, Schulten K. J. Mol. Graphics. 1996;14:33–38. doi: 10.1016/0263-7855(96)00018-5. [DOI] [PubMed] [Google Scholar]
- 25.de Oliveira C, Hamelberg D, McCammon J. J. Phys. Chem. B. 2006;110:22695–22701. doi: 10.1021/jp062845o. [DOI] [PMC free article] [PubMed] [Google Scholar]
- 26.Hamelberg D, de Oliveira C, McCammon J. J. Chem. Phys. 2007;127:155102. doi: 10.1063/1.2789432. [DOI] [PubMed] [Google Scholar]
- 27.MacKerell AD, Jr, et al. J. Phys. Chem. B. 1998;102:3586–3616. doi: 10.1021/jp973084f. [DOI] [PubMed] [Google Scholar]
- 28.MacKerell AD, Jr, Feig M, Brooks CL., III J. Comp. Chem. 2004;25:1400–1415. doi: 10.1002/jcc.20065. [DOI] [PubMed] [Google Scholar]
- 29.Andersen HC. J. Chem. Phys. 1983;52:24–34. [Google Scholar]
- 30.Miyamoto S, Kollman PA. J. Comp. Chem. 1993;13:952–962. [Google Scholar]
- 31.Darden T, York D, Pedersen L. J. Chem. Phys. 1993;98:10089–10092. [Google Scholar]
- 32.Cornell WD, Cieplak P, Bayly CI, Gould IR, Merz KM, Jr, Ferguson DM, Spellmeyer DC, Fox T, Caldwell JW, Kollman PA. J. Am. Chem. Soc. 1995;117:5179–5197. [Google Scholar]
- 33.Markwick P, Bouvignies G, Blackledge M. J. Am. Chem. Soc. 2007;129:4724–4730. doi: 10.1021/ja0687668. [DOI] [PubMed] [Google Scholar]
- 34.Shen T, Hamelberg D. J. Chem. Phys. 2008;129:034103. doi: 10.1063/1.2944250. [DOI] [PubMed] [Google Scholar]
- 35.Fajer M, Hamelberg D, McCammon J. J. Chem. Theor. Comp. 2008;4:1565–1569. doi: 10.1021/ct800250m. [DOI] [PMC free article] [PubMed] [Google Scholar]
- 36.Fajer M, Swift R, McCammon J. J. Comp. Chem. 2009;30:1719–1725. doi: 10.1002/jcc.21285. [DOI] [PMC free article] [PubMed] [Google Scholar]
- 37.Wereszczynski J, McCammon JA. J. Chem. Theor. Comp. 2010;6:3285–3292. doi: 10.1021/ct100322t. [DOI] [PMC free article] [PubMed] [Google Scholar]
- 38.Chipot C, Pohorille A. Free Energy Calculations. Theory and applications in chemistry and biology. Springer Verlag; 2007. [Google Scholar]
- 39.Grant B, Gorfe A, McCammon J. Curr. Opin. Struct. Biol. 2010;20:142–147. doi: 10.1016/j.sbi.2009.12.004. [DOI] [PMC free article] [PubMed] [Google Scholar]
Associated Data
This section collects any data citations, data availability statements, or supplementary materials included in this article.


